A flooring contractor tracking fifteen numbers a month is tracking one hundred and eighty numbers a year, and in most firms they live in a different place each time – square footage in the job sheet, margin in the accounts package, callbacks in somebody’s inbox. The Flooring Installation KPI Dashboard in Excel puts all fifteen on one page, scores each one against target and against last year, and colours it On Target, At Risk or Missed. It is built entirely from worksheet formulas: no Power Query, no data model, no macros, no add-ins. Eleven sheets, a full twelve months of sample data, and headroom for 22 KPIs before a single formula needs editing.

One thing to be clear about before you read further, because three template families on NextGenTemplates carry near-identical names. This is the KPI Dashboard line: a month picker, traffic lights, a dedicated KPI Trend page and a KPI Analysis page. It is not the analytical, slicer-and-pivot Flooring and Tiles Dashboard, and it is not the lighter Flooring Installation KPI Scorecard. All three exist, and they are different products.
Key Features of the Flooring Installation KPI Dashboard in Excel
One dropdown drives the whole scorecard
Cell D6 on the KPI Dashboard sheet is a dropdown of the twelve months of your reporting year. Change it and every MTD and YTD figure, every achievement percentage, every status badge and the entire KPI Analysis page follow it. There is no refresh step, no query to run and no macro to enable, so the file behaves the same on a locked-down site laptop as it does on your own desk.
Direction-aware scoring, so cost KPIs are not punished
Each KPI is marked UTB (upper the better) or LTB (lower the better) on the KPI Definition sheet. Achievement is calculated as Actual / Target for a UTB KPI and Target / Actual for an LTB one. That matters here more than in most trades: five of the fifteen KPIs in this build are LTB – Receivables Days Sales Outstanding, Callback & Warranty Claim Rate, Material Waste & Offcut Rate, Damaged Material on Delivery Rate and Measure-to-Install Cycle Time. Cutting your waste rate below target scores above 100%, exactly as beating a revenue target does. The arrows follow the same logic, which is why a falling callback rate shows a green down-arrow.
Traffic lights you can move
On Target from 100%, At Risk from 95% to 99%, Missed below 95%. Those cut-offs are ordinary formulas in columns L and U of the KPI Dashboard sheet, not hard-coded conditional formatting rules buried in a dialog. Edit them to match whatever your own governance says a miss is.
Seven summary cards across the top
Total KPIs Tracked, On Target (YTD), At Risk (YTD), Missed (YTD), Improving vs PY (MTD), Avg Achievement (MTD) and Avg Achievement (YTD). In the shipped sample month – September 2025 – they read 15, 8, 4, 3, 11 of 15, 100.4% and 99.2%. The cards recount themselves when you add or clear a KPI.
Add a KPI without writing a formula
The sheets are wired for 22 KPIs and 15 are filled in, so seven rows are live and empty. Type a new KPI on KPI Definition – number, group, name, unit, formula, definition, type, owner, priority, frequency – and the three input sheets pick the name up immediately, then the scorecard, trend page and analysis page follow. Renaming works the same way: change it on KPI Definition only.
Dashboard Pages Explanation
KPI Dashboard – the scorecard
The month dropdown, the seven summary cards, and one row per KPI. Each row carries the KPI number, group, name, unit and type, then a Month To Date block (Actual, Target, Ach %, Status, Prior Yr, vs PY) and a Year To Date block with the same six columns. In the sample data, Square Feet Installed shows 67,272.00 against a 71,182.00 target – 94.5%, Missed – while its year to date sits at 103.1% and On Target. That contrast between a bad month and a good year is exactly what a single-number report hides.
KPI Trend – one KPI, twelve months, two charts
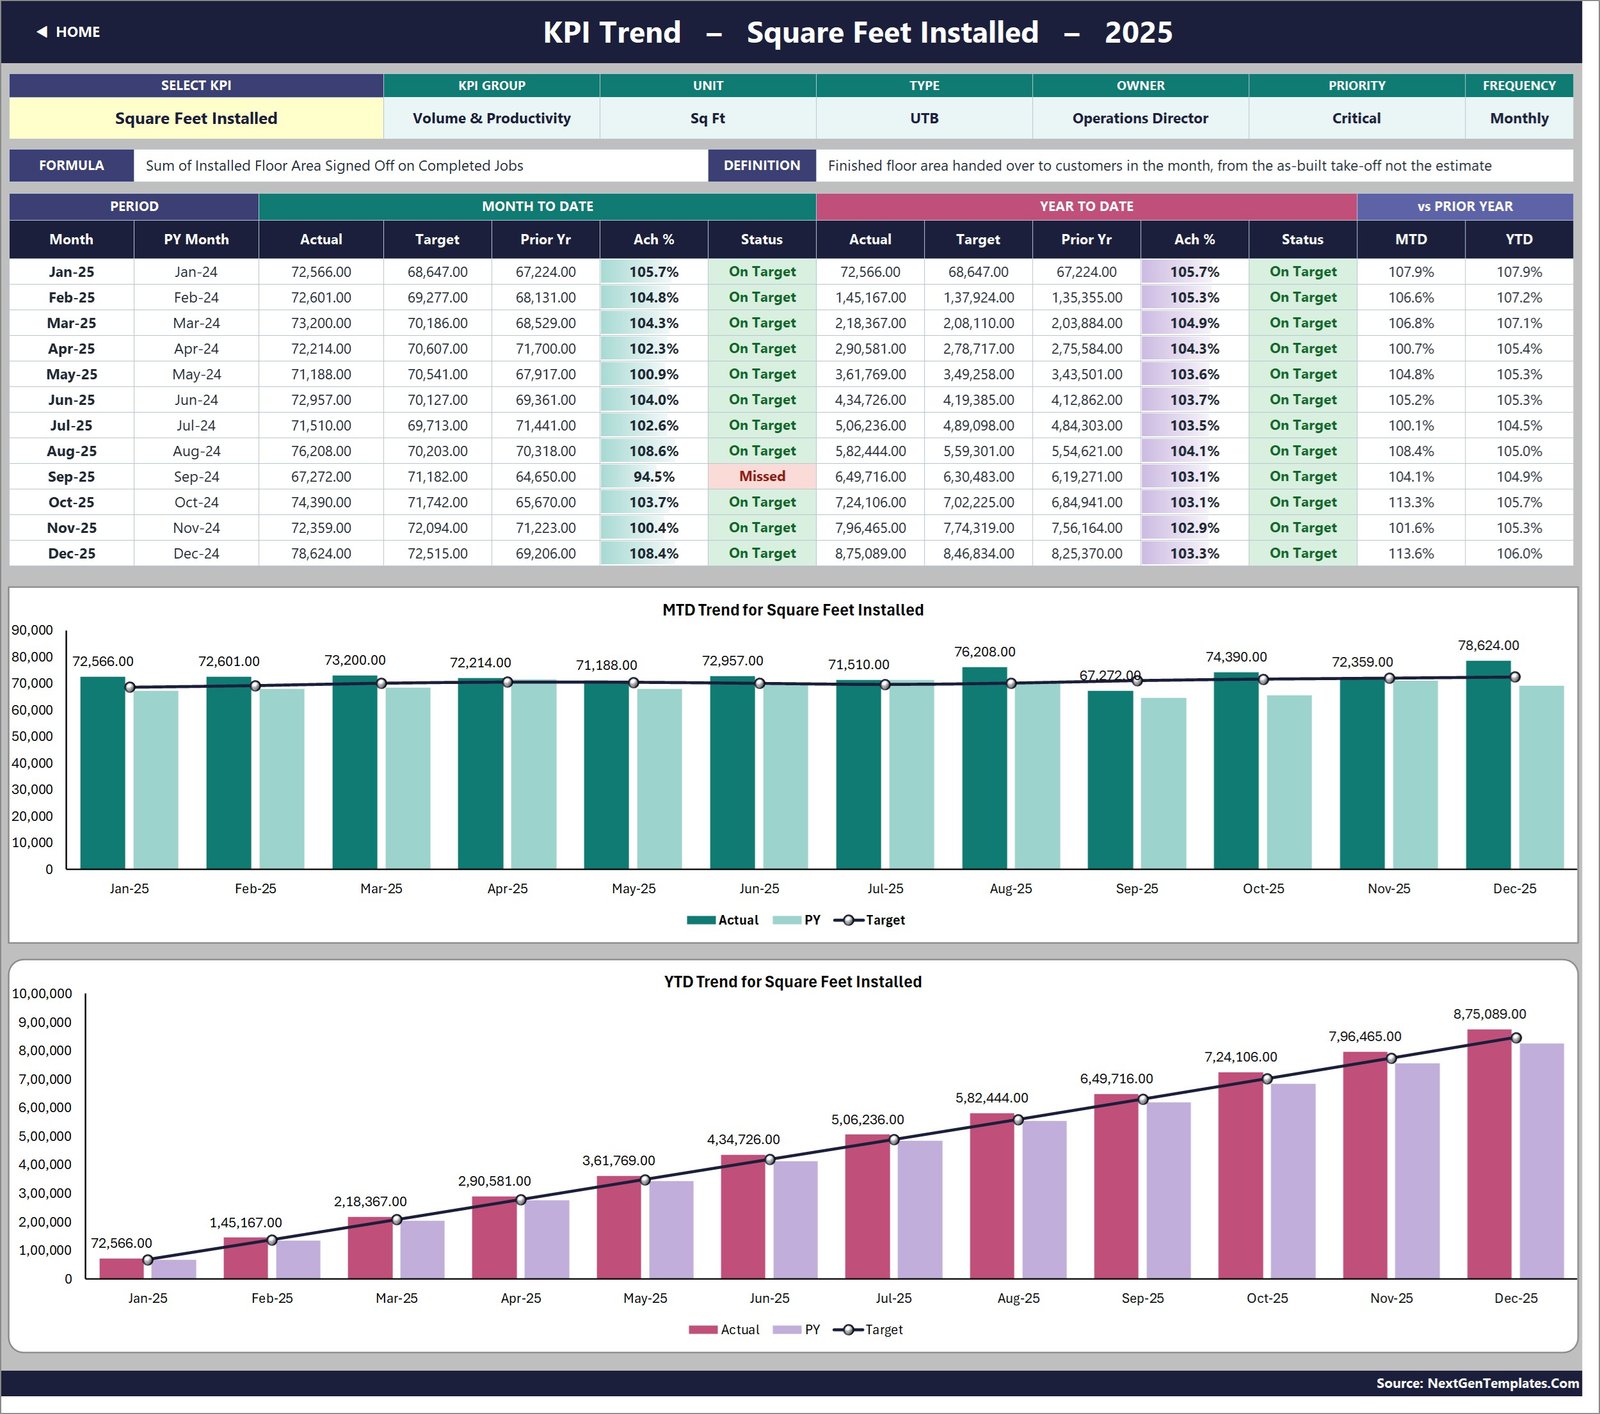
Pick any KPI in cell B4. The attribute strip refreshes with its group, unit, type, owner, priority and frequency, and the formula and definition text load beneath it. Below that sits a twelve-month table – MTD actual, target, prior year, achievement and status, then the same for YTD, then MTD and YTD movement against prior year – and two combo charts. Both plot Actual and Prior Year as columns with a Target line: MTD Trend for [KPI] and YTD Trend for [KPI]. This is the page you print when a main contractor questions one number.
KPI Analysis – group roll-up and the extremes

Performance by KPI Group counts how many KPIs in each of the seven groups are On Target, At Risk or Missed and averages their MTD and YTD achievement. An Average YTD Achievement by KPI Group bar chart sits underneath. To the right, Top 5 and Bottom 5 Performing KPIs (YTD) rank every KPI by year-to-date achievement – in the sample data the bottom three are On-Time Installation Completion % at 91.9%, Installer Certification Coverage % at 94.5% and Callback & Warranty Claim Rate at 94.5%, all flagged Missed. Everything on the page follows the month you picked on the scorecard.
The three input sheets
KPI Input – Actual, KPI Input – Target and KPI Input – PY. Each holds an MTD and a YTD column for every month of the year, and the KPI rows on all three are driven by KPI Definition so they always line up. Cell E3 on KPI Input – Actual is the first month of the reporting year; change it and the target sheet, the prior-year sheet, the month dropdown and every sheet title re-base with it.
KPI Definition – the master list

All fifteen KPIs with a written formula and a plain-English definition. Measure-to-Install Cycle Time, for instance, is “Sum of (Installation Start Date – Site Measure Date) / Jobs Started”, defined as calendar days from the on-site laser measure to the first day of installation. Subfloor Moisture Test Compliance % counts jobs over concrete with a dated RH or calcium chloride reading filed before adhesive went down. Owners are named per KPI – Operations Director, Quality Manager, Scheduling Coordinator, Purchasing Lead and so on – so the review has somebody to ask.
Home, Read Me, Support and Get More Templates
Home is a navigation page. Read Me is a five-minute setup guide plus the rules the numbers follow. Support holds the helper calculations behind the dropdowns, arrow glyphs and rankings – nothing there needs editing. Get More Templates links to the rest of the catalogue.
The 15 KPIs, by group
- Volume & Productivity – Square Feet Installed; Installed Sq Ft per Crew-Day
- Financial – Job Gross Margin %; Average Job Value; Receivables Days Sales Outstanding
- Installation Quality – First-Time-Right Installation Rate; Callback & Warranty Claim Rate
- Materials – Material Waste & Offcut Rate; Damaged Material on Delivery Rate
- Scheduling – On-Time Installation Completion %; Measure-to-Install Cycle Time
- Compliance & Safety – Installer Certification Coverage %; Subfloor Moisture Test Compliance %
- Sales & Customer – Estimate-to-Close Win Rate; Customer Satisfaction Score (NPS)
Flooring Installation KPI Dashboard in Excel vs. Google Sheets vs. Paid Field-Service SaaS
| This template (Excel) | Google Sheets KPI scorecard | Paid field-service SaaS | |
|---|---|---|---|
| Cost | One payment, 19.99 (12.99 on sale) | One payment, typically 13.99 | Per user, per month |
| Platform | Excel 2013+, Excel for the web | Browser, Google account | Vendor cloud |
| Setup time | Type your numbers into three sheets | Copy the sheet, then type | Onboarding and data mapping |
| Real-time team collaboration | Via OneDrive or SharePoint | Yes, natively | Yes |
| Mobile access | Excel mobile app | Browser and Sheets app | Native apps |
| Customisable KPIs | Rename or add on one sheet, wired to 22 | Same approach | Vendor-defined fields |
| Share with a link | Cloud storage link | Yes | Yes |
| Year-1 cost at 5 users | 19.99 total | 13.99 total | Often four figures |
| Direction-aware (LTB) scoring | Built in, per KPI | Built in, per KPI | Varies by vendor |
| Formulas you can read and trace | Yes, every cell | Yes | No |
Who Should Use This Template
Flooring installation contractors, floor-covering subcontractors, retail flooring showrooms with their own fitting crews, and commercial flooring firms working across carpet, vinyl, LVT, laminate, timber and tile. It fits an owner or operations director who already knows their monthly numbers and wants one page that scores them, and it fits anyone who reports the same figures to a main contractor or builder every month.
It will not suit you if you expect the workbook to calculate KPIs from job records – it does not hold job, customer or invoice data at all. It is also not an estimating or scheduling tool, and it does not connect to an accounting package.
Real-World Use Cases
A 40-crew commercial flooring firm. The monthly ops review runs off one screen: Installed Sq Ft per Crew-Day and On-Time Installation Completion % for productivity, First-Time-Right and Callback & Warranty Claim Rate for quality. When on-time completion lands at 91.5% against a 94.87% target, the Bottom 5 table names it before anyone opens a job file.
A residential flooring and tiling business. The owner watches Average Job Value, Job Gross Margin % and Estimate-to-Close Win Rate, with Receivables Days Sales Outstanding marked LTB so a falling DSO reads as a win rather than a shortfall.
A subcontractor under main-contractor audit. The quality manager owns Subfloor Moisture Test Compliance % and Installer Certification Coverage %. Both get printed straight off KPI Trend, with the twelve-month table and target line, whenever either is questioned.
Advantages of the Flooring Installation KPI Dashboard in Excel
- Everything is a plain worksheet formula – VLOOKUP, MATCH, INDEX, COUNTIF – so you can trace any number back to its source with Excel’s formula auditing tools.
- No add-in, no data model and no macro means it opens on restricted corporate machines and in Excel for the web.
- The twelve months of sample data mean every chart, badge and ranking works the moment you open the file.
- Nothing is locked, hidden or password-protected – re-colour it, add your logo, delete a page.
- One payment, no subscription, no seat count.
Opportunities for Improvement
Honest notes, so nothing surprises you after purchase:
- YTD is typed, not derived. Every input sheet has an MTD and a YTD column and you fill both. That is a deliberate design decision – volumes accumulate through the year while rates, ratios and per-unit costs are running averages – but it does mean the workbook will not stop you entering a YTD that disagrees with your months.
- The Home page and the Read Me both say “14 KPIs” while the file ships 15. It is a label left over from the template this build was filled from; everything that actually calculates uses all 15, and the scorecard’s own Total KPIs Tracked card reads 15.
- The Read Me’s “Cumulative or average YTD” note still uses aerospace examples (“aircraft deliveries, non-conformance reports”) rather than flooring ones. The rule it describes is correct; only the illustration is from a sibling build.
- Large numbers on the Square Feet Installed rows use Indian digit grouping – 6,49,716.00 where most readers expect 649,716.00. It is a number format on those cells, changed in seconds with Format Cells.
- The Frequency column is documentation, not a switch. Two KPIs are marked Weekly and one Quarterly, but every input grid is monthly.
Best Practices
- Set cell E3 on KPI Input – Actual before you type anything else; it re-bases the whole workbook.
- Edit KPI Definition first and get the KPI names, units and UTB/LTB flags right. Everything downstream follows that sheet.
- Name a real owner per KPI. A scorecard with an owner column gets acted on; one without it gets admired.
- Decide your YTD convention once – cumulative for volumes, running average for rates – and stick to it across all three input sheets.
- Move the thresholds in columns L and U if 95% is not what your business calls At Risk.
- Keep one file per year, or extend the input sheets, rather than overwriting last year’s numbers – the prior-year comparison depends on them.
Explore Relevant Templates
- Flooring Installation KPI Dashboard in Excel – the template this post is about.
- Flooring Installation KPI Dashboard in Power BI – the same scorecard rebuilt as a .pbix report.
- Flooring Installation KPI Scorecard in Excel – the lighter scorecard line, same subject.
- Flooring and Tiles Dashboard in Excel – the analytical line, with slicers and pivots over transaction rows.
- HVAC Contractor KPI Dashboard in Excel, Plumbing Business KPI Dashboard in Excel and Electrical Contractor KPI Dashboard in Excel – the same scorecard pattern for neighbouring trades.
Frequently Asked Questions
Does the dashboard calculate KPIs from my job data?
No. You enter MTD and YTD figures for each KPI on three input sheets, and the workbook handles achievement, direction, status, ranking, trend charts and the group roll-up. Each KPI ships with a written formula on KPI Definition so you know exactly what to compute before you type it.
Do I need Power Query, Power Pivot or macros?
None of them. Every number is a worksheet formula. There is no data model and no add-in, so there is nothing to install and nothing to enable.
Can I add more than 15 KPIs?
Yes – the sheets are wired for 22, so seven rows are already live and empty. To go past 22, fill down the last data row on each sheet and widen the ranges in the summary cards on KPI Dashboard row 4 and in the helper columns on Support.
How is this different from the Flooring Installation KPI Scorecard in Excel?
Different product line. This one carries 15 KPIs in 7 groups, a dedicated KPI Trend page with two combo charts per KPI, and a KPI Analysis page with a group roll-up plus top and bottom five. The Scorecard is the lighter build. Buy this one if the trend and analysis pages matter to you.
Will it open in Excel for the web or on a Mac?
Yes. Because there are no macros and no add-ins, the file opens in Excel 2013 and later on Windows, in Excel for Mac and in Excel for the web.
Is the sample data real?
No. The twelve months of 2025-dated figures are demonstration data so every formula, chart and traffic light is visible before you type anything. Clear the three input sheets and the workbook follows your numbers.
Can I rebrand it?
Yes. Nothing is locked, hidden or password-protected, so colours, logos and layout are all yours to change.
About the Author
Built by PK – Microsoft Certified Professional with 15+ years of Excel, Google Sheets, and Power BI experience. Founder of NextGenTemplates, reaching 300K+ subscribers across YouTube channels. Every template is hand-built and tested before release.
Conclusion
The value of a KPI scorecard is not the arithmetic – any of us can divide actual by target. It is that fifteen numbers sit in one place, scored the same way every month, with an owner beside each one and last year’s figure next to it. The Flooring Installation KPI Dashboard in Excel does that for a flooring business in a file that opens anywhere, costs once, and hides nothing from you. Set the year in one cell, type your numbers into three sheets, and pick a month.
For walkthroughs of this and other Excel dashboards, subscribe at youtube.com/@PKAnExcelExpert.