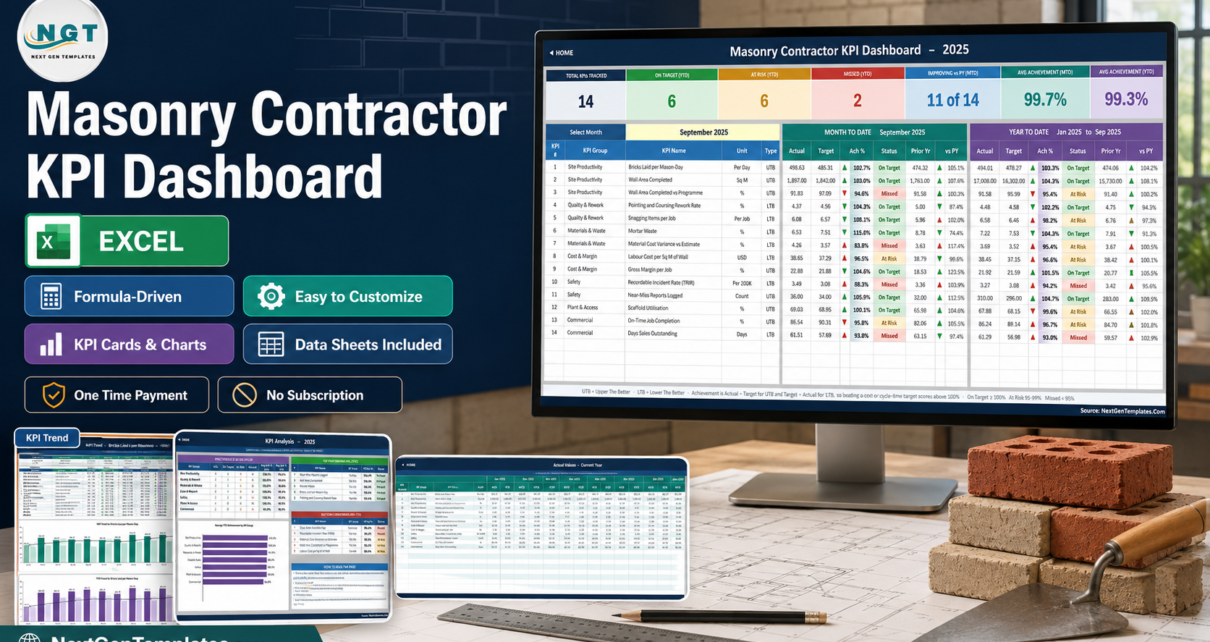
Most masonry subcontractors already collect the numbers a monthly review needs. Bricks laid, wall area signed off, mortar wasted, snags at handover, hours worked, days to get paid – it all exists somewhere, usually in a different file per topic and a different owner per file. The Masonry Contractor KPI Dashboard in Excel puts 14 of those numbers on one page and scores them, so the review starts from a position rather than from a search.
The workbook holds 14 KPIs across 7 groups in 11 sheets, is wired for up to 22 KPI rows before any formula edit is needed, and ships with a complete 2025 sample year plus its 2024 comparative. Every value is a plain worksheet formula – no macros, no Power Query and no data model – so it opens in Excel 2013 and later and in Excel for the web.
One thing to be clear about before anything else: this is the KPI Dashboard line – a month-picker scorecard with traffic lights, a KPI Trend page and a KPI Analysis page. It is not the chart-led analytical Excel dashboard that sits on a transaction table, and it is not the shorter 10-KPI Excel KPI Scorecard. Same family name, three different shapes.
Key Features of the Masonry Contractor KPI Dashboard in Excel
- 14 masonry KPIs in 7 groups. Site Productivity (3), Quality & Rework (2), Materials & Waste (2), Cost & Margin (2), Safety (2), Plant & Access (1), Commercial (2).
- One dropdown drives the whole pack. Cell D6 on the KPI Dashboard sheet sets the reporting month; the scorecard, the seven summary cards and the KPI Analysis page all follow it.
- MTD and YTD on the same row. Actual, target, achievement %, status, prior year and vs-PY, twice – once for the month, once for the year to date.
- Direction-aware scoring. Each KPI is tagged UTB (Upper The Better) or LTB (Lower The Better), so beating a waste or cost target scores above 100% rather than reading as a shortfall.
- Editable thresholds. On Target from 100%, At Risk 95-99%, Missed below 95%, set in columns L and U on the KPI Dashboard sheet.
- A trend page per KPI. Pick a KPI in cell B4 on KPI Trend and its attribute strip, formula, definition, twelve-month table and two combo charts all redraw.
- An analysis page that ranks. Achievement rolled up by KPI group with a bar chart, plus Top 5 and Bottom 5 performing KPIs for the year to date.
- Governance built in. Owner, priority and frequency are recorded per KPI – Site Manager, Contracts Manager, Quality Manager, Commercial Manager, Finance Manager, Health & Safety Manager, Yard and Plant Manager, Operations Director.
Dashboard Pages Explanation
Home
A navigation page. Three columns – Dashboard Pages, Input Sheets and Reference & Help – each linking straight to its sheet, with a “What this template does” panel underneath covering the month picker, direction-aware scoring, adding KPIs without formula work and the fact that nothing needs installing or refreshing.
KPI Dashboard
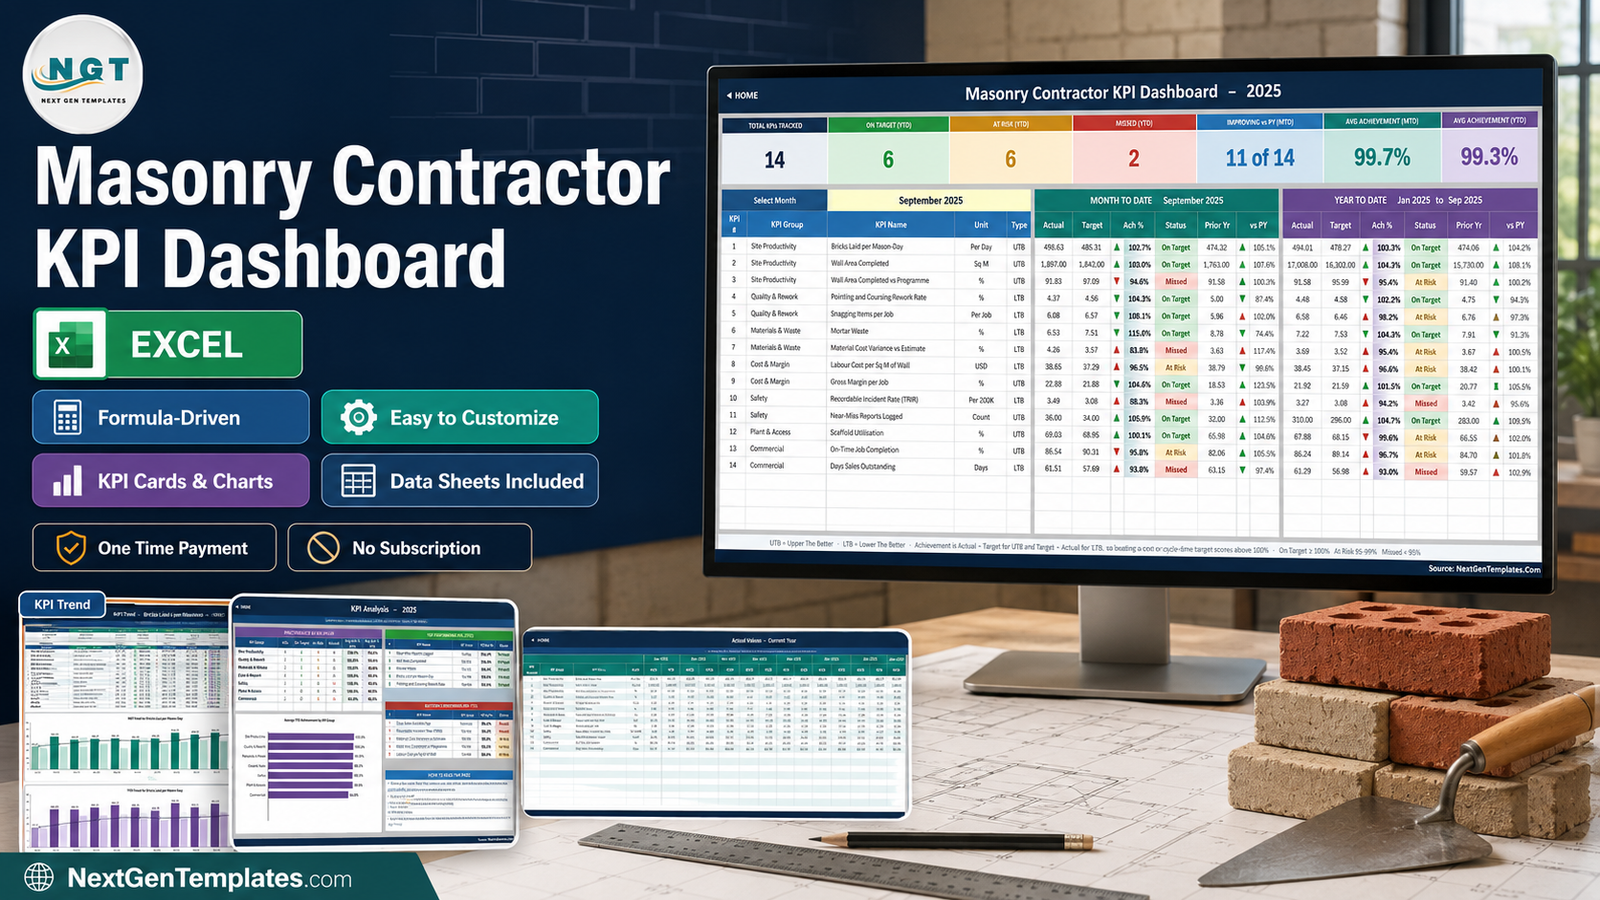
The scorecard, and the page you will spend your review on. Seven summary cards run across the top: Total KPIs Tracked, On Target (YTD), At Risk (YTD), Missed (YTD), Improving vs PY (MTD), Avg Achievement (MTD) and Avg Achievement (YTD). Below them, one row per KPI carries the group, name, unit and type, then a Month To Date block and a Year To Date block – each with actual, target, achievement, status, prior year and vs-PY.
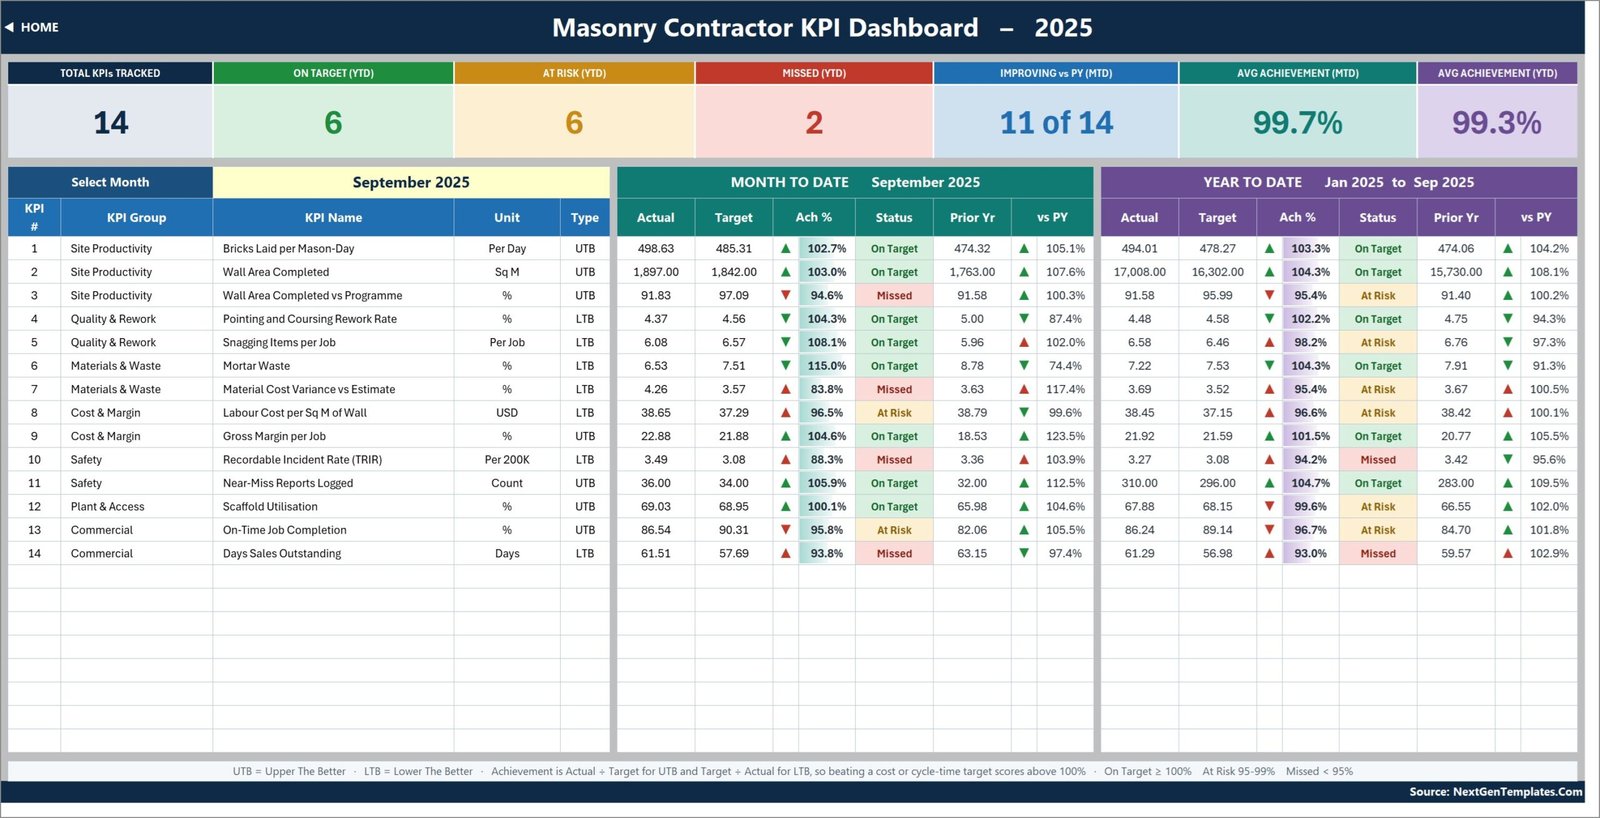
In the sample year, September 2025 reads 6 On Target, 6 At Risk and 2 Missed on the year to date, with average YTD achievement at 99.3% and 11 of 14 KPIs improving on the prior year. Wall Area Completed vs Programme and Days Sales Outstanding are the two rows carrying a Missed flag on the month – which is exactly the kind of split the page is meant to surface in one look.
KPI Trend
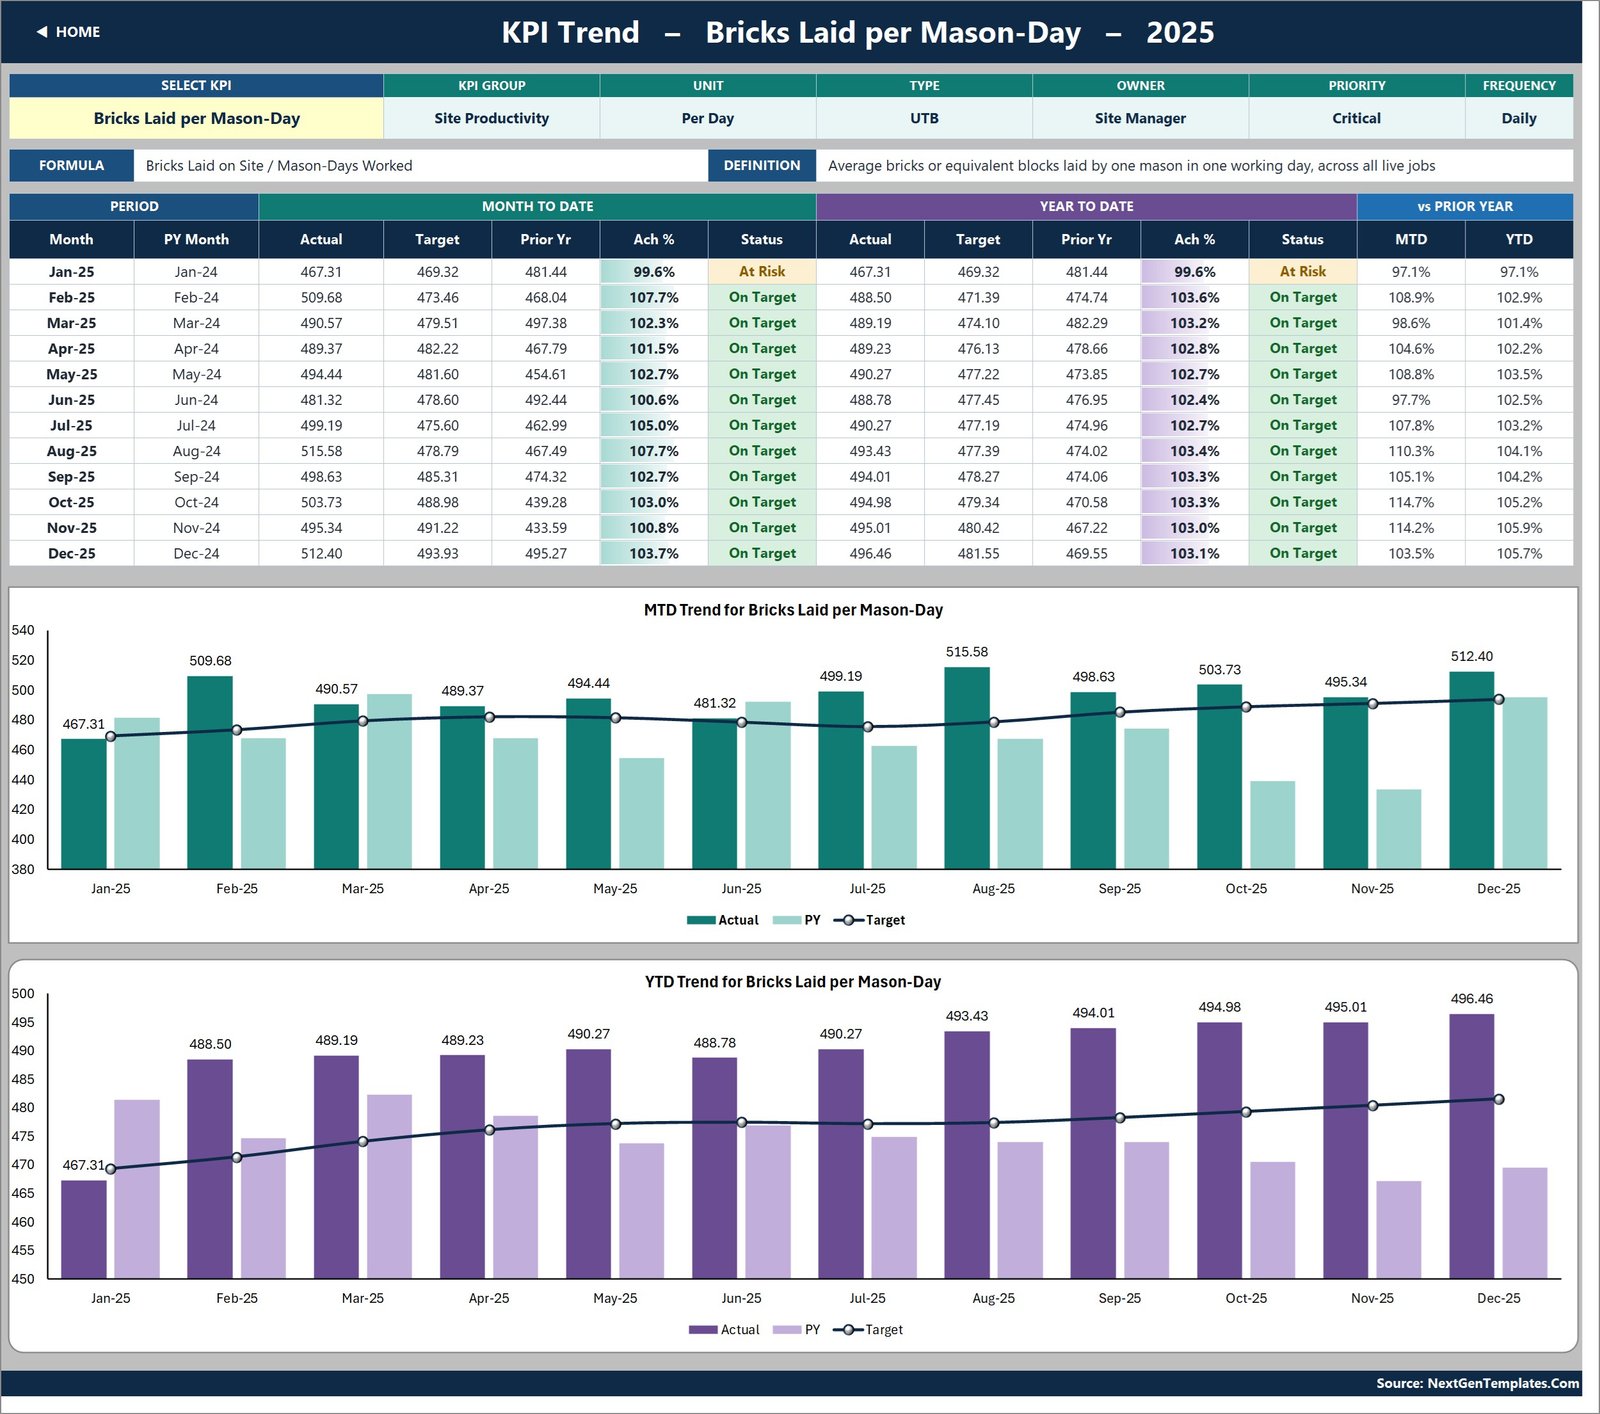
One KPI at a time. The attribute strip at the top shows group, unit, type, owner, priority and frequency, then the formula and definition in full, then a twelve-month table with MTD and YTD actual, target, prior year, achievement and status side by side. Underneath sit two combo charts – MTD and YTD – each plotting actual and prior-year columns against a target line.
KPI Analysis
Two questions answered on one page: which groups are carrying the year, and which individual KPIs are at each end of it. A Performance by KPI Group table counts On Target, At Risk and Missed per group with average MTD and YTD achievement, an Average YTD Achievement by KPI Group bar chart sits below it, and Top 5 and Bottom 5 tables rank every KPI on YTD achievement. A short “How to read this page” panel explains that the ranking is direction-aware, so a lower-is-better KPI that beats its target ranks near the top.

KPI Input – Actual, Target and PY
The only three sheets you normally type into. Each holds an MTD and a YTD column for every month, with rows driven by the KPI Definition sheet so all three always line up. Cell E3 on the Actual sheet is the first month of the reporting year; change it and the Target sheet, the Prior Year sheet, the month dropdown and every sheet title re-base automatically.
KPI Definition, Read Me and Get More Templates
KPI Definition is the master list – number, group, name, unit, formula, definition, type, owner, priority, frequency – and every other sheet follows it. Read Me documents how the workbook is wired, the MTD/YTD and UTB/LTB rules and how to add, rename or remove a KPI. Get More Templates links back to the catalogue. A hidden Support sheet holds the helper calculations; nothing on it needs editing.
The 14 KPIs, and why each one is on the sheet
Site Productivity. Bricks Laid per Mason-Day (Per Day, UTB) is the gang’s raw output rate. Wall Area Completed (Sq M, UTB) is the measured area signed off by the client’s surveyor. Wall Area Completed vs Programme (%, UTB) sets that against what the construction programme actually called for.
Quality & Rework. Pointing and Coursing Rework Rate (%, LTB) is the share of completed walling taken down or re-pointed for coursing, plumb, gauge or joint defects. Snagging Items per Job (Per Job, LTB) counts what the clerk of works lists at handover.
Materials & Waste. Mortar Waste (%, LTB) captures mixed mortar that went off on the spot board or was over-batched. Material Cost Variance vs Estimate (%, LTB) shows how far bricks, blocks, sand and cement ran over the tender build-up.
Cost & Margin. Labour Cost per Sq M of Wall (USD, LTB) is the fully loaded gang cost per square metre. Gross Margin per Job (%, UTB) is what is left after labour, materials, plant and scaffold hire.
Safety. Recordable Incident Rate or TRIR (Per 200K, LTB) follows the standard OSHA recordable-injury basis of injuries per 200,000 hours worked. Near-Miss Reports Logged (Count, UTB) is deliberately scored the other way – a rising count means the reporting culture is working.
Plant & Access. Scaffold Utilisation (%, UTB) is the share of hired scaffold days a gang was actually laying from rather than paying for idle steel.
Commercial. On-Time Job Completion (%, UTB) and Days Sales Outstanding (Days, LTB) close the loop from handover to cash.
Masonry Contractor KPI Dashboard in Excel vs. Google Sheets vs. Paid Construction SaaS – Feature Comparison
| This Excel KPI Dashboard | Google Sheets KPI template | Procore / Buildertrend | |
|---|---|---|---|
| Cost | $12.99 one time | $8.99 one time | $300-$1,000+ per month |
| Platform | Excel 2013+, Excel for the web | Browser, Google account | Web and mobile app |
| Setup time | Under 30 minutes | Under 30 minutes | Weeks, with onboarding |
| Real-time collaboration | Via OneDrive or SharePoint | Yes, native | Yes, native |
| Mobile access | Excel mobile app | Yes | Yes |
| Customisable KPI list | Yes – one master sheet | Yes | Limited to vendor fields |
| Share with a link | Via cloud storage | Yes | Yes, per seat |
| Year-1 cost at 5 users | $12.99 | $8.99 | $3,600-$12,000+ |
| Direction-aware (UTB/LTB) scoring | Yes, per KPI | Yes, per KPI | Varies by module |
| Where the data lives | A file you own | Your Google Drive | Vendor hosted |
Who Should Use This Template
Bricklaying and stonework subcontractors reporting monthly to a main contractor. Small-to-mid masonry firms running several live jobs at once. Contracts managers and commercial managers who need one printable page for a monthly review. Health and safety managers who want TRIR and near-miss reporting scored on the same sheet as productivity, so safety is not a separate conversation.
It is less useful if you want live capture on site – there is no app or form here – or if you need takeoff and estimating. It does not connect to Procore, Sage or Xero either; monthly figures are typed in.
Real-World Use Cases
The monthly commercial review. A contracts manager opens the KPI Dashboard sheet, sets the month, and walks the table top to bottom. Wall Area Completed vs Programme is usually the first row the main contractor asks about; having its YTD achievement and its Bottom 5 ranking already on screen turns that into a recovery plan rather than a defence.
Pricing the next tender. A commercial manager reads Labour Cost per Sq M of Wall and Material Cost Variance vs Estimate on the twelve-month KPI Trend page instead of a single month, so the rate that goes into the build-up reflects the year rather than one bad valuation period.
The safety stand-down. TRIR is scored lower-is-better and Near-Miss Reports Logged higher-is-better. Reading them together catches the pattern that matters: near-miss reporting falling while recordable injuries climb.
Advantages of the Masonry Contractor KPI Dashboard in Excel
- It opens. No macro prompt, no query refresh, no add-in, no data-model load. That matters when the file has to go to a main contractor who will not enable anything.
- The formulas are readable. VLOOKUP, MATCH, INDEX and COUNTIF – you can trace any number back to an input cell. See the Microsoft VLOOKUP reference if you want to extend them.
- Scoring is honest about direction. LTB KPIs are not penalised for being small, which is where most home-made KPI sheets go wrong.
- Changing the KPI list costs nothing. Rename on KPI Definition and every sheet follows; eight spare rows are already live.
- You own the file. One payment, no seats, no renewal.
Opportunities for Improvement
Being straight about the limits: monthly figures are entered by hand, so somebody has to own that step. YTD is stored rather than derived, which gives you control but means the YTD column has to be maintained alongside MTD. There is no per-job breakdown – the dashboard reports the business, not each contract – and there is no automatic export to PDF or PowerPoint. If you need job-level drilldown, pair it with a job management system rather than stretching the workbook.
Best Practices
- Set cell E3 on KPI Input – Actual before you type anything; every sheet re-bases from it.
- Edit the KPI list on KPI Definition first, then fill the numbers – not the other way round.
- Agree the UTB/LTB flag per KPI with whoever owns it, and record the owner in the file.
- Fill the Prior Year sheet even if it is approximate; the vs-PY columns and the Improving vs PY card are where the story usually is.
- Match the thresholds in columns L and U to your own governance instead of arguing with the defaults.
- Keep the sample year in a copy for a while, so you have a working reference if a formula gets overwritten.
Explore Relevant Templates
- HVAC Contractor KPI Dashboard in Excel
- Electrical Contractor KPI Dashboard in Excel
- Plumbing Business KPI Dashboard in Excel
- Roofing Contractor KPI Scorecard in Excel
- Electrical Contractor KPI Dashboard in Power BI
Frequently Asked Questions
Does the workbook need macros or Power Query?
No. Every number is a worksheet formula. There is no macro, no query to refresh and no add-in, and it opens in Excel 2013 and later as well as Excel for the web.
Can I replace the 14 KPIs with my own?
Yes. Change them on the KPI Definition sheet only; the three input sheets, the scorecard, the trend page and the analysis page all read the names from there. The sheets are wired for 22 rows and 14 are used, so eight more need no formula work.
Why do some rows show more than 100% achievement on a cost KPI?
Because achievement is Actual / Target for a UTB KPI and Target / Actual for an LTB one. Coming in under a mortar-waste or DSO target is a good result and is scored as one.
Is the sample data real company data?
No. It is a generated but internally consistent sample year, included so you can see every formula working before you overwrite it.
How does this differ from the Masonry Contractor KPI Scorecard?
The scorecard is the shorter 10-KPI format. This dashboard is the fuller build: 14 KPIs, seven summary cards, a dedicated KPI Trend page and a KPI Analysis page with group roll-up and Top 5 / Bottom 5 ranking.
Can several people work in it at once?
Yes – store it on OneDrive or SharePoint and co-author it like any other workbook. There is no licence server and no seat count.
About the Author
Built by PK – Microsoft Certified Professional with 15+ years of Excel, Google Sheets, and Power BI experience. Founder of NextGenTemplates, reaching 300K+ subscribers across YouTube channels. Every template is hand-built and tested before release.
Conclusion
A masonry business does not usually fail for want of numbers – it fails for want of one page that puts them next to each other and says whether the month was good. The Masonry Contractor KPI Dashboard in Excel is that page: 14 KPIs, seven groups, MTD and YTD, direction-aware scoring and a trend and analysis page behind it, all from a single month dropdown and nothing but worksheet formulas.
Get the Masonry Contractor KPI Dashboard in Excel – $12.99, down from $19.99. Instant download, lifetime access, fully editable, no subscription.
For step-by-step Excel tutorials and dashboard walkthroughs, subscribe to youtube.com/@PKAnExcelExpert.