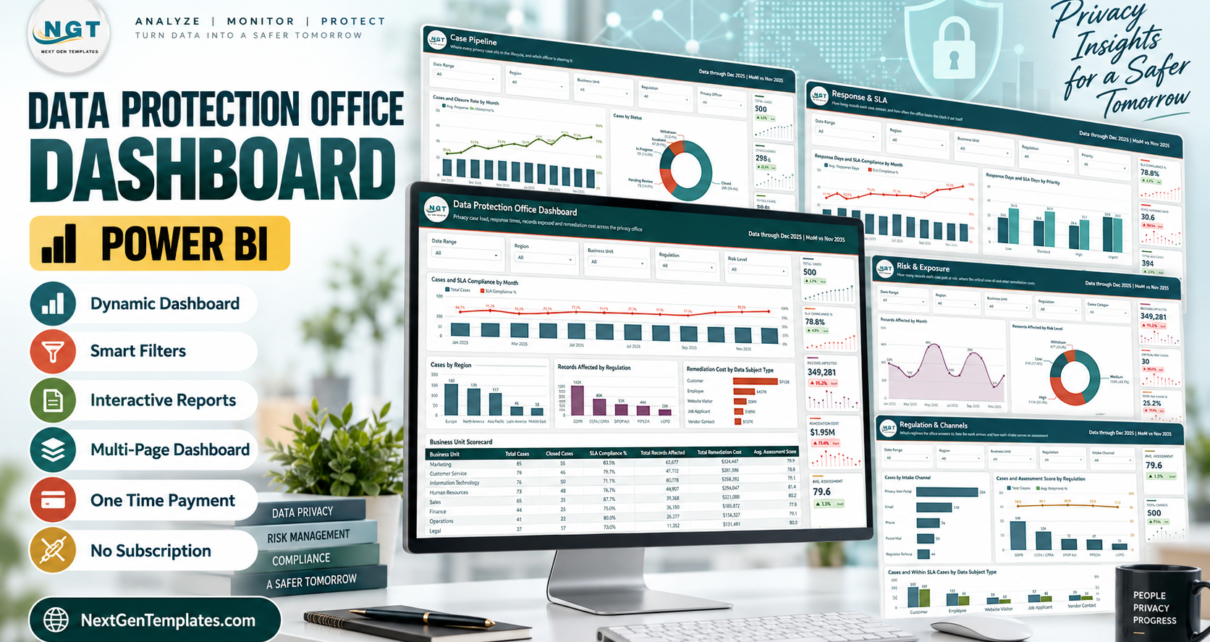
Most privacy offices can tell you how many cases they closed last month. Far fewer can tell you which business unit is quietly missing its clock, how much of their total record exposure sits in a handful of incidents, or what a case actually costs to remediate. The Data Protection Office Dashboard in Power BI is built to answer those three questions from a single case log.
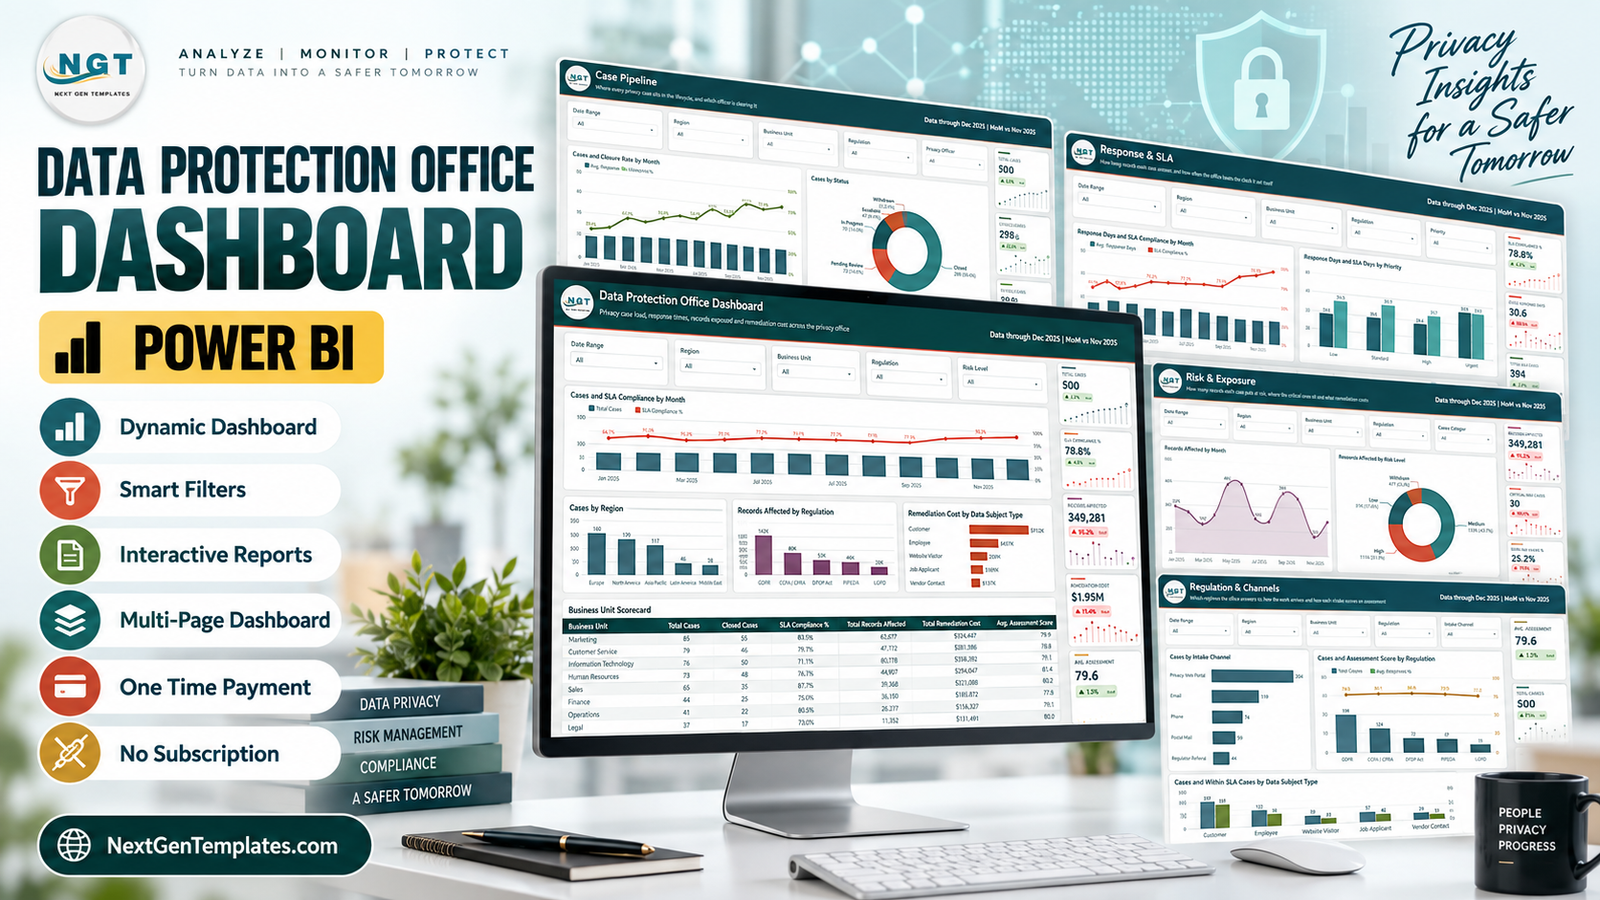
The shipped sample model carries 500 privacy cases logged between 1 January and 31 December 2025, spread across 8 business units, 5 regions, 8 case categories and 5 regulations. Out of the box it reports 78.8% SLA compliance (394 cases inside the clock, 106 overdue), 349,281 records affected, $1.95M in remediation cost and an average assessment score of 79.6. Every one of those figures is computed by a DAX measure over the sample table, so the moment you swap in your own export they change.
One thing to be clear about before anything else. This is an analytical report, not a compliance system. It does not intake DSARs, does not hold your Article 30 records, does not manage consent, does not discover personal data across your estate, does not file breach notifications, and does not certify or evidence compliance with GDPR, CCPA/CPRA, the DPDP Act, PIPEDA, LGPD or anything else. It is legal advice from nobody. It reads a case log that you maintain somewhere else and turns it into a picture.
Key Features of the Data Protection Office Dashboard in Power BI
- Nine pages, five of them for analysis. Overview, Case Pipeline, Response & SLA, Risk & Exposure and Regulation & Channels, plus a hidden Details page, two hover tooltip pages and a catalogue page you can delete.
- A ten-field drillthrough. The Details page is bound to Business Unit, Region, Case Category, Data Subject Type, Regulation, Intake Channel, Risk Level, Priority, Privacy Officer and Status – ten right-click routes into the raw cases, not one.
- Thirty named DAX measures behind the visuals, including SLA Compliance %, Closure Rate %, Avg. Response Days, Within SLA Cases, Overdue Cases, Critical Risk Cases, High Risk Share %, Total Records Affected and Total Remediation Cost.
- Synced slicers. Date Range, Region, Business Unit and Regulation are grouped across pages, so a filter set on Overview is still set when you land on Risk & Exposure. Each page then adds a fifth slicer of its own.
- Month-on-month deltas on every card, each with a small trend spark beneath it.
- Two scorecards – one by business unit, one by privacy officer – that most privacy dashboards skip entirely.
- A sample dataset with no personal data in it, which turns out to matter more than it sounds. More on that below.
Dashboard Pages Explanation
Page 1 – Overview
The landing page. Five KPI cards down the right rail (Total Cases 500, SLA Compliance 78.8%, Records Affected 349,281, Remediation Cost $1.95M, Avg. Assessment 79.6), a combo chart pairing monthly case volume against the SLA compliance line, and three supporting visuals: Cases by Region (Europe 160, North America 139, Asia Pacific 117, Latin America 46, Middle East 38), Records Affected by Regulation, and Remediation Cost by Data Subject Type. Beneath them sits the Business Unit Scorecard – eight rows carrying cases, closed cases, SLA %, records affected, remediation cost and assessment score. The compliance line is the thing to watch: it starts the year at 64.7% and finishes at 93.3%.
Page 2 – Case Pipeline
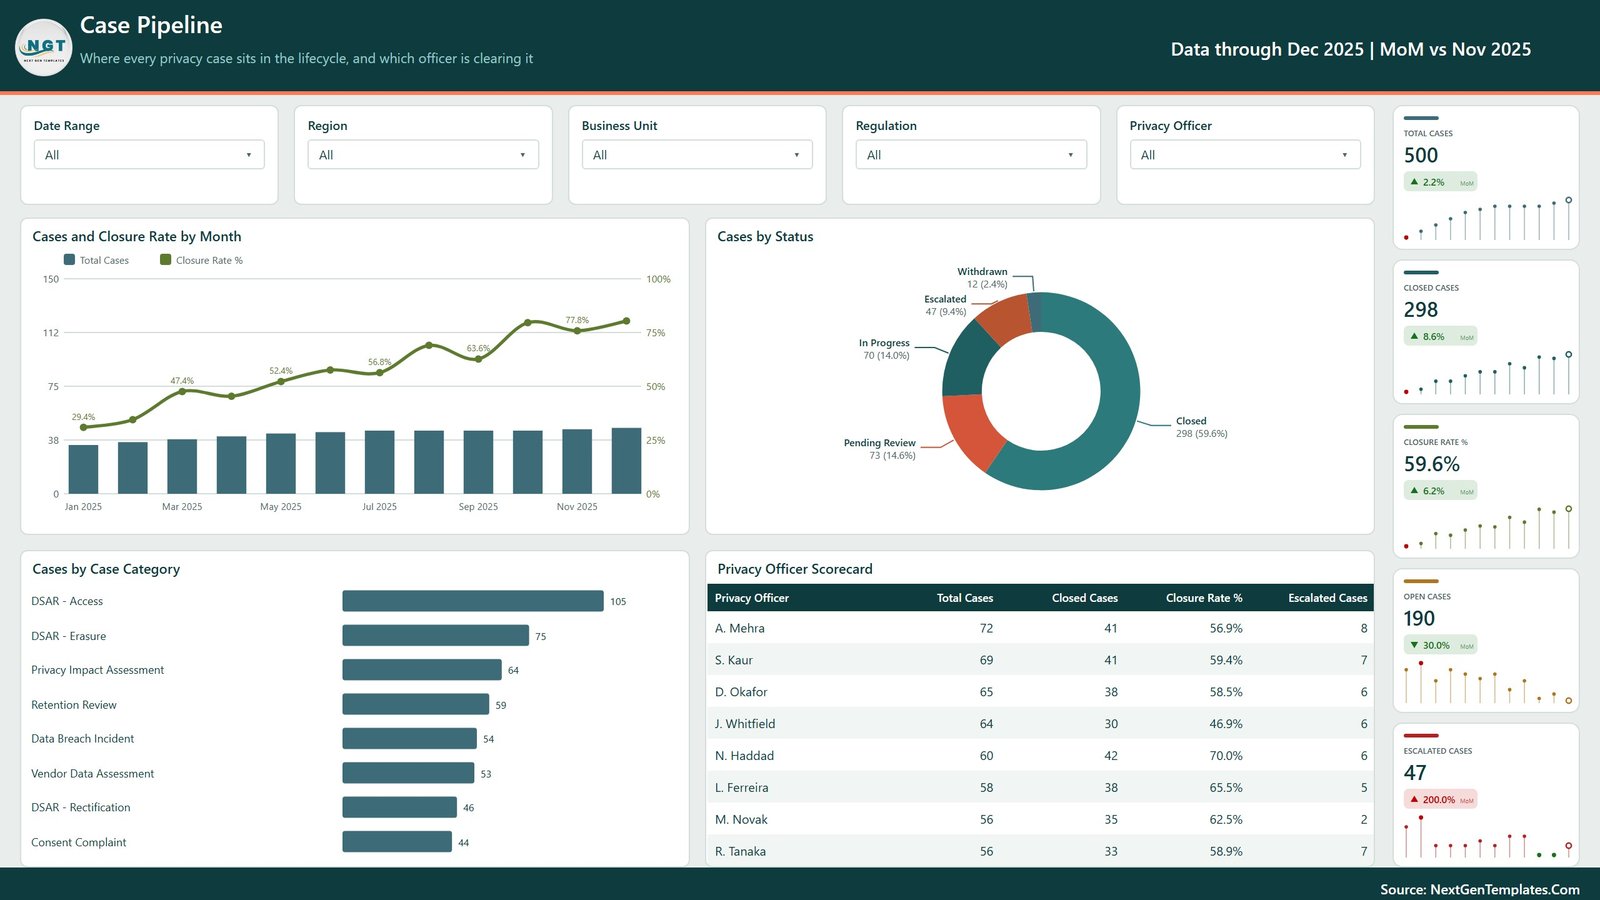
Where each case sits, and who is clearing it. A status donut splits the 500 into Closed 298, Pending Review 73, In Progress 70, Escalated 47 and Withdrawn 12. A monthly closure-rate line climbs from 29.4% to 77.8%. Cases by Case Category ranks the eight workstreams, with DSAR – Access the largest at 105. The Privacy Officer Scorecard closes the page: eight officers, closure rates from 46.9% to 70.0%, escalations alongside.
Page 3 – Response & SLA
How long cases take and how often the office beats the clock it set itself. Avg. Response Days is 30.6 against an Avg. SLA Days of 38.6. Response Days by Case Category is the useful visual here: Privacy Impact Assessment averages 46.5 days and Retention Review 46.4, while Data Breach Incident sits at 3.1 – because breaches ship with a 3-day SLA and the office treats them accordingly. The Regional SLA Scorecard shows Asia Pacific as the weak point at 72.6% against 81.6% for the Middle East.
Page 4 – Risk & Exposure
Volume is not risk. This page separates them. Records Affected by Risk Level splits the 349,281 into Medium 153K, High 111K, Low 61K and Critical 24K. A scatter plots records affected against remediation cost by business unit, with Information Technology out at the top right. The Case Category Exposure table is the punchline: 54 Data Breach Incidents – just under 11% of cases – carry 141,210 affected records, more than 40% of the total.
Page 5 – Regulation & Channels
Which regimes the office answers to and how the work arrives. GDPR leads at 198 cases, then CCPA/CPRA 124, DPDP Act 72, PIPEDA 67 and LGPD 39. The Privacy Web Portal brings in 204 of the 500 cases against 119 by email and 44 by regulator referral. A grouped column compares total cases with within-SLA cases by data subject type – Customer 232 of which 185 landed in time.
Data Protection Office Dashboard in Power BI vs. Tableau vs. Paid Privacy SaaS – Feature Comparison
| This template (Power BI) | Tableau or Qlik build | Paid privacy SaaS | |
|---|---|---|---|
| Cost | $17.99 once | Tableau Creator from ~$75/user/month | Commonly five figures a year |
| Platform | Power BI Desktop (free) | Tableau Desktop / Qlik Sense | Vendor-hosted web app |
| Setup time | Re-point Power Query and refresh | Build from scratch | Weeks of implementation |
| Real-time collaboration | Only via a Power BI workspace | Only via Tableau Server / Cloud | Yes, built in |
| Mobile access | Power BI mobile app after publishing | Vendor app after publishing | Yes |
| Customisable fields | Fully – it is your model | Fully | Within the vendor schema |
| Share with a link | After publishing | After publishing | Yes |
| Year-1 cost at 5 users | $17.99 | ~$4,500 | $20,000+ |
| DSAR intake and workflow | No | No | Yes |
| Article 30 register / RoPA | No | No | Yes |
Who Should Use This Template
A DPO or privacy lead who already keeps a case log and needs a defensible monthly view of load, timeliness, exposure and cost. A compliance analyst who has to answer targeted questions in a meeting rather than after it. A BI developer asked to build privacy reporting who would rather adapt a working model than start from an empty canvas. A consultant who wants a client-ready starting point they can rebrand.
It is the wrong tool if you were hoping the file would run the programme – receive requests, hold records of processing, capture consent, scan systems for personal data or notify regulators. It is also the wrong tool if you have no case history to load, because it reports the past rather than creating it.
Real-World Use Cases
The board pack. Amara, DPO at a 900-person SaaS business, is asked every quarter whether the office is answering in time. Response & SLA gives her 78.8% against a 38.6-day average clock, and the Regional SLA Scorecard names Asia Pacific at 72.6%. Her ask changes from “we need headcount” to “we need one region resourced”.
The incident review. Daniel, a compliance analyst in retail banking, needs exposure rather than volume. Risk & Exposure shows 54 breach incidents holding 141,210 of 349,281 affected records. He right-clicks the bar, drills through to Details on Case Category, and exports the underlying case list.
The one-to-one. Priya runs privacy operations and uses the Privacy Officer Scorecard as a coaching input – closure rates spread from 46.9% to 70.0%, with escalation counts beside them – rather than as a league table.
Advantages of the Data Protection Office Dashboard in Power BI
- Exposure is separated from volume. Very few privacy dashboards make the point that a small number of breach cases can carry most of the affected records. This one puts it on a page.
- The drillthrough is real. Ten bound fields means almost any visual you right-click gives you a route to the case list, which is what people actually ask for in a review.
- Cost is a first-class metric. Remediation cost sits beside case counts in the scorecards, so the business unit conversation has a number in it.
- Nothing is locked. Colours, logo, page names, measure names, the category lists and the data source are all yours to change.
- No recurring fee. Power BI Desktop is free, and the template is a single payment.
Opportunities for Improvement
Being honest about the gaps is more useful than pretending there are none.
- The model is one flat table. Eighteen columns, no date dimension, no lookup tables. That keeps it easy to re-point but limits time intelligence – there is no built-in year-over-year or rolling-12 measure.
- Regulation is a label, not logic. The five regimes are text values used for slicing. No statutory deadline, lawful-basis test or jurisdiction rule is encoded anywhere in the model, and you should not read the page as saying otherwise.
- SLA Days is a number you supply. The dashboard compares Response Days to SLA Days; it does not know what your regulatory deadline actually is.
- The shipped Power Query source may point at the build machine. The model is compressed, so this could not be verified from the file – if your first Refresh fails, Change Source is the fix and it takes about thirty seconds.
- No row-level security. Anyone who opens the file sees every case. If you publish a version carrying real data, configure RLS in the workspace.
Best Practices
- Open the file in Power BI Desktop and read the included user manual PDF before you change anything.
- Look at
Data.xlsxfirst so you can see the exact 18 column names the visuals bind to, then shape your export to match. Renaming a column silently blanks a card. - Keep the category columns to a controlled vocabulary. Two spellings of one business unit become two rows in the scorecard.
- Re-point the query via Transform data > Data source settings > Change Source and refresh. Microsoft’s own Power BI data sources documentation covers the alternatives if you move to SQL or SharePoint.
- Keep the sample’s privacy discipline. The shipped rows contain no names, emails, phone numbers, addresses, dates of birth, identifiers or free-text notes – a case is described by category, region, risk and numbers. Load your own data the same way: use case references, not data-subject names. It keeps the reporting file out of scope for most of what would otherwise apply to it.
- Delete the Get More Dashboards page and set your own theme before you circulate anything.
- If you publish, set workspace permissions and row-level security before you share the link, and give the file a retention date like any other record.
Explore Relevant Templates
- Data Protection Office Dashboard in Excel – the same subject built as a workbook, for teams without Power BI.
- Cyber Risk Management Dashboard in Power BI – risk register, severity mix and mitigation rates.
- Digital Compliance Tools Dashboard in Power BI – adoption and coverage of compliance tooling.
- Cybersecurity Startups Dashboard in Power BI – market and portfolio analytics for the security sector.
- Risk Assessment Firms Dashboard in Power BI – engagement volumes, findings and turnaround.
Frequently Asked Questions
Will this dashboard make my organisation GDPR compliant?
No. It reports on privacy cases you already log elsewhere. Compliance rests on your policies, records, lawful bases and controls, none of which live in a .pbix file. Use it as a management report, not as evidence.
Is it a DSAR intake or case-management system?
No. There is no form, no queue, no routing and no workflow. Cases appear in the model because you exported them from the system where you actually handle them.
Does the sample data contain anyone’s personal data?
No. All 500 rows are case attributes and numbers. There are no data-subject names, emails, phone numbers, addresses, dates of birth, national identifiers or case notes. “Data Subject Type” is a five-value category label, and the eight privacy officers are fictional initial-and-surname strings. Once you load real cases that changes, so store and share the file accordingly.
Which regulations does it cover?
The Regulation column carries GDPR, CCPA/CPRA, DPDP Act, PIPEDA and LGPD purely as grouping labels. No regulatory logic, deadline or test is encoded. Edit the list to whatever regimes you answer to.
Do I need a paid Power BI licence?
Not to use it. Power BI Desktop is free. Pro or PPU is only needed to publish and share in a workspace.
Can I connect it to something other than Excel?
Yes. Swap the Excel query for SQL Server, SharePoint, Dataverse or any other Power Query source, provided the output columns keep their names.
What exactly is in the download?
A ZIP with three files: the .pbix report, the 500-row Data.xlsx sample, and a Power BI user manual PDF.
About the Author
Built by PK – Microsoft Certified Professional with 15+ years of Excel, Google Sheets, and Power BI experience. Founder of NextGenTemplates, reaching 300K+ subscribers across YouTube channels. Every template is hand-built and tested before release.
Conclusion
The Data Protection Office Dashboard in Power BI does one job well: it takes a privacy case log and makes case load, response times, record exposure and remediation cost legible in five pages, with a ten-field drillthrough underneath so nobody has to take the summary on trust. It will not run your privacy programme, and it does not pretend to – the copy above is deliberate about that. But if the programme already runs and the reporting is the weak link, this closes the gap for a single payment.
Get it here: Data Protection Office Dashboard in Power BI – $17.99, reduced from $29.99, instant download.
For step-by-step Power BI and Excel tutorials, subscribe at youtube.com/@PKAnExcelExpert.