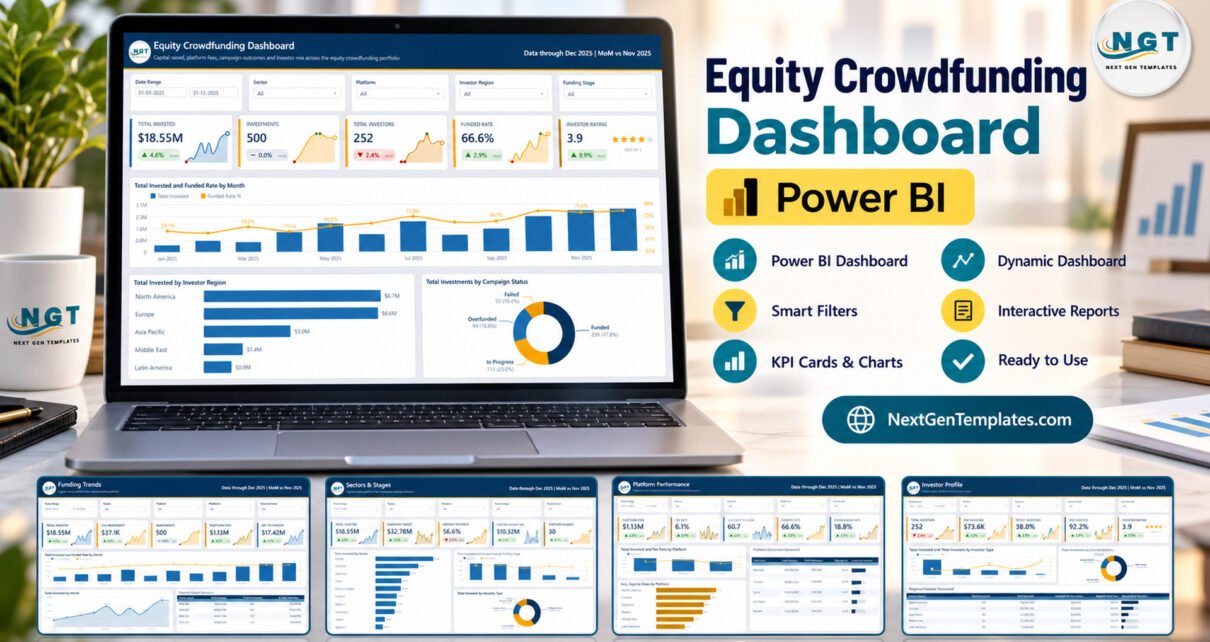
The Equity Crowdfunding Dashboard in Power BI is a nine-page .pbix report built around five interactive analysis pages, one information page, two 280×360 tooltip pages and a hidden drillthrough page wired to nine fields. It ships with a 24-column, 500-row demo workbook plus a separate Date table, and the report visuals reference 32 named measures. Twenty-five KPI tiles spread across the five analysis pages, each carrying a month-on-month delta and a sparkline.
Teams running a raise usually end up rebuilding the same numbers by hand every few weeks — how much has come in, which platform is taking the largest fee, how long campaigns take to close, and whether repeat investors are actually coming back. This template gives you one place to see all of that, provided you bring your own data.
Before you read further: this is an internal reporting template, nothing more. It does not give investment, financial, legal or tax advice, it is not a solicitation or offer of any security, and it does not assess or ensure compliance with Regulation Crowdfunding (Reg CF), Regulation A+, Regulation D, the JOBS Act, SEC or FINRA rules, the FCA, ESMA/ECSPR or any other securities regime. It performs no due diligence, valuation, suitability assessment, investor accreditation, AML/KYC or funding-portal record-keeping, and it produces no audited, assured or filing-ready figures. Every valuation, raise amount, investor count, dilution and return figure in the shipped file is buyer-entered demo data. If you want the official ground rules for a US raise, read them at the SEC investor education site, not here.
Key Features of the Equity Crowdfunding Dashboard in Power BI
- Five analysis pages sharing one layout. Overview, Funding Trends, Sectors and Stages, Platform Performance and Investor Profile each place five filter controls across the top, five KPI tiles beneath them, and two to three charts below that.
- Twenty-five KPI tiles. Total Invested, Investments, Total Investors, Funded Rate, Investor Rating, Avg. Investment, Platform Fees, Net to Startups, Campaign Target, Funding Progress, Avg. Pre-Money Valuation, Startups Funded, Fee Rate, Avg. Days to Close, Overfunded Rate, Per Investor, Repeat Investors and KYC Verified.
- Thirty-two measures referenced by the visuals, including Funded Rate %, Fee Rate %, Avg. Days To Close, Repeat Investor Rate % and Invested Per Investor. All are named and editable.
- Synced slicers plus a page-specific filter. Date Range, Sector, Platform and Investor Region appear on every analysis page; the fifth slot changes to Funding Stage, Campaign Status, Security Type, Investment Channel or Investor Age Group depending on the page.
- Hidden detail pages already wired. Two tooltip pages plus a drillthrough page bound on Startup Name, Sector, Funding Stage, Platform, Security Type, Investor Type, Investor Region, Investment Channel and Campaign Status.
- No licensed custom visuals. Clustered bar, line-and-clustered-column combo, donut, area, card, table and slicer only, so everything opens and edits in Power BI Desktop.
Dashboard Pages Explanation
Page 1: Overview
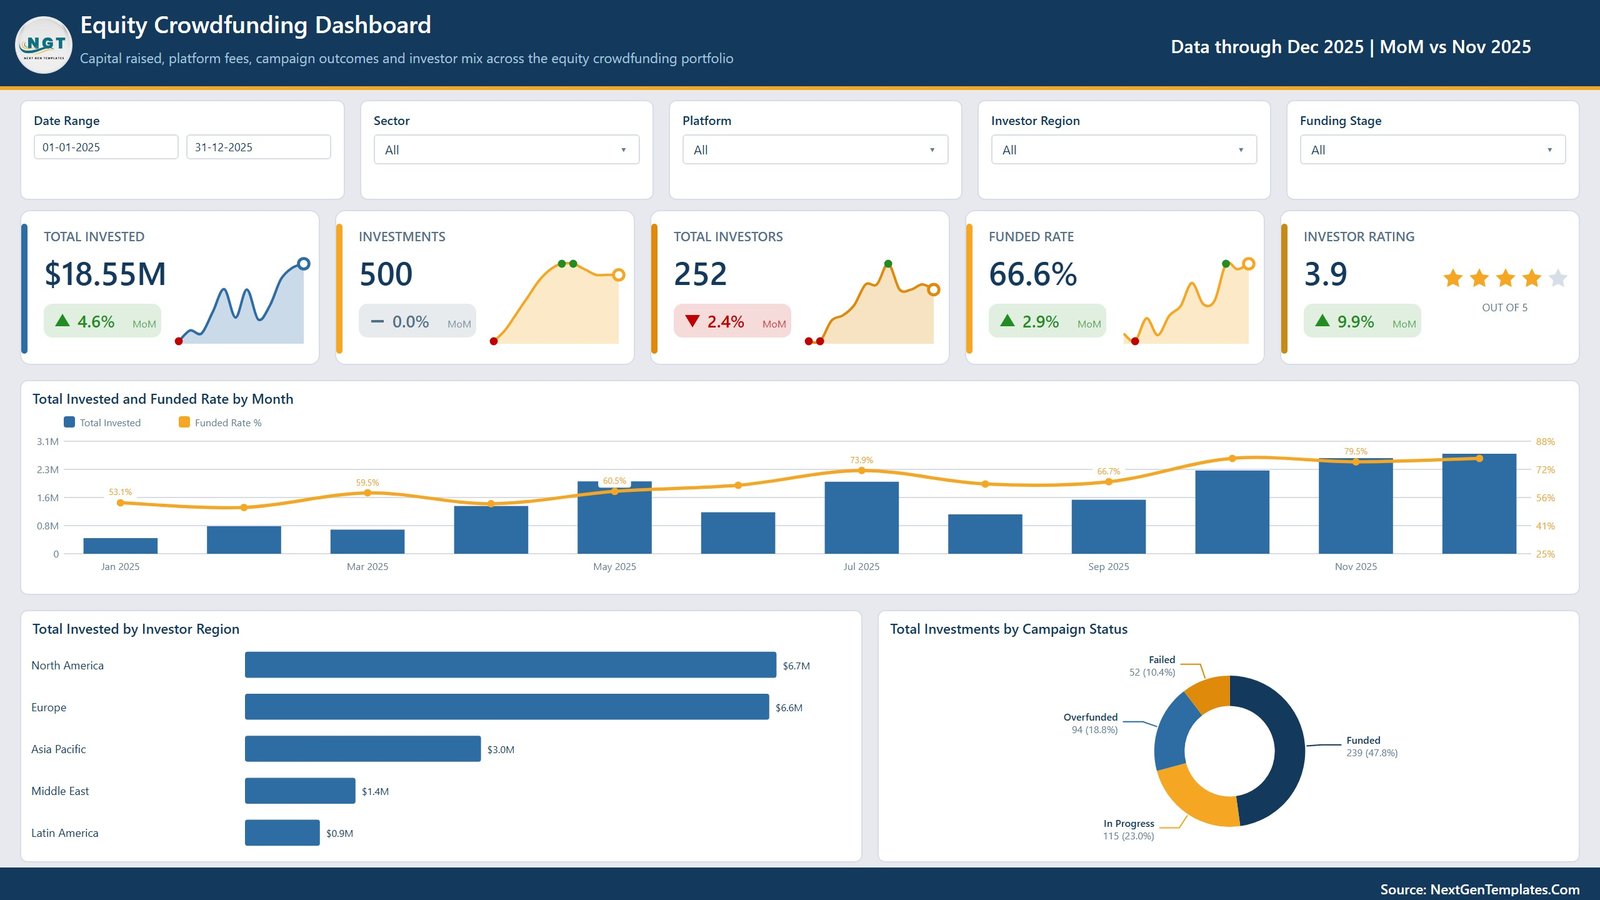
The entry point. Total Invested, Investments, Total Investors, Funded Rate and Investor Rating sit above three charts: Total Invested and Funded Rate by Month, Total Invested by Investor Region, and Total Investments by Campaign Status. Filters are Date Range, Sector, Platform, Investor Region and Funding Stage.
Page 2: Funding Trends
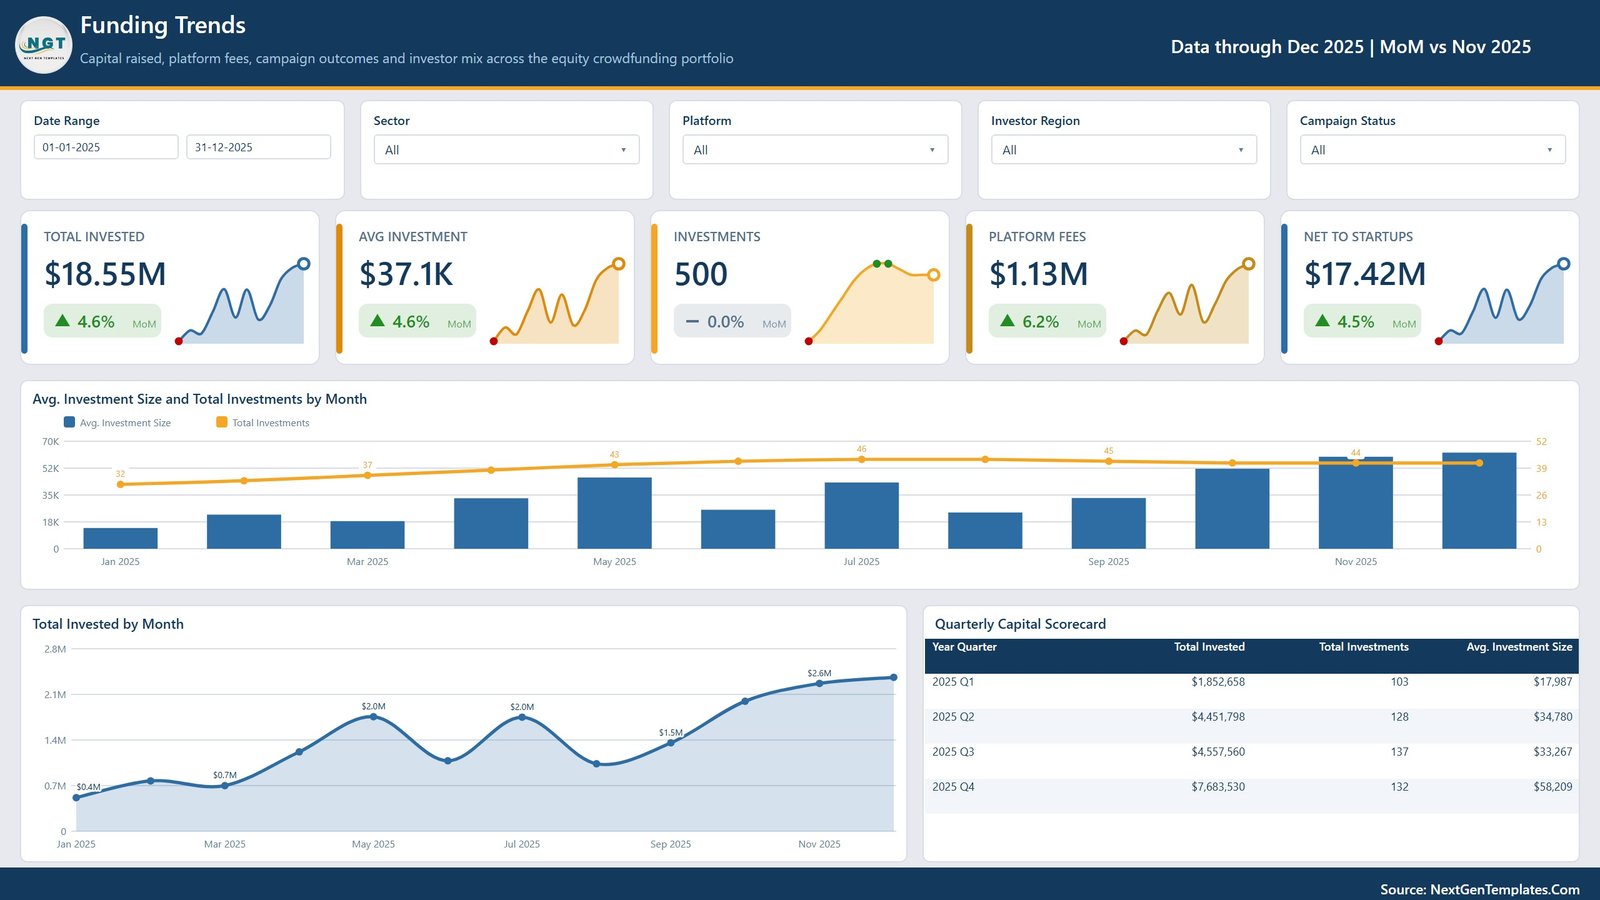
Swaps the KPI row for Total Invested, Avg. Investment, Investments, Platform Fees and Net to Startups. Charts are Avg. Investment Size and Total Investments by Month and Total Invested by Month, alongside a Quarterly Capital Scorecard table listing Total Invested, Total Investments and Avg. Investment Size per quarter.
Page 3: Sectors and Stages
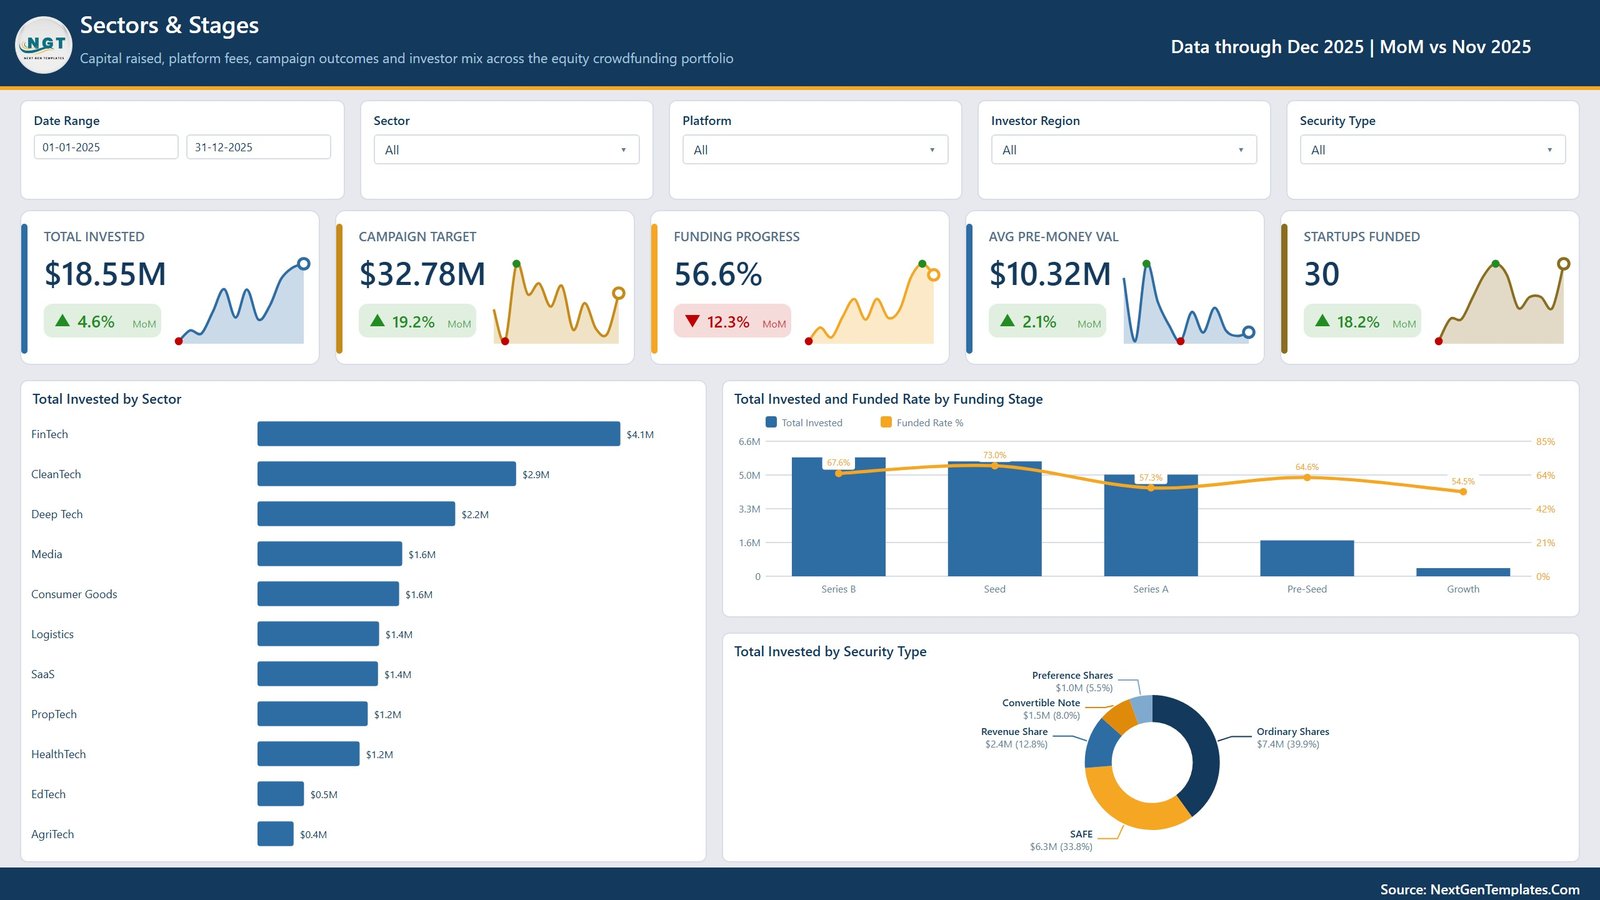
Adds Campaign Target, Funding Progress, Avg. Pre-Money Valuation and Startups Funded. Total Invested by Sector spans eleven sectors, Total Invested and Funded Rate by Funding Stage covers five stages, and Total Invested by Security Type splits capital across Ordinary Shares, SAFE, Revenue Share, Convertible Note and Preference Shares.
Page 4: Platform Performance
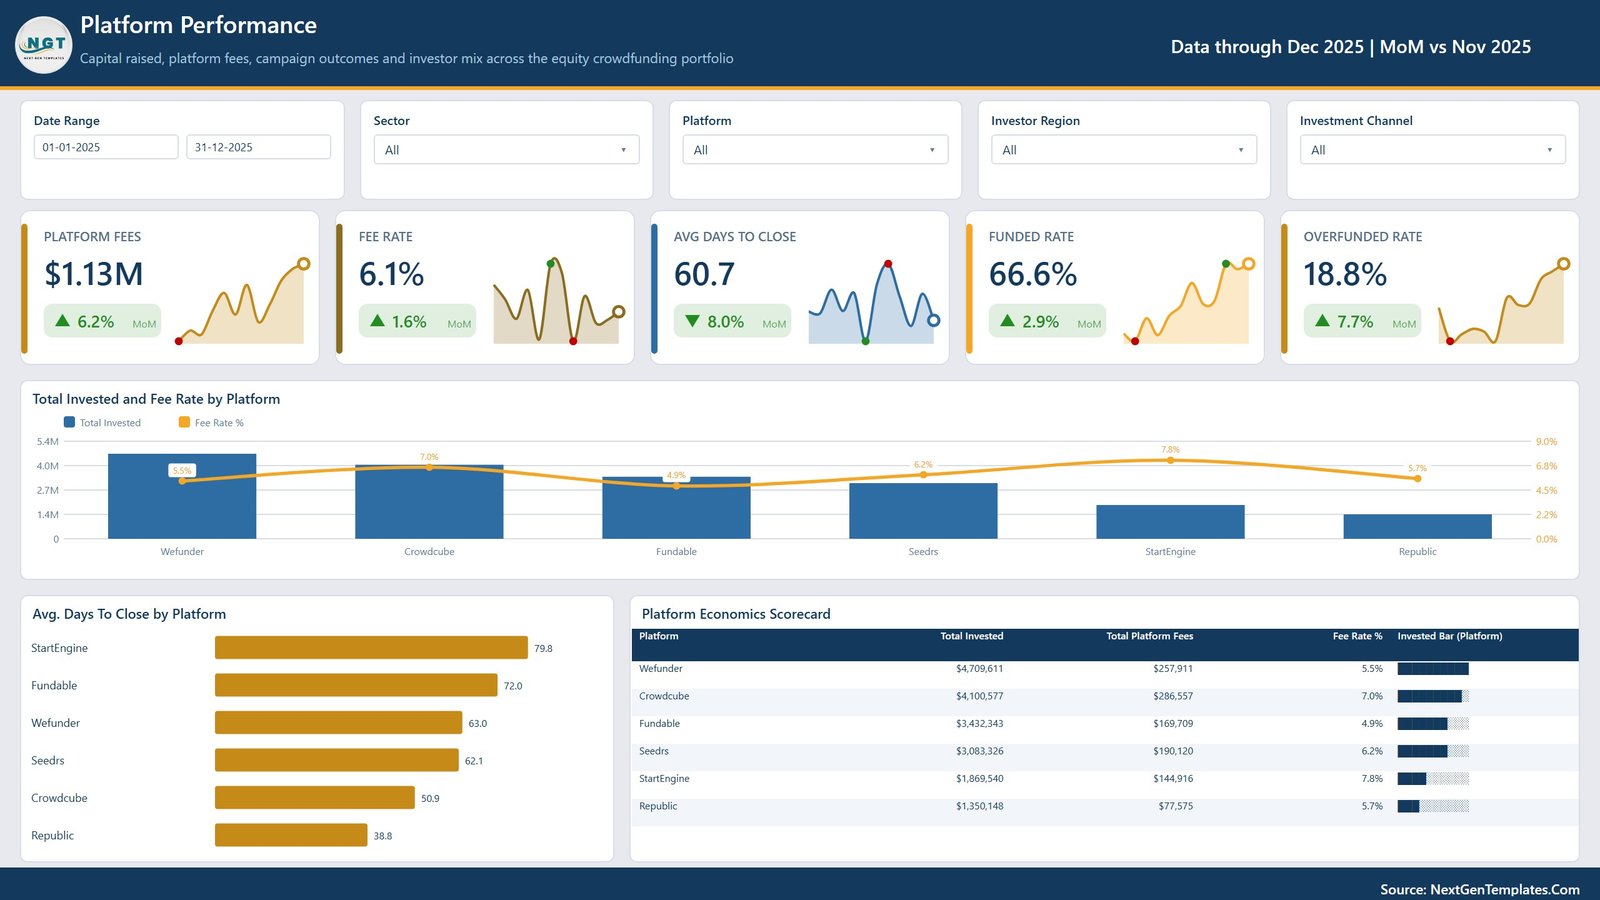
Focuses on economics: Platform Fees, Fee Rate, Avg. Days to Close, Funded Rate and Overfunded Rate. Total Invested and Fee Rate by Platform and Avg. Days to Close by Platform sit beside a Platform Economics Scorecard listing Total Invested, Total Platform Fees and Fee Rate for every platform in your data.
Page 5: Investor Profile
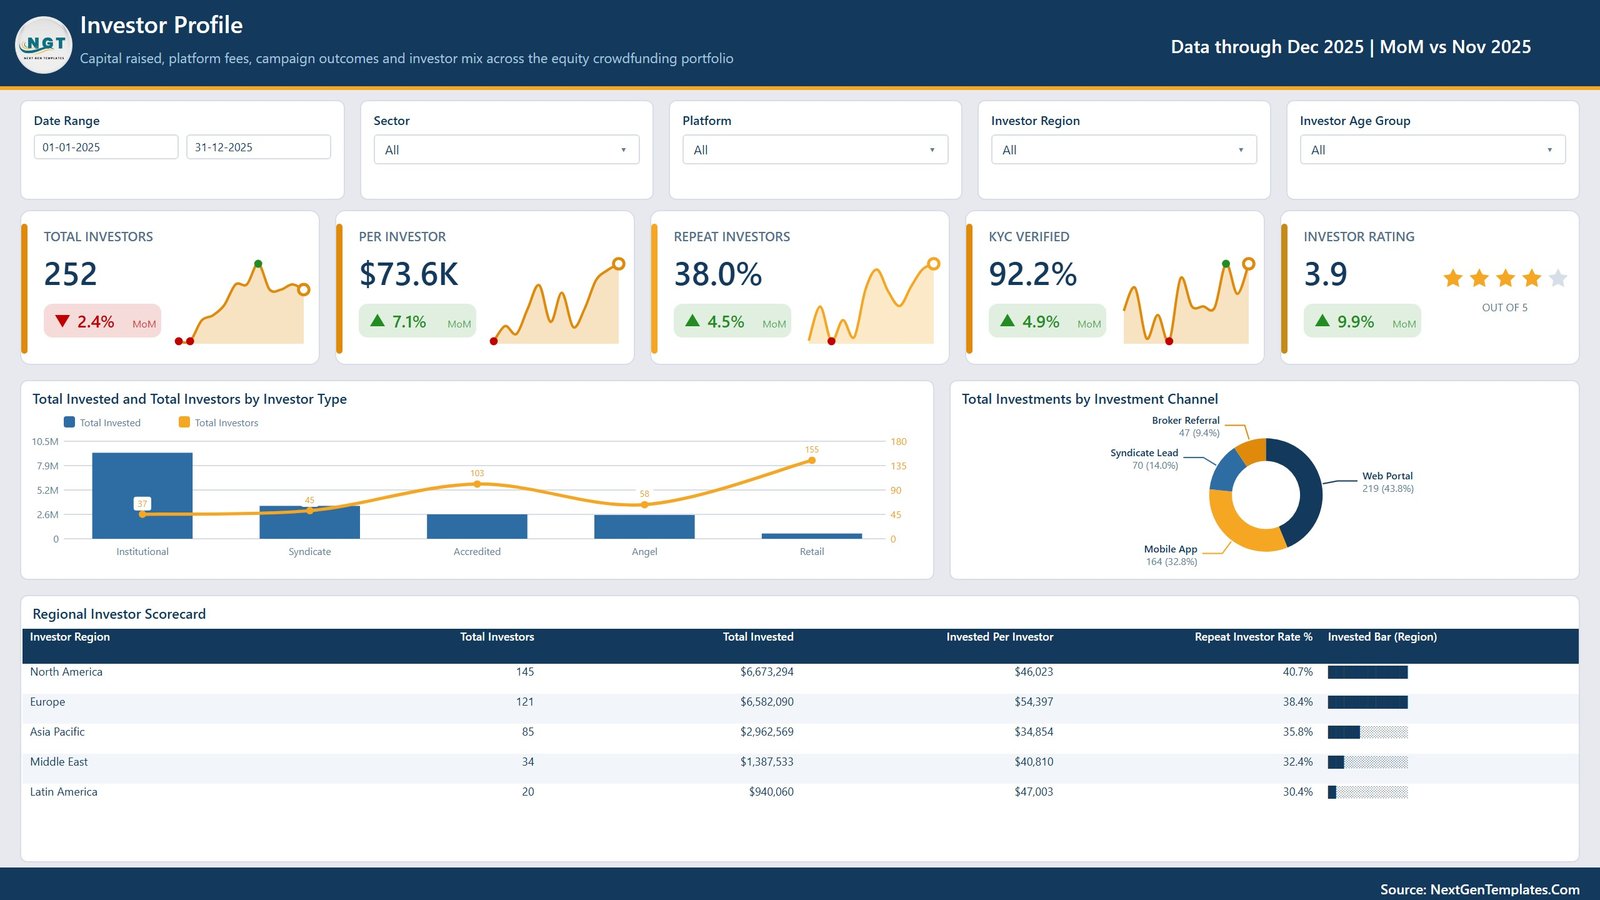
Total Investors, Per Investor, Repeat Investors, KYC Verified and Investor Rating sit above Total Invested and Total Investors by Investor Type and Total Investments by Investment Channel. A Regional Investor Scorecard breaks out investors, capital, invested per investor and repeat rate by region.
A note on the demo values
The sample rows name platforms such as Wefunder, Crowdcube, Fundable, Seedrs, StartEngine and Republic. These are placeholder strings only. No data, partnership, affiliation or endorsement is implied by any of them, and the figures attached to them were generated to fill the template. Replace every one of those names before you show the report to anybody.
Equity Crowdfunding Dashboard in Power BI vs. Tableau / Qlik vs. Paid Cap-Table SaaS
| Feature | This Template | Tableau / Qlik build | Carta / Ledgy / AngelList tooling |
|---|---|---|---|
| Cost | $29.99 one-time | $75+ per user per month plus build cost | $300–$3,000+ per year |
| Platform | Power BI Desktop (free) | Paid licence per creator | Vendor-hosted only |
| Setup time | ✅ Under 10 minutes | Days to weeks of development | Onboarding plus data migration |
| Your data stays local | ✅ Yes — nothing is uploaded | Depends on the server | Hosted by the vendor |
| Editable measures and visuals | ✅ All 32 measures editable | ✅ Yes, with developer time | Fixed vendor reports |
| Drillthrough and tooltip pages | ✅ Pre-wired on 9 fields | Build it yourself | Limited |
| Securities compliance features | ❌ None — reporting only | ❌ None | ✅ Cap table and filing support |
| Year-1 cost at 5 users | $29.99 | $4,500+ | $1,500–$15,000 |
For teams that want a fast internal read on raise performance without a BI licence, this template sits in the sweet spot — but if you need a real cap table or regulatory filings, buy dedicated software instead.
Who Should Use This Template
Perfect for:
- Founders and finance leads who want an internal view of raise pipeline, fees and investor mix.
- Syndicate and angel-group organisers reporting activity back to their own members.
- Analysts and consultants who already hold the underlying records in Excel or CSV.
- Anyone learning Power BI who wants a finished multi-page report to pull apart.
Not a fit if:
- You are looking for investment advice, a valuation, a recommendation or a return projection. The file provides none of these.
- You are a registered funding portal or broker-dealer needing regulatory record-keeping, accreditation checks or AML/KYC workflows.
- You need audited or filing-ready numbers, or a genuine cap table with share classes and option pools.
- You do not have Power BI Desktop, or you have no data of your own to load.
Real-World Use Cases
Maya, finance lead at a seed-stage hardware startup. She loads her own raise records and uses Funding Trends to show the board how monthly commitments and average cheque size moved through the year, replacing a deck she used to rebuild by hand each quarter.
Daniel, organiser of a 60-member angel syndicate. He reads Investor Profile to see how capital splits across investor types and channels, then uses the Regional Investor Scorecard to find the regions with the highest repeat rate before planning his next outreach push.
Priya, consultant to three early-stage companies. She keeps one copy per client, repoints the Power Query path, and delivers a consistent five-page read on fees, days-to-close and funded rate without rebuilding a report each time.
Advantages of This Template
The obvious saving is cost: a one-time $29.99 against $4,500 or more for a year of Tableau seats at five users, or $1,500 to $15,000 for hosted cap-table tooling. The less obvious saving is time. Because the drillthrough and tooltip pages are already bound on nine fields, you get click-through detail on day one instead of building it yourself.
Data locality matters too. Nothing leaves your machine — the report reads a local workbook through Power Query, so sensitive raise data never touches a vendor server. And since every visual is a standard Power BI chart, your team can extend the model without buying a custom-visual licence or waiting on a developer.
Opportunities for Improvement
Being honest about the limits: the model is built around a single flat fact table, so if your data lives across several related tables you will need to shape it into that 24-column layout first. There is no cap-table logic — no share classes, no option pool, no dilution waterfall — and the file will not compute those for you.
The “KYC Verified” tile counts a flag column you populate; it performs no identity verification of any kind, and naming it that way could mislead a reader who has not been told. If you circulate this report, say plainly that the flag is self-reported. Finally, the shipped .pbix carries an information page titled “Get More Dashboards” that markets other templates — delete that page before sharing the file internally.
On the export quality itself, all five analysis pages render cleanly: no clipped scorecard rows, no stray selection outlines on the title boxes and no overlapping data labels. The only cosmetic wrinkle is that on three pages the first data label of the line series draws with a solid background chip while the rest are transparent.
Best Practices
- Keep a pristine copy of the original .pbix before you start editing, so you can always diff against it.
- Overwrite every demo platform, sector and startup name in one pass rather than piecemeal — leftovers are the most common embarrassment.
- Rename “KYC Verified” to something like “KYC Flag (self-reported)” if the report leaves your team.
- Reconcile the totals against your source system before every circulation. A dashboard is a view, not a ledger.
- Use the drillthrough page during review meetings instead of exporting extra slides — it answers most follow-up questions on the spot.
Explore Relevant Templates
If this topic is in your wheelhouse, these related walkthroughs cover neighbouring ground: the Crowdsourced Investment Platforms Dashboard in Power BI looks at platform-level flow, the Real Estate Crowdfunding Dashboard in Power BI applies the same structure to property raises, and the VC Portfolio Dashboard in Excel picks up after the round closes. For angel-group reporting see the Angel Investors KPI Dashboard in Excel, and for adjacent fintech reporting the DeFi Dashboard in Power BI and the Climate Tech Startups Dashboard in Power BI are both worth a look.
An Excel edition of this same topic is currently being prepared and will be linked here once it is live.
Frequently Asked Questions
Does this give investment advice or make our raise compliant?
No — to both. The Equity Crowdfunding Dashboard in Power BI is an internal reporting template over data you supply. It gives no investment, financial, legal or tax advice, is not a solicitation or offer of any security, and does nothing to assess or ensure compliance with Reg CF, Reg A+, Reg D, the JOBS Act, SEC, FINRA, FCA or ESMA/ECSPR rules.
Are the figures in the screenshots real?
No. The $18.55M raised, 500 investments, 252 investors and 66.6% funded rate are all demo data generated to populate the template. The platform names are placeholders. Nothing in the file is research, a benchmark or a projection about any real company, platform or raise.
How long does setup take?
Under ten minutes for most people. Open the .pbix in Power BI Desktop, paste your rows into the 24-column layout shown in the included Data.xlsx, repoint one Power Query file path and refresh. All five analysis pages, both tooltip pages and the drillthrough page update together.
How does this compare to Carta or AngelList tooling?
Different jobs. Those products maintain a real cap table and support regulatory filings; this template does neither. What it offers instead is a $29.99 one-time internal reporting layer over data you already hold, with every measure and visual editable rather than fixed by a vendor.
How many measures are in the model?
The report visuals reference 32 named measures. The semantic model may hold further helper measures that are not placed on any visual, so 32 is the count you can verify from the report rather than a claim about the whole model.
What is in the download?
One ZIP containing the .pbix report, the Data.xlsx demo workbook and a Power BI user manual PDF. There is no topic-specific manual on this line — the generic Power BI guide covers the same setup steps for every report in the range.
Can I use it for client work?
Yes. The commercial licence lets consultants and agencies rebrand the report and use it inside client engagements. You may not resell or redistribute the template itself as a template.
About the Author
Built by PK — Microsoft Certified Professional with 15+ years of Excel, Google Sheets and Power BI experience. Founder of NextGenTemplates, reaching 300K+ subscribers across YouTube channels. Every template is hand-built and tested before release.
Conclusion
If you are running or advising on a raise and you already keep the records, this report turns them into a five-page read on capital, fees, stages, platforms and investors in about ten minutes of setup. Just remember what it is: a reporting layer over your own numbers, with no advice, no compliance function and no audited output.
👉 Click here to purchase the Equity Crowdfunding Dashboard in Power BI
Instant download · One-time payment · No subscription
For step-by-step video tutorials, visit YouTube.com/@PKAnExcelExpert.
Last updated: September 2026