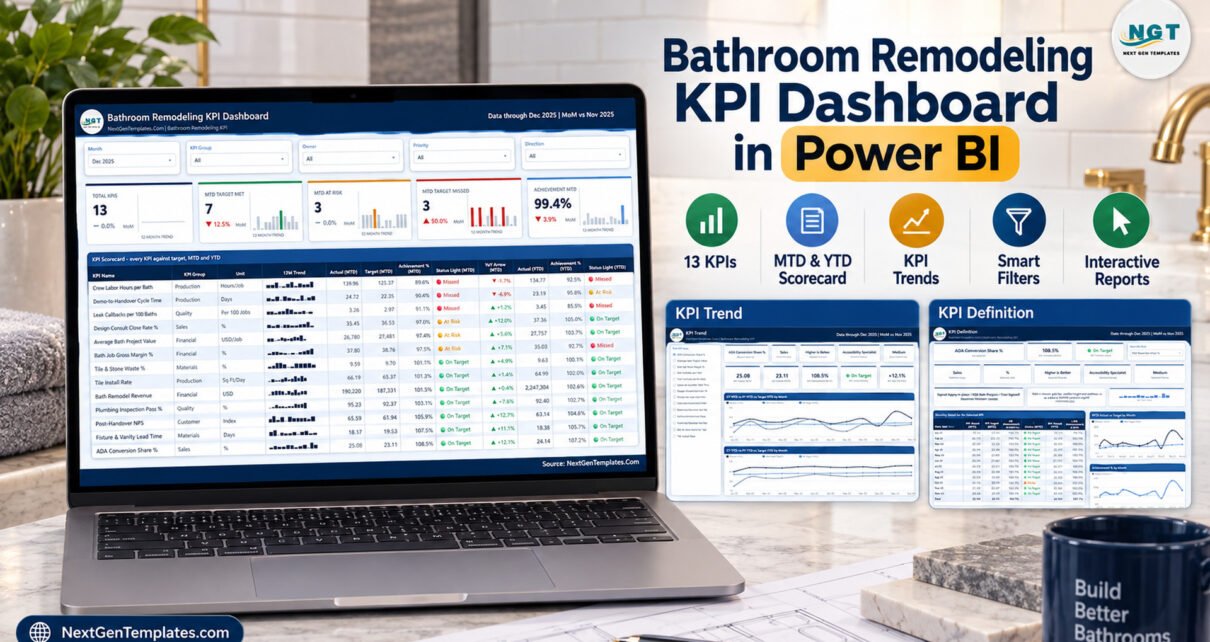
The Bathroom Remodeling KPI Dashboard in Power BI puts 13 KPIs from a bathroom remodeling business on one scorecard, split into 6 groups and scored against monthly targets for both Month-to-Date and Year-to-Date. Its sample data runs from January to December 2025, with 2024 as the prior year, and the December view shows 7 KPIs On Target, 3 At Risk and 3 Missed at an overall MTD achievement of 99.4%.
Bathroom work concentrates risk in a small room: waterproofing, rough-in plumbing, tile and made-to-order fixtures all have to land in sequence while the client goes without a bathroom. Most remodelers see those problems job by job, in the job software or in a spreadsheet, but rarely as a monthly trend against a target. This post walks through each page of the report, what it measures, where it fits next to paid software, and where its limits are.
The Bathroom Remodeling KPI Dashboard in Power BI is part of our Power BI KPI Dashboard line, which pairs a month slicer and traffic lights with KPI Trend and KPI Definition pages. That is a different product family from our analytical Power BI dashboards, which chart row-level transactions instead of one actual and one target per KPI per month.
Key Features of the Bathroom Remodeling KPI Dashboard in Power BI
- 13 KPIs built for bathroom remodelers. Financial: Bath Remodel Revenue, Average Bath Project Value and Bath Job Gross Margin %. Sales: Design Consult Close Rate % and ADA Conversion Share %. Production: Tile Install Rate, Demo-to-Handover Cycle Time and Crew Labor Hours per Bath. Quality: Plumbing Inspection Pass % and Leak Callbacks per 100 Baths. Materials: Tile & Stone Waste % and Fixture & Vanity Lead Time. Customer: Post-Handover NPS.
- Achievement that respects direction. 8 KPIs are higher-is-better (UTB) and 5 are lower-is-better (LTB). A UTB KPI scores Actual divided by Target; an LTB KPI scores Target divided by Actual. That is why Fixture & Vanity Lead Time at 18.17 days against a 19.53-day target reads 107.5%, not 93%.
- Three status bands. On Target is 100% or more, At Risk is 95% to just under 100%, and Missed is below 95%. The same rule drives the MTD light, the YTD light and the header counts.
- Owners and priorities on every KPI. Ten owner roles, from General Manager and Licensed Plumber to Purchasing Lead and Client Care Coordinator, and three priorities: 5 Critical, 6 High and 2 Medium KPIs.
- Tooltips instead of clutter. Two hidden tooltip pages, KPI Detail and Trend Detail, add owner, variance, priority and on-target rate when you hover, without crowding the main pages.
- A data model you can extend. Nothing in the report hard-codes a KPI. Rename, add or delete rows in Data.xlsx and the slicers, table, cards and charts follow on the next refresh.
Dashboard Pages Explanation
The report has four visible pages plus two tooltip pages. Every page carries the same header with the data month, here “Data through Dec 2025 | MoM vs Nov 2025”.
Page 1: KPI Scorecard
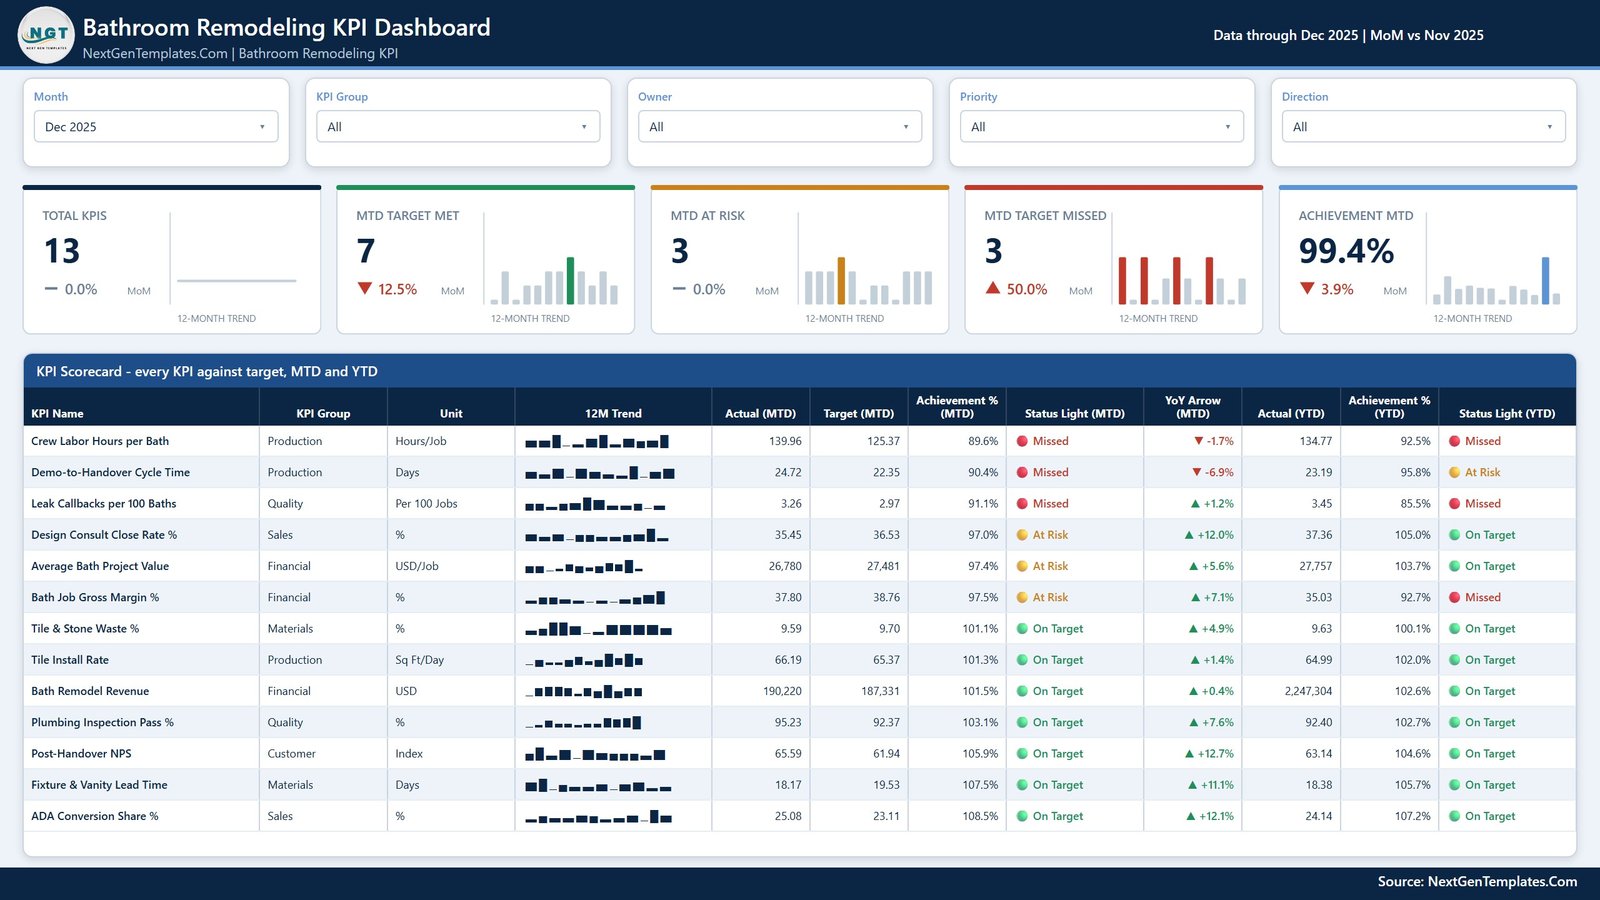
The landing page has five slicers across the top: Month, KPI Group, Owner, Priority and Direction. Below them, five cards count Total KPIs (13), MTD Target Met (7, down 12.5% on November), MTD At Risk (3), MTD Target Missed (3, up 50.0%) and Achievement MTD (99.4%, down 3.9%), each with a 12-month mini chart.
The KPI Scorecard table lists all 13 KPIs with KPI Group, Unit, a 12M Trend sparkline, Actual (MTD), Target (MTD), Achievement % (MTD), Status Light (MTD), YoY Arrow (MTD), Actual (YTD), Achievement % (YTD) and Status Light (YTD). In the sample, Crew Labor Hours per Bath, Demo-to-Handover Cycle Time and Leak Callbacks per 100 Baths are the three Missed KPIs for December.
Page 2: KPI Trend
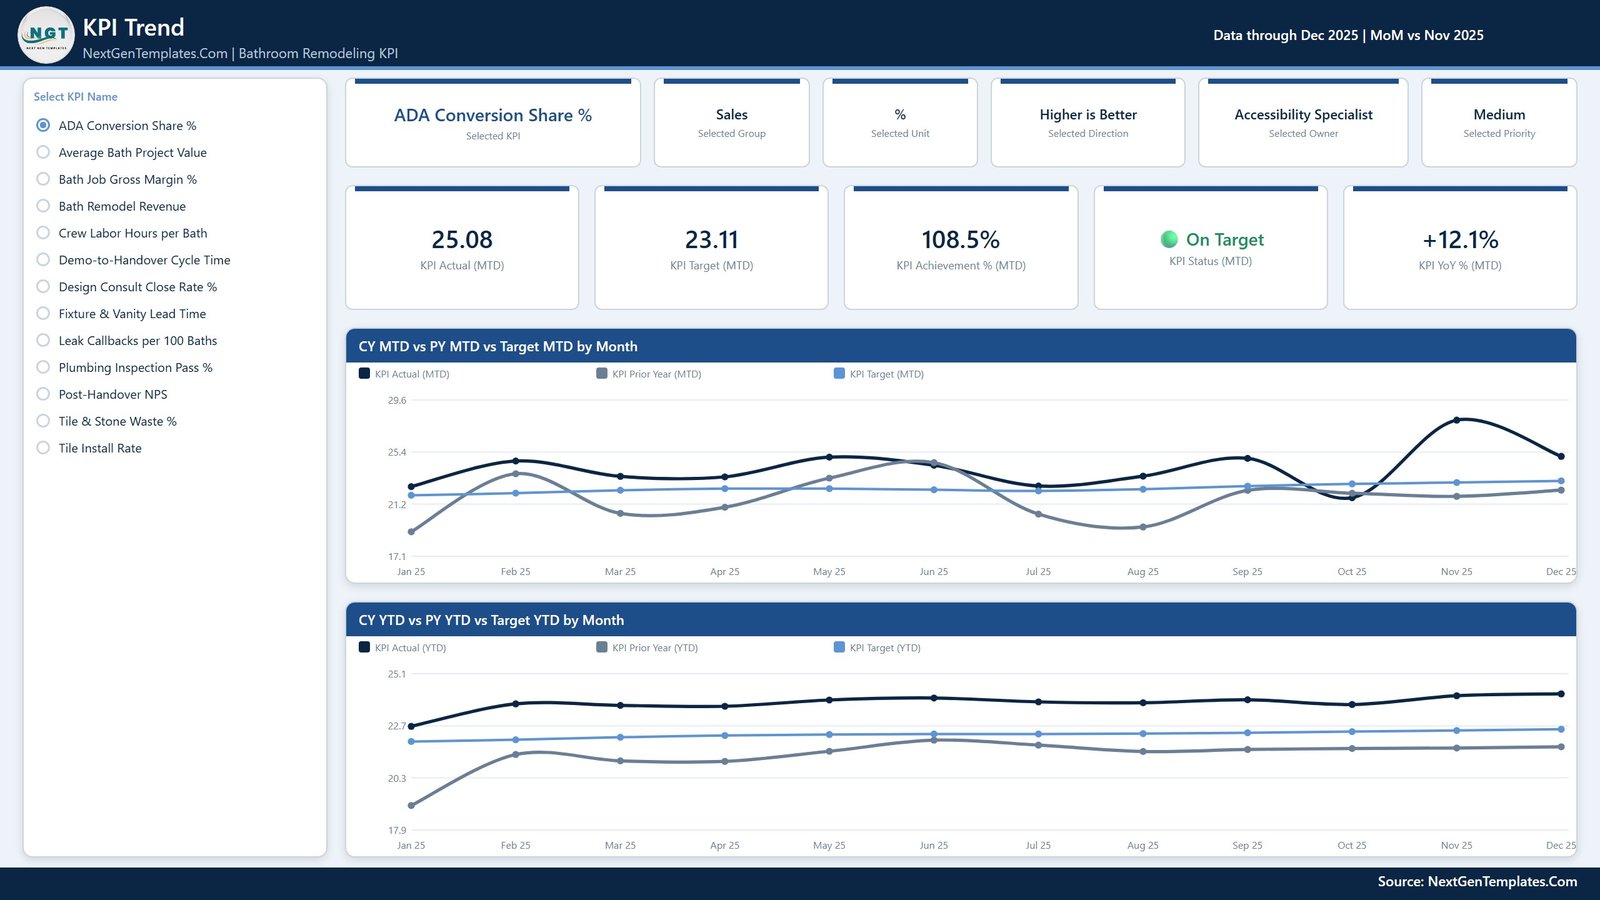
A list slicer on the left selects one KPI. Six context cards show the KPI, its group, unit, direction, owner and priority, and five value cards show KPI Actual (MTD), KPI Target (MTD), KPI Achievement % (MTD), KPI Status (MTD) and KPI YoY % (MTD). Two charts follow: CY MTD vs PY MTD vs Target MTD by Month, and CY YTD vs PY YTD vs Target YTD by Month.
With ADA Conversion Share % selected, the page shows 25.08% against a 23.11% target, 108.5% achievement, On Target and +12.1% year over year, owned by the Accessibility Specialist at Medium priority.
Page 3: KPI Definition
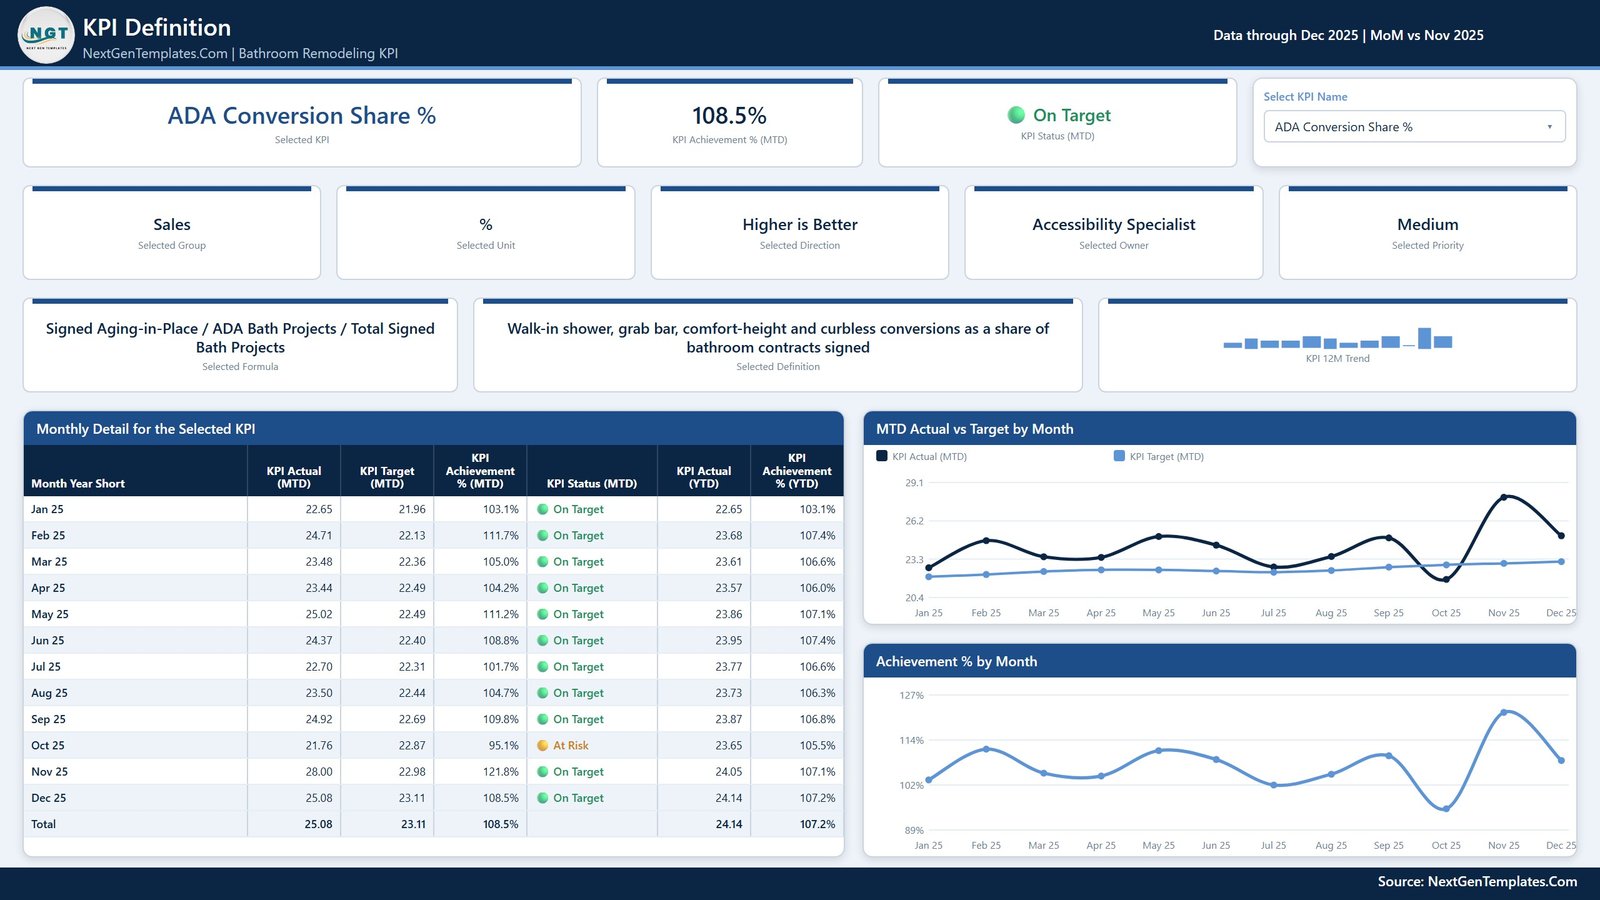
This page explains the selected KPI. Cards show its achievement, status, group, unit, direction, owner, priority, formula and definition, next to a KPI 12M Trend sparkline. The Monthly Detail for the Selected KPI table lists 12 months plus a total, with KPI Actual, KPI Target and KPI Achievement % for MTD, KPI Status (MTD), and KPI Actual and Achievement % for YTD.
Two charts sit alongside: MTD Actual vs Target by Month and Achievement % by Month. For ADA Conversion Share %, the formula reads “Signed Aging-in-Place / ADA Bath Projects / Total Signed Bath Projects”, and October 2025 is the only At Risk month at 95.1%.
Page 4: Get More Templates
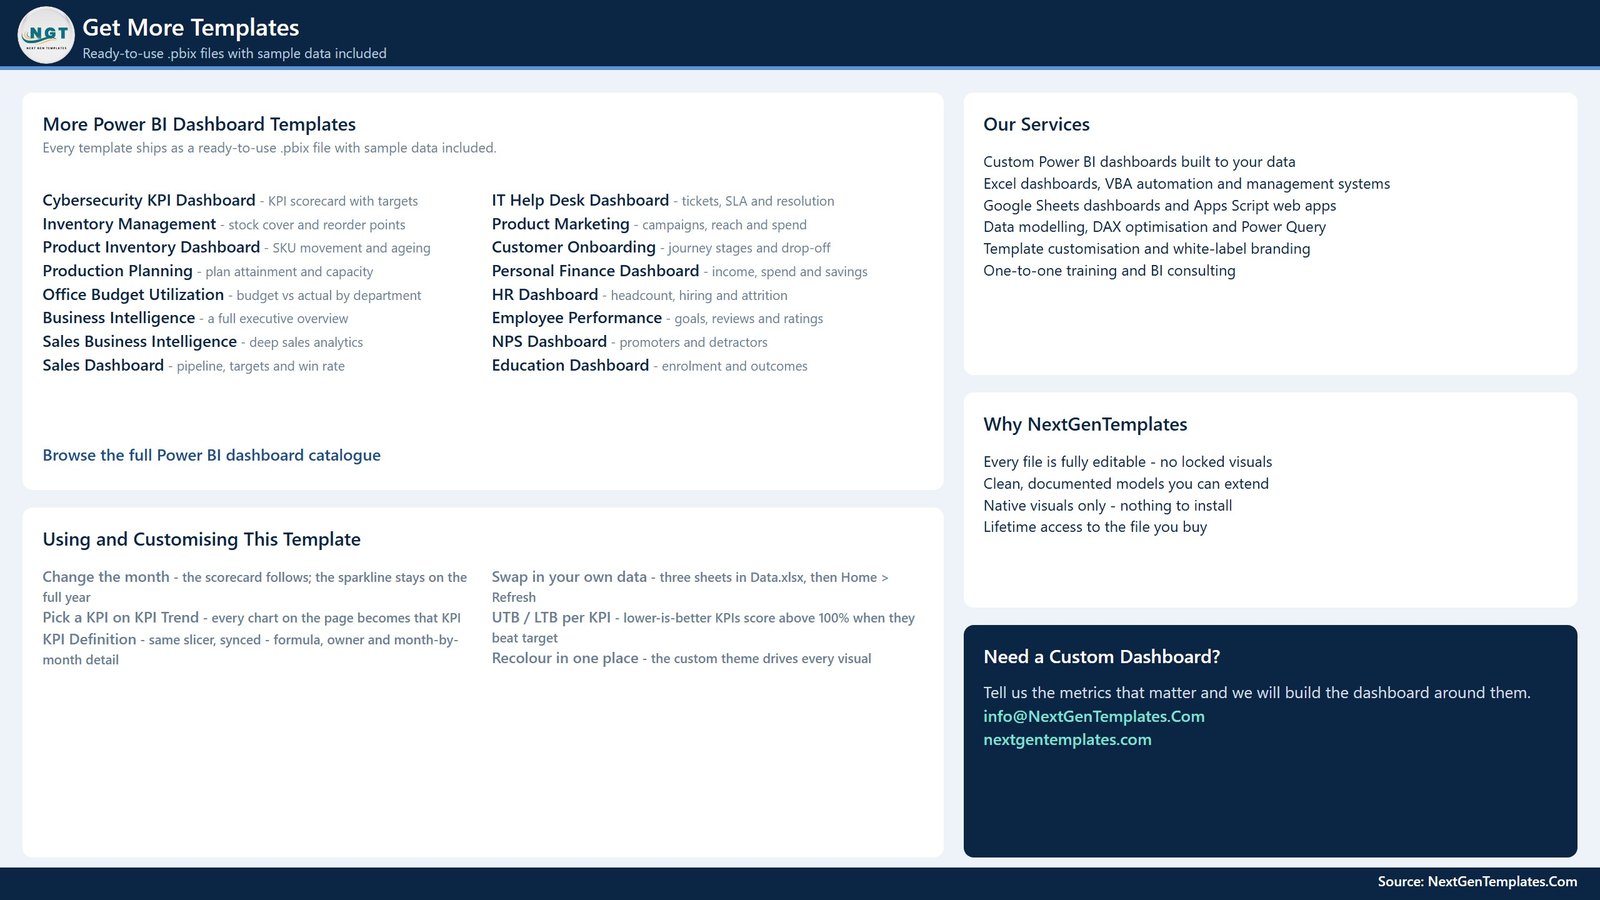
The last page lists more Power BI templates, gives usage tips (change the month, pick a KPI on KPI Trend, swap in your own data, UTB and LTB scoring, recolour in one place) and explains how to request a custom dashboard.
Tooltip pages: KPI Detail and Trend Detail
Both are hidden in view mode and appear on hover. KPI Detail is attached to the scorecard table and shows owner, MTD achievement and variance. Trend Detail is attached to the four line charts and the monthly detail table, and shows priority, MTD and YTD achievement, variance and on-target rate. Microsoft explains how report tooltip pages work in its Power BI tooltip documentation.
This Power BI KPI Dashboard vs. Tableau / Qlik vs. Buildertrend / JobTread — Feature Comparison
| Feature | This bathroom remodeling KPI dashboard | Tableau / Qlik build | Buildertrend / JobTread |
|---|---|---|---|
| Cost | ✅ $12.99 sale ($19.99 regular), one time | Per-user licences plus build time | Recurring subscription |
| Platform | Power BI Desktop (Windows) | Tableau or Qlik | Web and mobile app |
| Setup time | ✅ Open, point at Data.xlsx, Refresh | Model and visuals built from scratch | Account onboarding and job setup |
| Bathroom remodeling KPIs out of the box | ✅ 13, each with formula and owner | None shipped | Vendor’s own job reports |
| Direction-aware target scoring | ✅ UTB and LTB built in | Must be written | Depends on the report |
| Real-time team collaboration | After publishing to the Power BI Service | Via Tableau Cloud or Qlik Cloud | ✅ Built in |
| Mobile access | Power BI mobile app after publishing | ✅ Mobile apps | ✅ Mobile apps |
| Customizable KPI list | ✅ Edit rows in Data.xlsx | ✅ Fully custom | Limited to the vendor’s fields |
| Year-1 cost at 5 users | ✅ One purchase; Microsoft licences only if you share online | Five user licences | Subscription for the team |
For remodelers who want a disciplined monthly KPI review without paying for a full job-management platform, this Power BI KPI dashboard sits in the sweet spot.
Who Should Use This Template
Perfect for:
- Owners and general managers of bathroom remodeling firms who run a monthly numbers meeting.
- Project managers and field superintendents who answer for cycle time and crew labor hours.
- Warranty, quality and plumbing leads who own leak callbacks and first-time inspection passes.
- Sales managers following design consultations and aging-in-place or ADA bathroom demand.
- BI consultants who want a remodeling KPI pack to adapt rather than build from zero.
Not a fit if:
- You need scheduling, estimating, invoicing, change orders or a client portal. This is a reporting layer.
- Your team works only on Mac, because Power BI Desktop runs on Windows.
- You need permit, building-code, plumbing or electrical licensing, or warranty compliance records. The report shows the figures you type in; it does not verify or certify anything.
Real-World Use Cases
Maria owns a bathroom remodeling company with four install crews. In her monthly review she filters to the Financial group and sees Bath Job Gross Margin % At Risk for December and Missed for the year at 92.7% YTD achievement. KPI Definition shows the margin formula deducts labor, tile, fixture and subcontractor cost, so she knows the gap is real rather than a revenue timing issue, and she re-prices her next wet-room quotes.
Dev is the warranty manager. He sets the Owner slicer to Warranty Manager, which leaves one Critical KPI: Leak Callbacks per 100 Baths, Missed at 3.26 against 2.97. KPI Trend lets him compare 2025 with 2024 month by month and bring a clear question to the field superintendent: is the shower pan and membrane issue a single bad month or a trend?
Alicia leads sales and accessibility projects. She watches ADA Conversion Share % at 25.08% against 23.11% next to Design Consult Close Rate %, which is At Risk at 97.0% of target. Demand for walk-in showers and grab bars is running ahead of plan while general consultations convert slightly below it, so she gives aging-in-place leads their own consultation slot.
Advantages of This Power BI KPI Dashboard
- One page answers “how did we do this month?” The header counts and traffic lights replace a stack of job reports.
- Fair scoring across mixed units. Dollars, days, percentages, square feet per day and an NPS index are compared through achievement %, so the counts stay meaningful.
- Accountability is built in. Every KPI has an owner and a priority, so the Owner and Priority slicers turn the scorecard into a personal to-do list.
- Prior-year context. Because Input_ Actual holds two years, every KPI shows year-over-year change and PY lines on the trend charts.
- Low cost to start. Power BI Desktop is free, the template is a one-time purchase, and your data lives in one Excel workbook.
Opportunities for Improvement
- The YoY Arrow (MTD) column is not direction-aware. It colours by the sign of the change only. Crew Labor Hours per Bath fell 1.7% year over year, an improvement for a lower-is-better KPI, yet shows a red down arrow; Tile & Stone Waste % rose 4.9% and shows a green up arrow. Achievement %, both status lights and the header counts are direction-aware and correct, so read the arrow as “up or down”, not “good or bad”.
- No drillthrough page. Detail comes from the KPI Trend and KPI Definition pages and the two tooltips, not from a right-click drillthrough.
- Monthly grain only. The Bathroom Remodeling KPI Dashboard in Power BI takes one actual and one target per KPI per month, so weekly or per-job analysis needs a different report.
- Sample figures. All shipped numbers are realistic sample values, not benchmarks for the bathroom remodeling industry. Set targets from your own history.
Best Practices
- Agree formulas before entering data. Confirm with your team what counts as a leak callback or a first-time inspection pass, and write it into the Definition column.
- Average rates, sum amounts. For YTD, add up revenue and other additive values, but average percentages, days and indexes. The Data.xlsx Read Me explains this rule.
- Keep two years of actuals. Without the prior year, YoY and PY lines go blank.
- Review by owner. Give each owner a filtered view, starting with the 5 Critical KPIs.
- Refresh on a fixed day. Update Data.xlsx and refresh at the same point each month so trends compare like with like.
Explore Relevant Templates
If you run other trades, the same KPI dashboard layout is available for glass installation, window and door installation and drywall contractors. In the store:
- Plumbing Business KPI Dashboard in Power BI
- Flooring Installation KPI Dashboard in Power BI
- Home Renovation Project Management Web App
- Bathroom Remodeling KPI Scorecard in Google Sheets (a separate scorecard product for Google Sheets users)
An Excel edition of this bathroom remodeling KPI dashboard and a Kitchen Remodeling KPI Dashboard in Power BI are in preparation.
Frequently Asked Questions
What does the Bathroom Remodeling KPI Dashboard in Power BI measure?
It measures 13 KPIs in six groups: revenue, average project value and gross margin; design consult close rate and ADA conversion share; tile install rate, demo-to-handover days and crew labor hours; plumbing inspection pass rate and leak callbacks; tile waste and fixture lead time; and post-handover NPS.
Do I need a Power BI Pro licence to use it?
No. You can open, edit and refresh the report in Power BI Desktop, which Microsoft provides free. A licence only matters if you publish the report to the Power BI Service to share it, and then Microsoft’s licensing terms for that service apply.
How long does setup take?
The sample opens immediately. For your own data you need 13 KPI definition rows, 12 monthly targets per KPI and 24 months of actuals per KPI, covering this year and last year. After that, one Home > Refresh updates all four pages.
How does this compare to Buildertrend or JobTread?
Buildertrend and JobTread manage jobs, schedules and client communication on a subscription. This dashboard focuses on monthly KPI scoring for a one-time price. The two work together: export monthly totals from your job software into Data.xlsx and refresh.
Can I change or add KPIs?
Yes. Add a row in KPI Definition plus its monthly target and actual rows, or rename or delete a KPI in all three sheets, then refresh. The KPI list, scorecard, counts and charts all follow, because no KPI is hard-coded in the report.
Does it track permits or code compliance?
No. Plumbing Inspection Pass % is a rate you enter from your own records. The dashboard does not check permits, building codes, licensing or warranty obligations, and it should not be used as evidence of compliance.
About the Author
Built by PK, Microsoft Certified Professional with 15+ years of Excel, Google Sheets and Power BI experience and founder of NextGenTemplates. Every template is hand-built and tested before release.
Conclusion
A bathroom remodeling business lives or dies on margin, handover speed and callbacks, and those are exactly the numbers this report puts in front of you every month, each with an owner, a target and a traffic light. If you already have your monthly figures in job software or a spreadsheet, the move to a scored Power BI view is one workbook away.
👉 Click here to purchase the Bathroom Remodeling KPI Dashboard in Power BI
✅ Instant download · One-time payment · No subscription
Last updated: September 2026
Visit our YouTube channel for video tutorials: Youtube.com/@PKAnExcelExpert