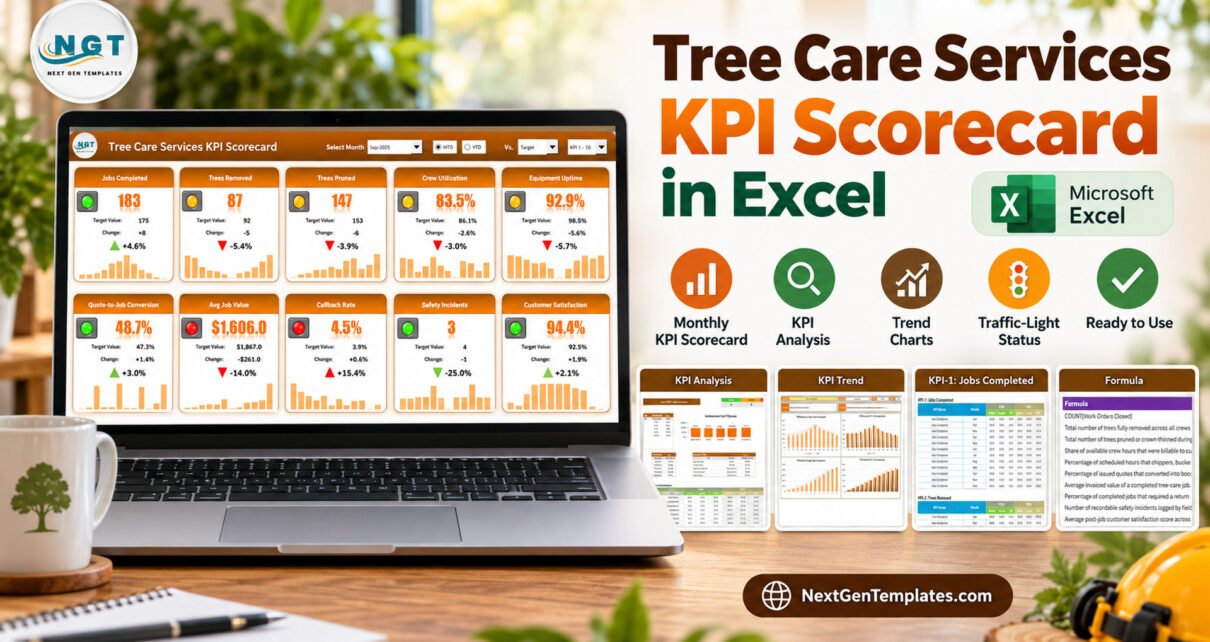
The Tree Care Services KPI Scorecard in Excel gives a tree removal, pruning or arborist business one monthly page for the numbers that decide a good month: jobs completed, trees removed and pruned, crew utilization, equipment uptime, quote conversion, average job value, callbacks, safety incidents and customer satisfaction. It is a ready-made Excel workbook with 9 visible sheets, room for 20 KPIs and a full 2025 sample year, and it works on formulas alone – no macros, no Power Query, no add-ins.
Most tree service companies already have these figures somewhere: work orders in one system, quotes in another, crew hours on timesheets, callbacks in the office inbox and survey scores in an email tool. This scorecard does not replace any of those. It gives the monthly review meeting a single view, with traffic lights that tell you where to look first.
A quick note on naming, because there are two tree care templates on our store. This article covers the KPI scorecard (10 KPIs on a card wall, 9 sheets). The Tree Care Services KPI Dashboard in Excel is a separate template from our KPI dashboard family, with 15 KPIs over 10 pages.
Key Features of Tree Care Services KPI Scorecard in Excel
- Industry KPI list: Jobs Completed, Trees Removed, Trees Pruned, Crew Utilization, Equipment Uptime, Quote-to-Job Conversion, Avg Job Value, Callback Rate, Safety Incidents and Customer Satisfaction.
- Five KPI groups: Operations holds five KPIs, Sales two, and Quality, Safety and Customer one each.
- Direction-aware traffic lights: eight KPIs are upper-the-better (UTB); Callback Rate and Safety Incidents are lower-the-better (LTB), so both the light and the arrow reward a fall.
- Scorecard tiles: value, comparison value, change, percentage change with arrow, traffic light and a 12-month sparkline on every card.
- Header controls: Select Month, MTD/YTD, Vs. Target / PY / Prior Month, and a KPI 1-10 / KPI 11-20 set picker.
- Analysis and trend pages: RAG counts, achievement by group, Top 5 and Bottom 5 KPIs, and four trend charts for any single KPI.
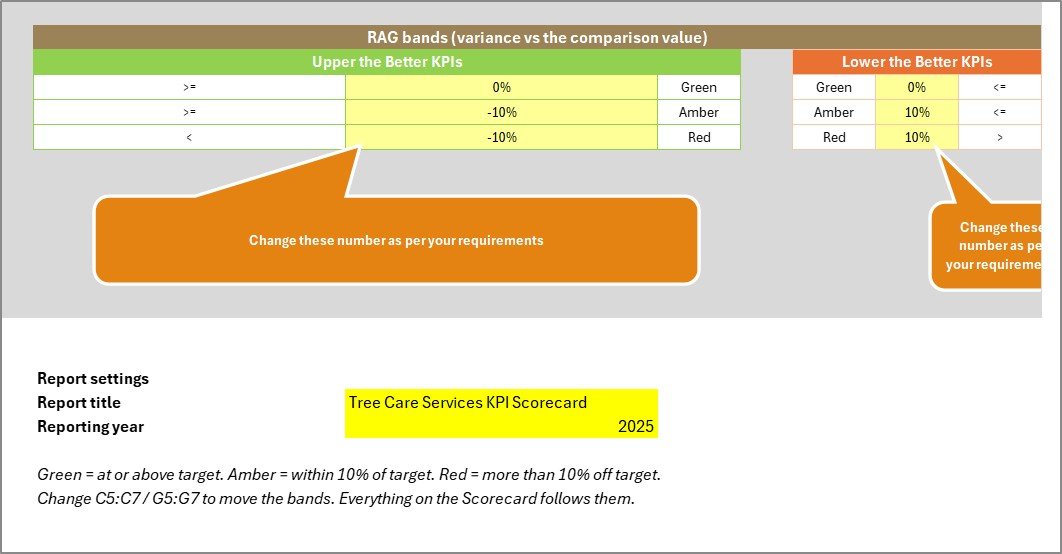
- Editable thresholds: the green, amber and red bands live on Color Settings and drive every status on every page.
Workbook Pages Explained
Home
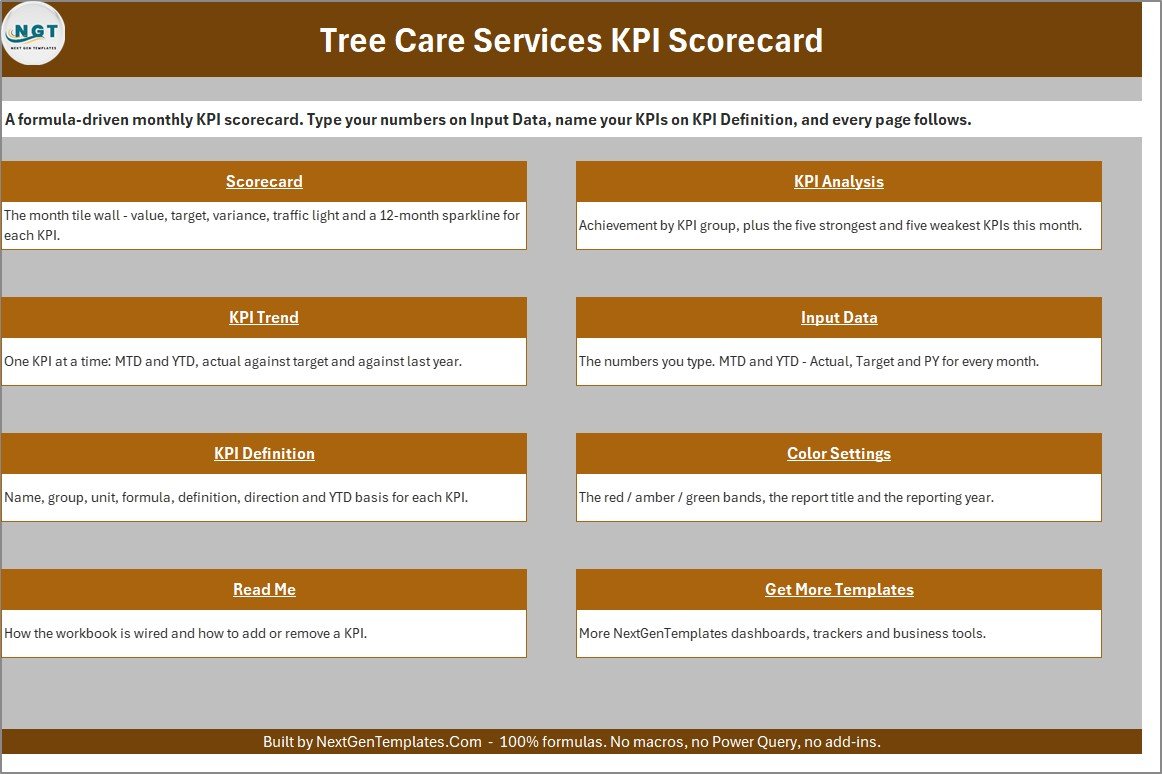
The Home sheet is the table of contents. It describes each page in one line and sums up the idea behind the file: type your numbers on Input Data, name your KPIs on KPI Definition, and every page follows.
Scorecard
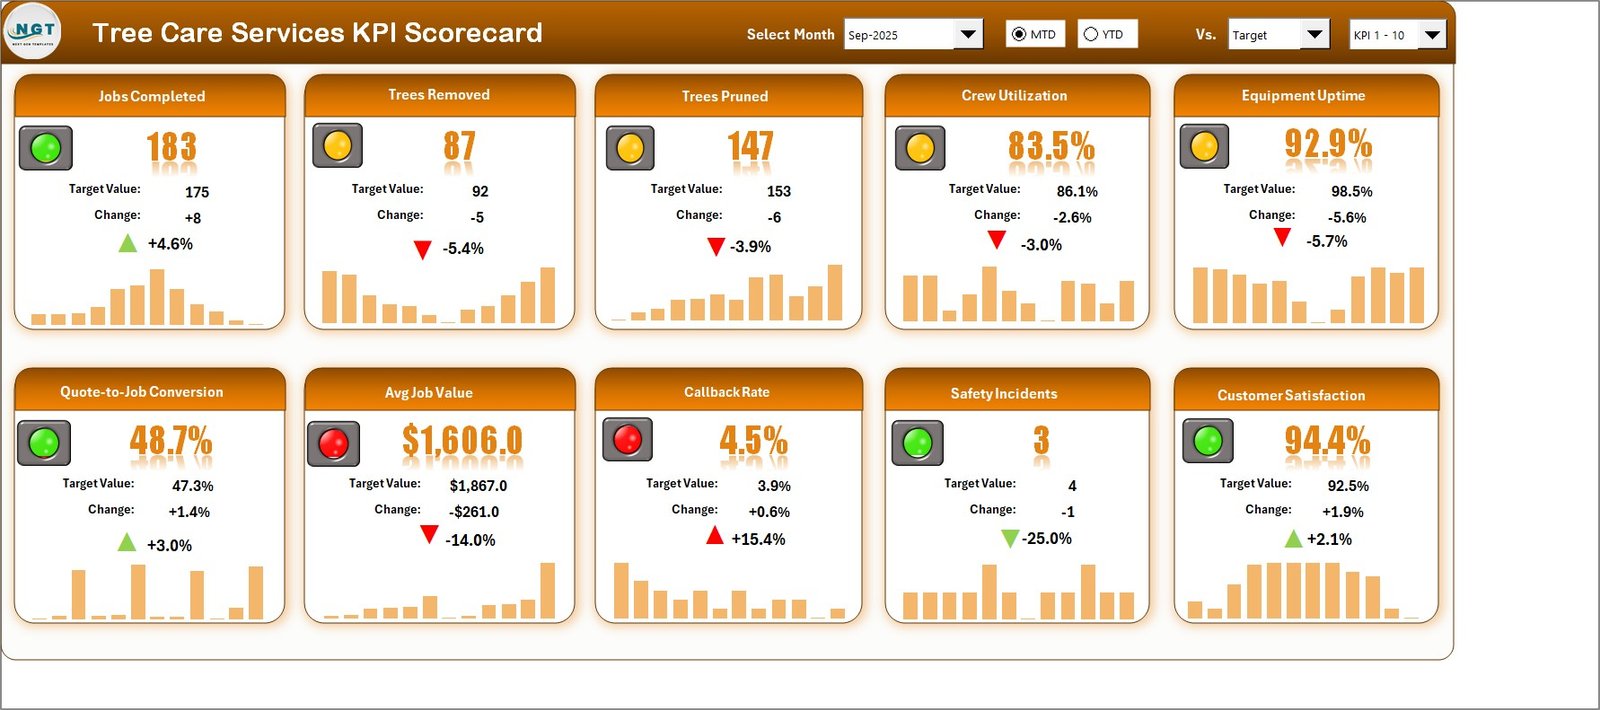
The Scorecard sheet shows ten cards in two rows of five. The September 2025 sample, compared MTD against target, reads like this:
| KPI | Actual | Target | Status |
|---|---|---|---|
| Jobs Completed | 183 | 175 | Green |
| Trees Removed | 87 | 92 | Amber |
| Trees Pruned | 147 | 153 | Amber |
| Crew Utilization | 83.5% | 86.1% | Amber |
| Equipment Uptime | 92.9% | 98.5% | Amber |
| Quote-to-Job Conversion | 48.7% | 47.3% | Green |
| Avg Job Value | $1,606 | $1,867 | Red |
| Callback Rate (LTB) | 4.5% | 3.9% | Red |
| Safety Incidents (LTB) | 3 | 4 | Green |
| Customer Satisfaction | 94.4% | 92.5% | Green |
KPI Analysis
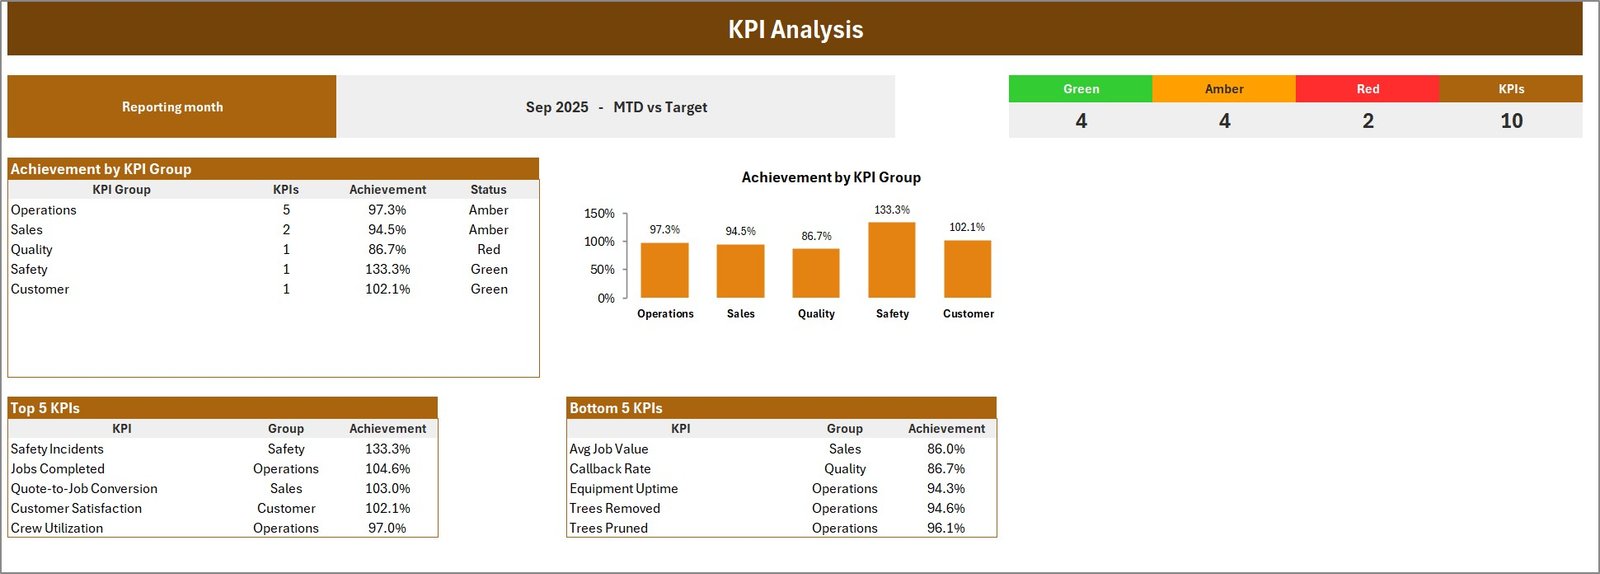
KPI Analysis counts 4 green, 4 amber and 2 red KPIs for the selected month and ranks the groups: Safety 133.3%, Customer 102.1%, Operations 97.3%, Sales 94.5% and Quality 86.7%. The Top 5 table is led by Safety Incidents and Jobs Completed; the Bottom 5 starts with Avg Job Value (86.0%) and Callback Rate (86.7%).
KPI Trend
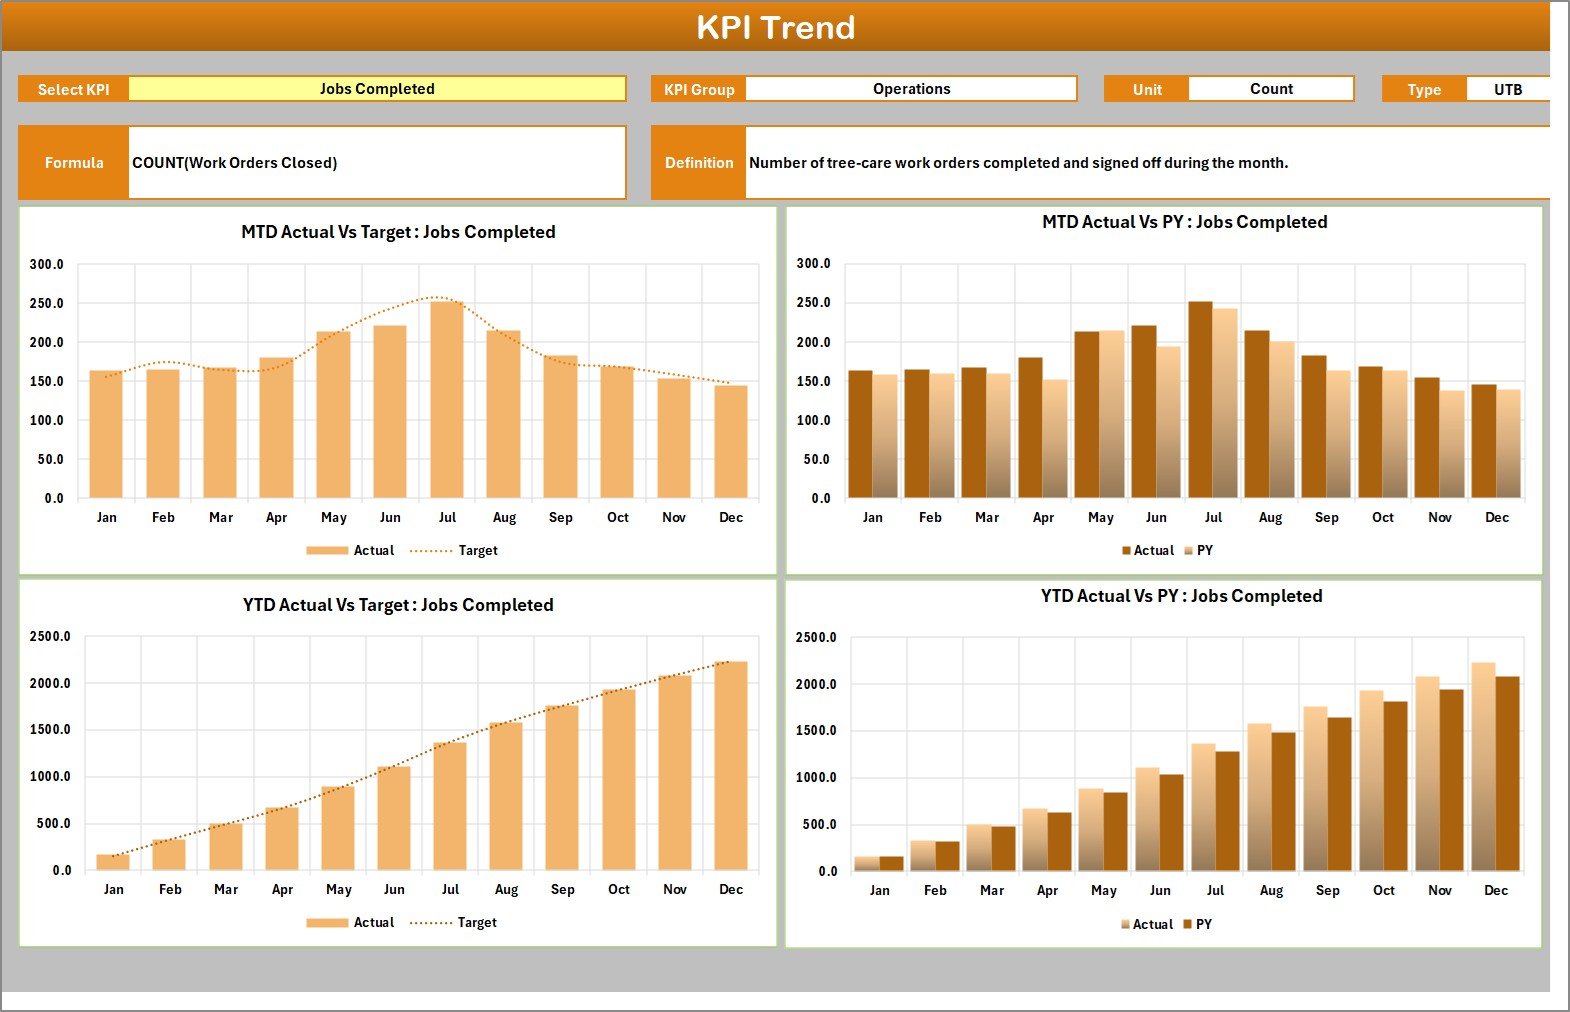
Choose any KPI from the dropdown and the page shows its group, unit, formula, definition and type above four charts: MTD Actual vs Target, MTD Actual vs PY, YTD Actual vs Target and YTD Actual vs PY. On Jobs Completed you can see the summer peak of 252 jobs in July and the year closing at 2,229 jobs against a 2,234 target.
Input Data
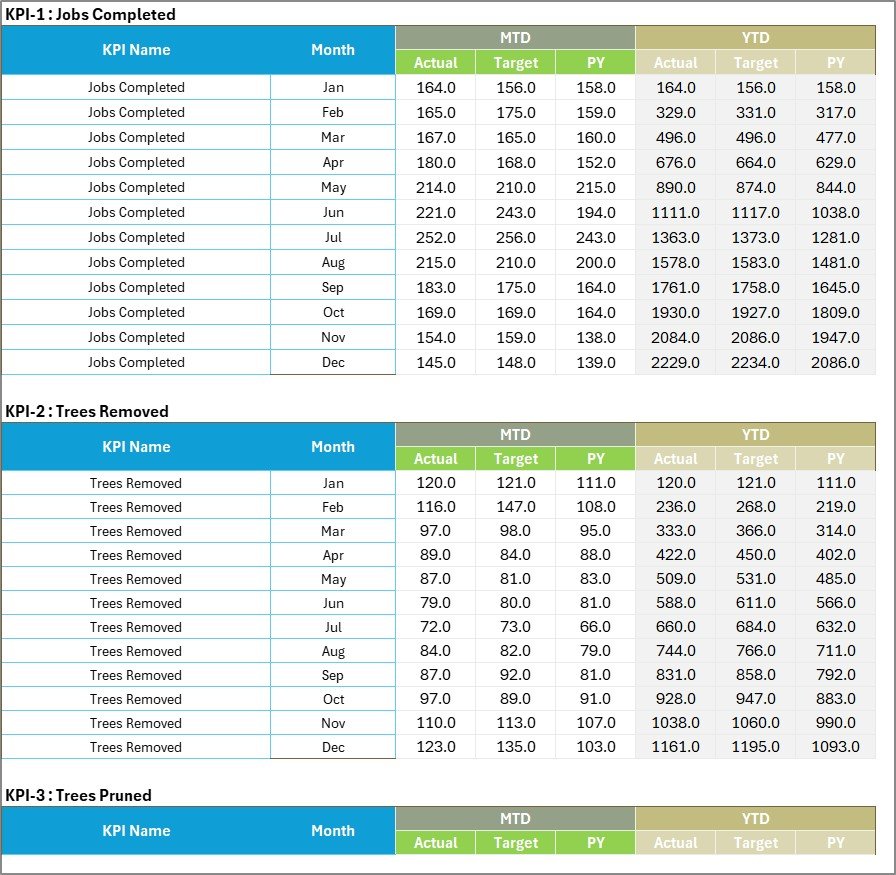
Each KPI has its own 12-month block. You type MTD Actual, Target and PY, and the matching YTD Actual, Target and PY. The workbook deliberately does not roll YTD up for you, because a count like Trees Removed should be summed while a rate like Crew Utilization needs an average.
KPI Definition
This is the master list: group, name, unit, formula, definition, type and YTD basis for each KPI, plus a Check column that turns red if two KPIs share a name. For example, Crew Utilization is defined as billable crew hours divided by available crew hours, and Equipment Uptime as operational hours divided by scheduled hours for chippers, bucket trucks and saws.

Color Settings, Read Me and Get More Templates
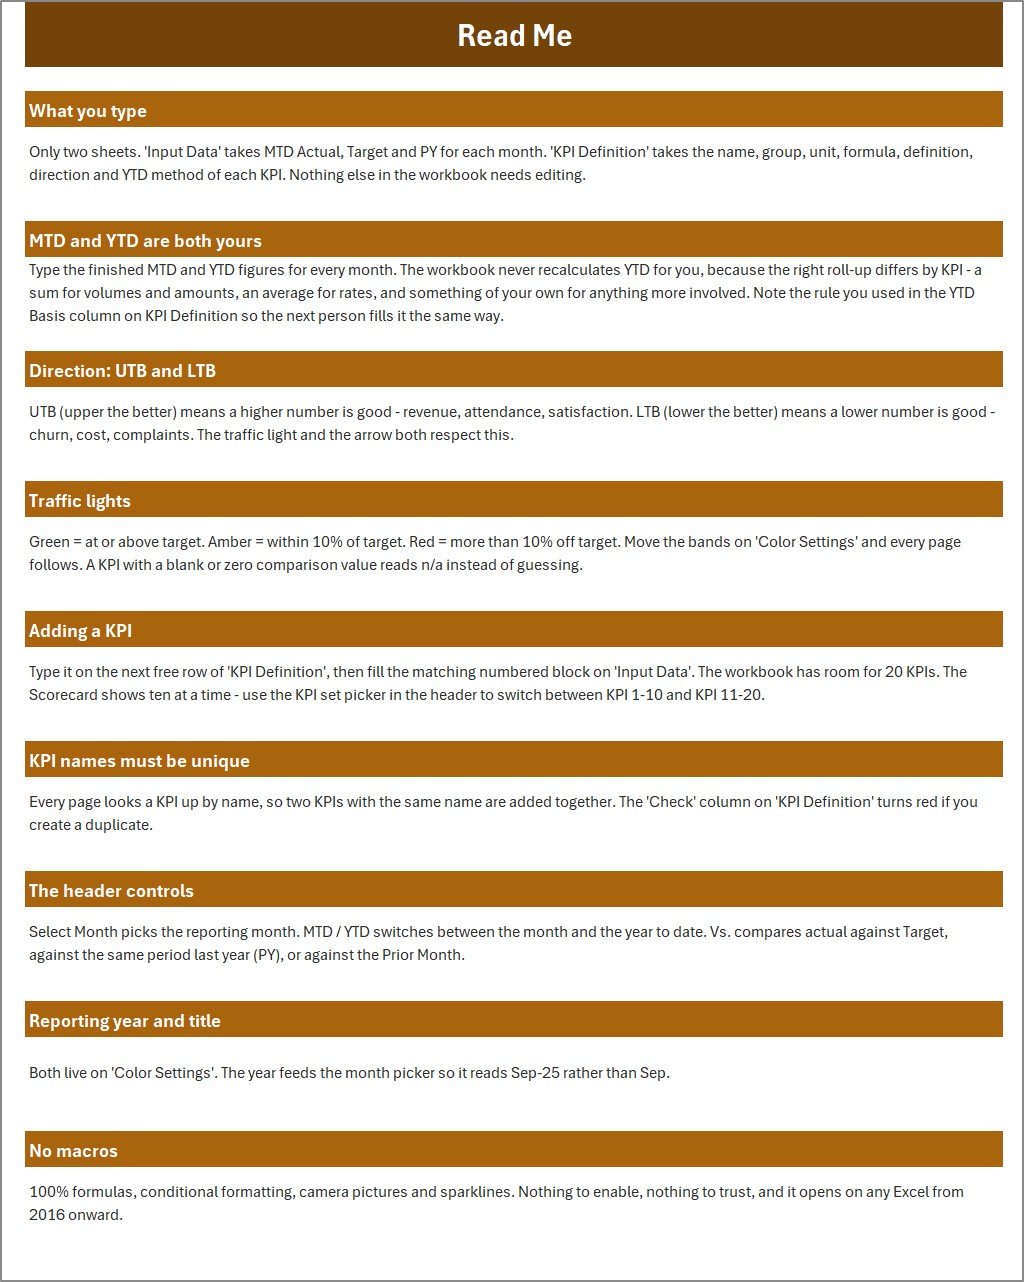
Color Settings holds the RAG bands for both directions (green at or better than target, amber within 10%, red beyond 10% by default), the report title and the reporting year that feeds the month picker. Read Me walks through what to type, MTD and YTD, UTB and LTB, the traffic lights, adding a KPI and the header controls. Get More Templates points to related product lines.
Excel Scorecard vs. Google Sheets vs. Field Service Software – Feature Comparison
| Feature | This Excel scorecard | Google Sheets build | Field service SaaS |
|---|---|---|---|
| Cost | One-time template price | Free app, build time required | Monthly subscription |
| Platform | Desktop Microsoft Excel | Browser spreadsheet | Web and mobile app |
| Setup time | Ready after download | Build formulas and charts yourself | Accounts, imports, training |
| Traffic lights and sparklines | Already built | Manual setup | Plan-dependent |
| Custom KPIs | 20 slots | Unlimited if you build it | Vendor-defined reports |
| Crew scheduling and invoicing | Not included | Not included unless built | Usually included |
| Best fit | Monthly KPI review | Shared custom sheet | Day-to-day job management |
Who Should Use This Template
The scorecard is a good fit for small and mid-sized tree service companies, arborist firms and landscaping businesses with dedicated tree crews that hold a monthly performance meeting. Owners can watch Avg Job Value and Quote-to-Job Conversion, operations leads can follow Crew Utilization and Equipment Uptime, and office managers can keep an eye on Callback Rate and Customer Satisfaction.
It is not a scheduling, quoting, invoicing, crew timesheet or equipment maintenance system, and it is not a safety tool. Safety Incidents is simply a monthly count you type in; the workbook does not log incidents, track training or certification, or check compliance with any safety standard. Tree work is dangerous, and none of that changes because a number turns green.
Real-World Use Cases
Pricing review: Avg Job Value is red at $1,606 against $1,867 while Jobs Completed is green. The owner uses KPI Trend to see whether a run of small pruning jobs pulled the average down.
Downtime before headcount: Crew Utilization and Equipment Uptime are both amber. Before hiring, the operations lead checks how many scheduled hours the chipper and bucket truck actually ran.
Callback follow-up: Callback Rate is red at 4.5% against 3.9%, so the office reviews which jobs needed a return visit and why.
Advantages of Tree Care Services KPI Scorecard in Excel
- One page for the monthly conversation instead of five separate reports.
- Lower-the-better KPIs are scored correctly, so fewer callbacks and incidents read as good news.
- Inputs, definitions, analysis and trends are kept on separate sheets, which makes handover easy.
- No macros to enable and no subscription to renew.
- Every KPI is documented with a formula and definition, so the next person fills it in the same way.
Opportunities for Improvement
- YTD values are typed rather than calculated, so the YTD Basis column needs to be followed consistently.
- The month picker covers one reporting year per file; keep a copy per year.
- It reports monthly totals and cannot drill into individual jobs, crews or service types.
- RAG bands apply per direction rather than per KPI, and a zero comparison value reads n/a, so a zero-incident safety target cannot be scored as written.
- The header dropdowns and option buttons are desktop Excel form controls and are not built for Excel for the web.
Best Practices
- Agree each KPI definition before entering the first month, especially what counts as a callback.
- Use seasonal targets: removal and pruning volumes swing between storm season, summer and winter.
- Convert survey scores to a percentage before typing Customer Satisfaction, as the sample does.
- Start the meeting on the Bottom 5 table, then open KPI Trend before deciding anything.
- Write down the source system for every KPI so month-end entry takes minutes, not hours.
- For formula basics, see Microsoft’s overview of formulas in Excel.
Explore Relevant Templates
- Landscaping Dashboard in Excel
- Swimming Pool Service KPI Scorecard in Excel
- Plumbing Business KPI Scorecard in Excel
- KPI Dashboard Library (Excel)
Related guides on this site: Swimming Pool Service KPI Scorecard in Excel, Septic Tank Service KPI Scorecard in Excel, Fire Safety Services KPI Scorecard in Excel and Plant Nurseries Dashboard in Excel.
Frequently Asked Questions
What is included in the download?
A ZIP containing the Excel workbook and a PDF user manual. The workbook has 9 visible sheets and 10 prefilled tree-care KPIs.
Which KPIs are lower-the-better?
Callback Rate and Safety Incidents. The other eight are upper-the-better, and you can change the direction on KPI Definition.
Does the scorecard use macros?
No. It uses formulas, conditional formatting, camera pictures, form controls and sparklines only.
Can I add my own KPIs?
Yes. There are 20 KPI slots; the Scorecard shows KPI 1-10 or KPI 11-20 through the set picker in the header.
Is this the same as the tree care KPI dashboard?
No. The scorecard is a 10-KPI card wall on 9 sheets. The Tree Care Services KPI Dashboard in Excel is a separate 15-KPI template from the KPI dashboard family.
Which Excel version do I need?
Desktop Microsoft Excel 2016 or later. The header controls are desktop form controls and are not designed for Excel for the web.
About the Author
Built by PK – Microsoft Certified Professional with 15+ years of Excel, Google Sheets, and Power BI experience. Founder of NextGenTemplates, reaching 300K+ subscribers across YouTube channels. Every template is hand-built and tested before release.
Conclusion
A tree service business lives on booked work, productive crews, running equipment, jobs done right the first time and customers who call again. This workbook turns those monthly numbers into a page you can review in ten minutes, without turning Excel into an operations system.
Click here to purchase the Tree Care Services KPI Scorecard in Excel
Instant download. One-time payment. No subscription.
Watch more tutorials at YouTube.com/@PKAnExcelExpert.
Last updated: September 2026