Car customization workshops deal with complex, multi-dimensional data every day — projects across multiple vehicle brands, technicians with varying skill levels, services ranging from audio installs to full wraps, and customers arriving through different booking channels. Car Customization Firms Dashboard in Power BI Without a centralized analytics tool, owners and managers end up making decisions based on gut feel rather than data.
This Car Customization Firms Dashboard in Power BI changes that. Built as a ready-to-use .pbix file, it delivers 5 fully interactive report pages covering every critical dimension of your workshop operations — revenue, profitability, service performance, customer segments, and vehicle brand trends. Whether you run a single workshop or manage multiple branches, this dashboard gives you real-time visibility into what’s working and what needs attention.
In this post, we’ll walk through all 5 pages of the dashboard, explain the KPIs and charts on each, and share how to connect your own data so you’re reporting live numbers within minutes.
Download the Car Customization Firms Dashboard in Power BI →
Why Car Customization Firms Need a Power BI Dashboard
Most car customization businesses still track projects and revenue using spreadsheets, paper logs, or basic invoicing software. These tools capture transactions but don’t surface insights. You can’t easily see which technician has the highest customer satisfaction score, which vehicle brand generates the most profit, or which booking channel brings in the most revenue — not without hours of manual analysis.
Power BI solves this by connecting to your data source (Excel, SQL, SharePoint, or a cloud database) and automatically updating all charts and KPIs when new records are added. The result is a live, self-refreshing dashboard that gives management the same visibility a CFO gets from enterprise BI tools — at a fraction of the cost.
According to Microsoft’s Power BI documentation, Power BI Desktop is free to download and use, making this an accessible tool for businesses of any size.
Dashboard Overview: 5 Pages, One .pbix File
The Car Customization Firms Dashboard in Power BI is structured across 5 report pages, each focusing on a distinct operational area. Every page includes interactive slicers so you can filter by date range, workshop location, service type, or customer type without switching tabs.
Page 1 – Overview
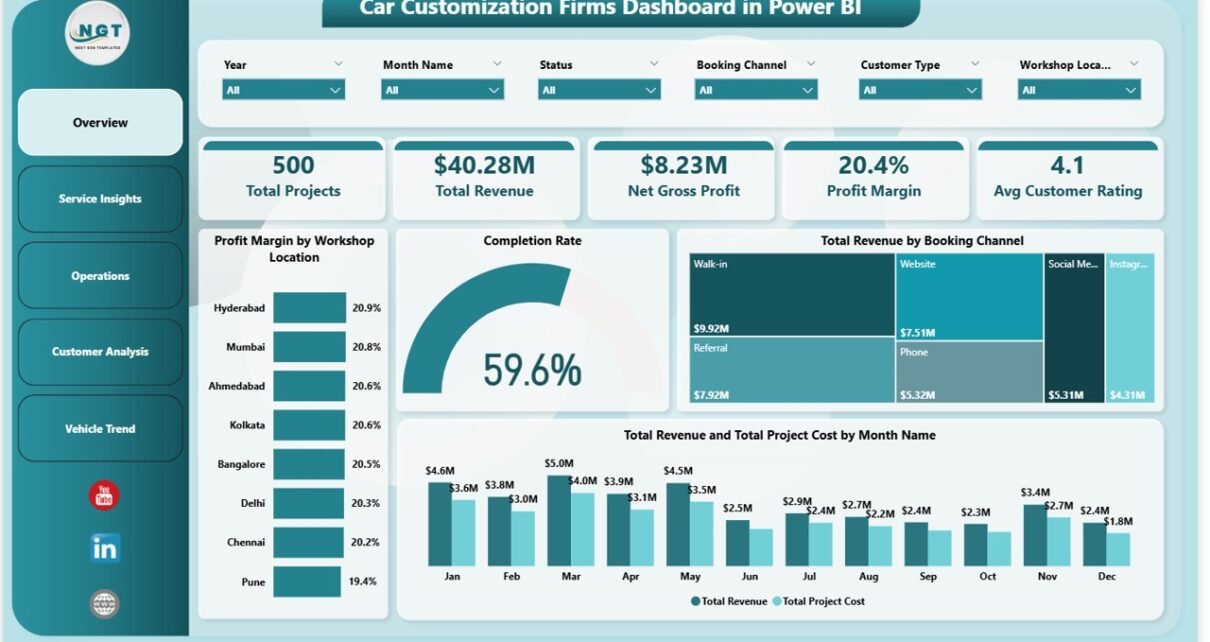
The Overview page is your command center. Five KPI cards at the top show the most critical business metrics at a glance: Total Projects, Total Revenue, Net Gross Profit, Profit Margin, and Avg Customer Rating. Below the cards, four charts provide deeper context:
- Profit Margin by Workshop Location — a bar chart comparing profit margin percentages across your branches, helping you identify which locations are most efficient
- Completion Rate — a gauge chart showing the percentage of projects completed on time, a key operational health indicator
- Total Revenue by Booking Channel — a donut or bar chart revealing which channels (online, walk-in, referral, partner) drive the most revenue
- Total Revenue and Total Project Cost by Month Name — a dual-axis trend chart showing monthly revenue vs cost side by side, making it easy to spot seasonal patterns and margin compression
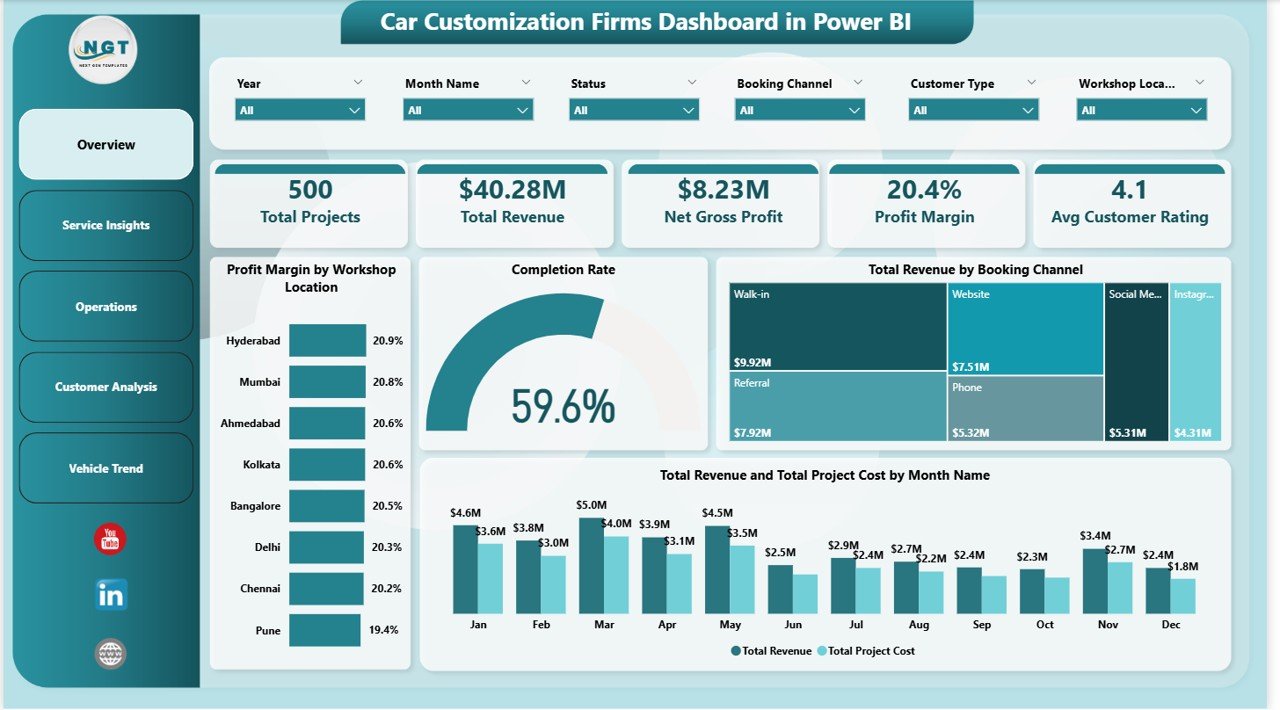 Overview Page — KPI cards, margin by location, revenue by booking channel, and monthly trend
Page 2 – Service Insights
The Service Insights page drills into your revenue mix and customer satisfaction at the service level. This is where you answer questions like: Is vinyl wrapping more profitable than audio installs? Which services do customers rate highest? Three charts drive this analysis:
- Profit Margin by Customization Category — compare margins across service groups (exterior, interior, performance, electronics) to prioritize high-margin offerings
- Total Revenue by Top Five Service Type — a ranked bar chart showing which specific services generate the most revenue, so you can double down on your winners
- Avg Customer Rating by Top Five Service Type — cross-reference revenue with satisfaction to find services that are both profitable and well-received
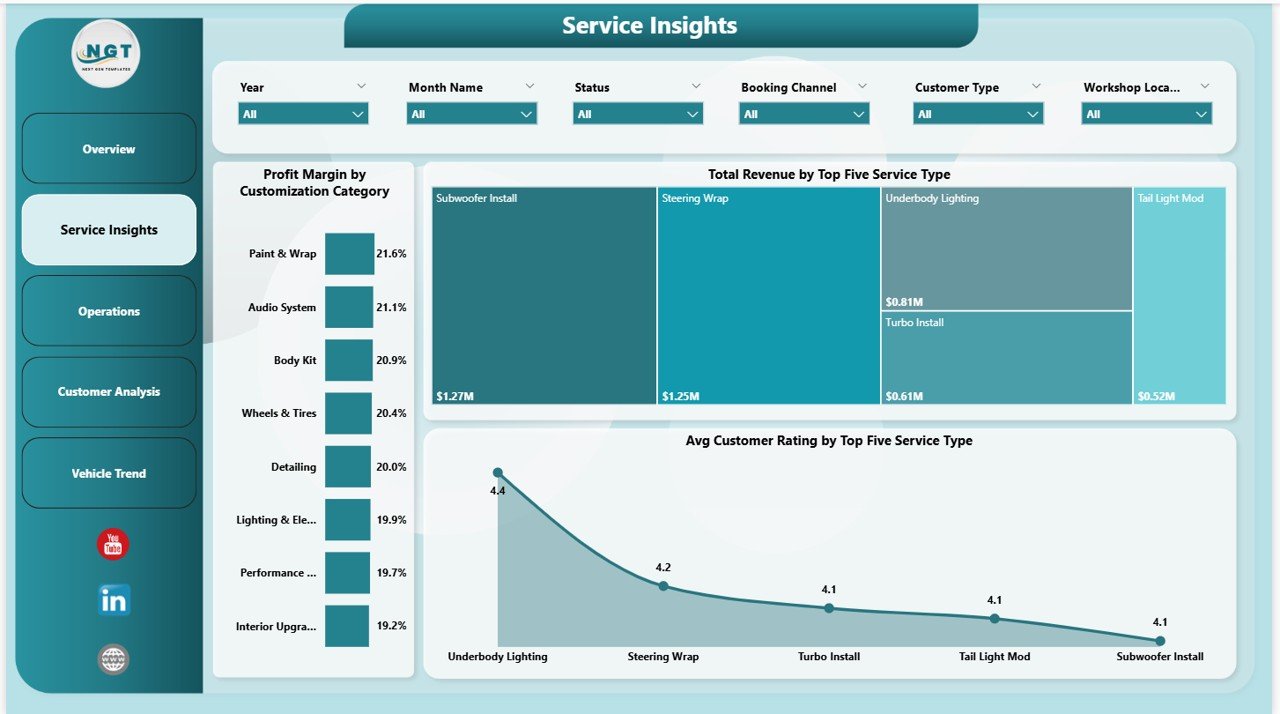 Service Insights Page — Profit margin by category, top services by revenue and customer rating
Page 3 – Operations
The Operations page focuses on workshop efficiency and technician performance — two areas that directly impact both cost and customer experience. Key visuals include:
- Net Gross Profit by Workshop Location — see which branches are most profitable in absolute terms, not just percentage terms
- Total Projects by Status — understand your project pipeline at a glance: how many are completed, in-progress, pending, or cancelled
- Avg Customer Rating by Technician — rank your technicians by customer satisfaction score; use this to reward top performers and identify coaching opportunities
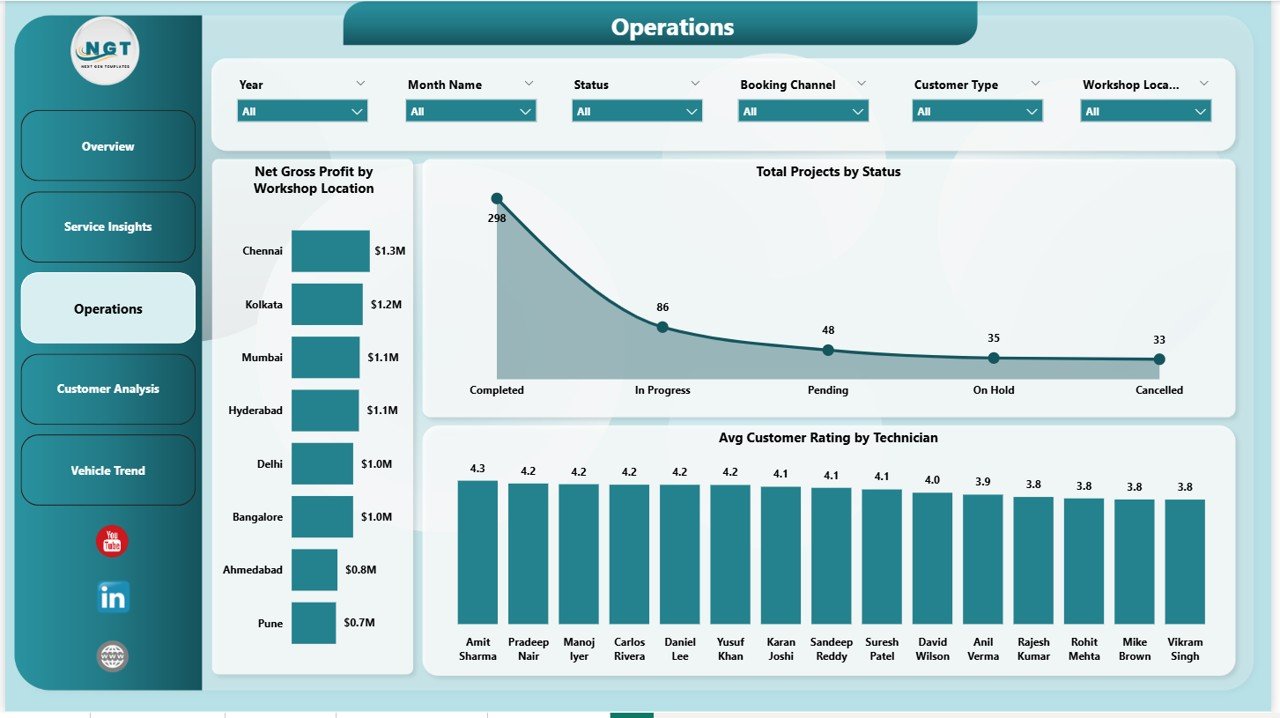 Operations Page — Net profit by location, project status pipeline, technician satisfaction ratings
Page 4 – Customer Analysis
The Customer Analysis page reveals how different customer segments contribute to your business — a critical input for marketing spend and retention strategy. Three visuals provide the breakdown:
- Total Projects by Booking Channel — how customers find and book with you (online platform, walk-in, referral, corporate partnership)
- Avg Customer Rating by Customer Type — do new customers, returning customers, or corporate clients rate you differently? This chart answers that
- Total Revenue by Customer Type — which segment generates the most revenue? Use this to decide where to invest in loyalty programs or targeted acquisition
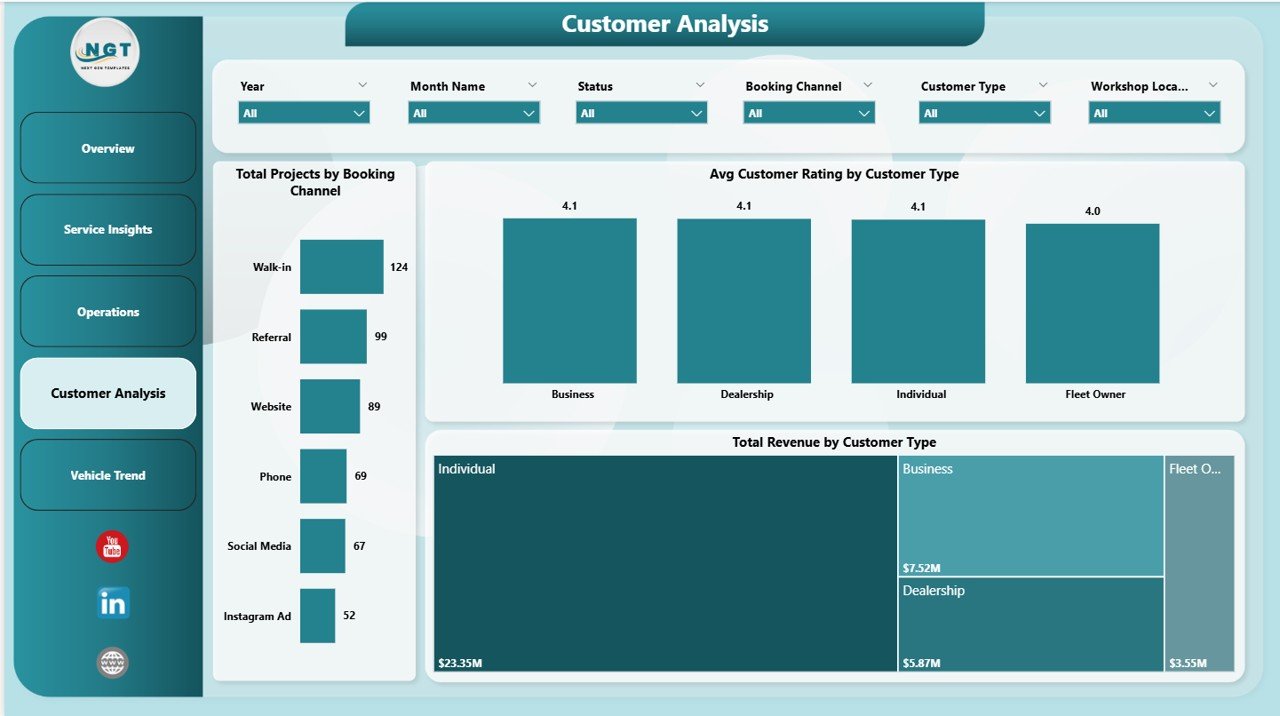 Customer Analysis Page — Booking channels, satisfaction by customer type, revenue by segment
Page 5 – Vehicle Trend
The Vehicle Trend page connects your workload and profitability to specific vehicle brands — a unique insight layer that most workshop software simply doesn’t offer. Three charts complete this view:
- Total Projects by Month Name — visualize demand seasonality across the year; spot your busiest months and plan staffing accordingly
- Profit Margin by Vehicle Brand — which car brands are most profitable to work on? Premium brands may command higher prices but also require more time
- Avg Customer Rating by Vehicle Brand — are owners of certain brands consistently more or less satisfied? This insight can guide technician specialization
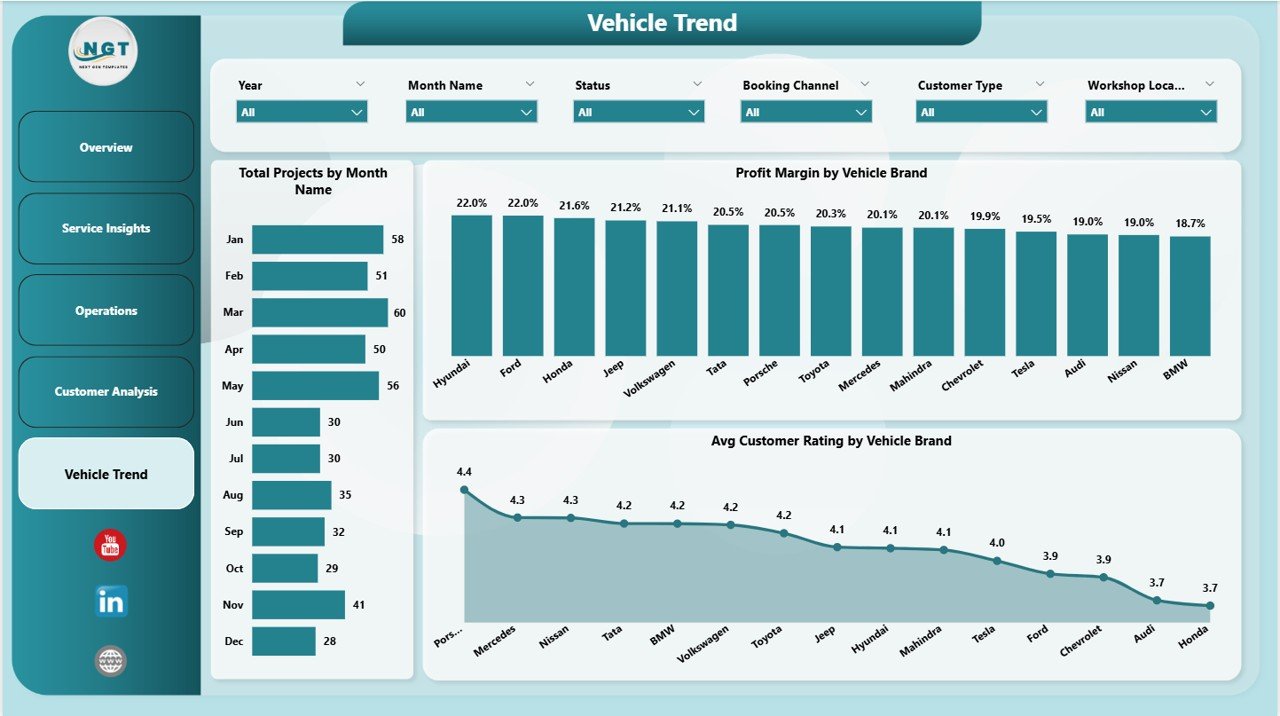 Vehicle Trend Page — Monthly project volume, profit margin by brand, customer rating by vehicle brand
Key Features at a Glance
- 5 interactive Power BI pages: Overview, Service Insights, Operations, Customer Analysis, Vehicle Trend
- 5 KPI cards: Total Projects, Total Revenue, Net Gross Profit, Profit Margin, Avg Customer Rating
- Interactive slicers on every page: date range, location, service type, booking channel, customer type
- Technician performance ranking by Avg Customer Rating
- Vehicle brand profitability and satisfaction analysis
- Month-wise revenue vs cost trend for seasonal planning
- DAX-powered measures that auto-update when data is refreshed
- Professional dark-themed UI optimized for stakeholder presentations
- Compatible with Power BI Desktop (free) — no Pro license required to use or edit
How to Connect Your Data
Getting started takes under 10 minutes:
- Download the .zip file from NextGenTemplates and extract the .pbix file
- Open Power BI Desktop (free download at powerbi.microsoft.com)
- Open the .pbix file — the dashboard loads with sample data so you can explore all 5 pages immediately
- Go to Home → Transform Data → Data Source Settings and point the model to your data file (Excel, CSV, or database)
- Click Refresh — all KPI cards, charts, and slicers update automatically across all 5 pages
- Save and optionally publish to Power BI Service for team access
The underlying data model uses a structured fact table with columns for Project ID, Workshop Location, Technician, Service Type, Customization Category, Booking Channel, Customer Type, Vehicle Brand, Revenue, Project Cost, Status, and Customer Rating. As long as your data matches this structure, the dashboard works out of the box.
Who Should Use This Dashboard?
This dashboard is designed for anyone in a car customization business who makes decisions based on operational data:
- Workshop owners who want a single view of revenue, margin, and customer satisfaction across all branches
- Operations managers monitoring project completion rates and technician performance
- Sales and marketing teams analyzing which booking channels generate the most revenue
- Finance leads tracking monthly revenue vs cost trends and profit margin by service category
- Business analysts building executive reports for stakeholder meetings
Related Dashboards You May Find Useful
If you work across multiple automotive or service-based verticals, explore these related Power BI templates on NextGenTemplates:
- Auto Repair Dashboard in Power BI — track repair orders, labor efficiency, and parts cost
- Car Dealership Dashboard in Power BI — monitor sales pipeline, inventory, and deal margins
- Automotive Parts Manufacturing Dashboard in Power BI — production metrics, defect rates, and line efficiency
Get the Car Customization Firms Dashboard in Power BI
Stop spending hours building reports in spreadsheets. This ready-to-use Power BI dashboard gives your workshop the analytics infrastructure to make faster, more confident decisions — from branch profitability to technician ratings to vehicle brand trends.
Download the Car Customization Firms Dashboard in Power BI →
Questions or need a custom version for your specific workflow? Contact us at support@nextgentemplates.com. For more Power BI tutorials and dashboard walkthroughs, subscribe to @PK-AnExcelExpert on YouTube.