Running a car customization business means juggling dozens of variables at once—service categories, workshop locations, technician performance, vehicle brands, booking channels, and customer satisfaction scores. A generic spreadsheet can’t keep up. The Car Customization Firms Dashboard in Excel was built specifically for this industry: a pivot-driven, slicer-enabled analytics workbook that transforms raw project data into actionable insights across 5 dedicated analysis pages.
Car Customization Firms Dashboard in Excel This template uses native Excel pivot tables—no macros, no VBA, no add-ins. Compatible with Excel 2016, 2019, 2021, and Microsoft 365. After you update the Data Sheet with your records, a single Data → Refresh All brings every KPI, chart, and slicer up to date instantly.
In this post, we walk through every tab of the dashboard, explain the charts and KPIs included, and show you how to get started. You can also download the template directly from NextGenTemplates.
👉 Download Car Customization Firms Dashboard in Excel
Why Excel for Car Customization Analytics?
Most automotive customization businesses track jobs in Excel anyway—job tickets, customer names, service costs, revenue. The challenge is turning that flat data into something you can actually act on. Excel’s pivot table engine is purpose-built for this: once your data is structured, pivot tables can slice it by any dimension (location, technician, vehicle brand, booking channel) and charts update automatically on refresh.
According to Microsoft’s Excel documentation, pivot tables remain one of the most powerful data summarization tools available in the application—and for good reason. When combined with slicers, they become an interactive filtering system that rivals dedicated BI tools for small-to-mid-size businesses.
Dashboard Pages Overview
The dashboard contains 7 sheet tabs: 5 analysis pages, 1 data entry sheet, and 1 support sheet housing all pivot tables. Here’s what each page covers.
Page 1: Overview
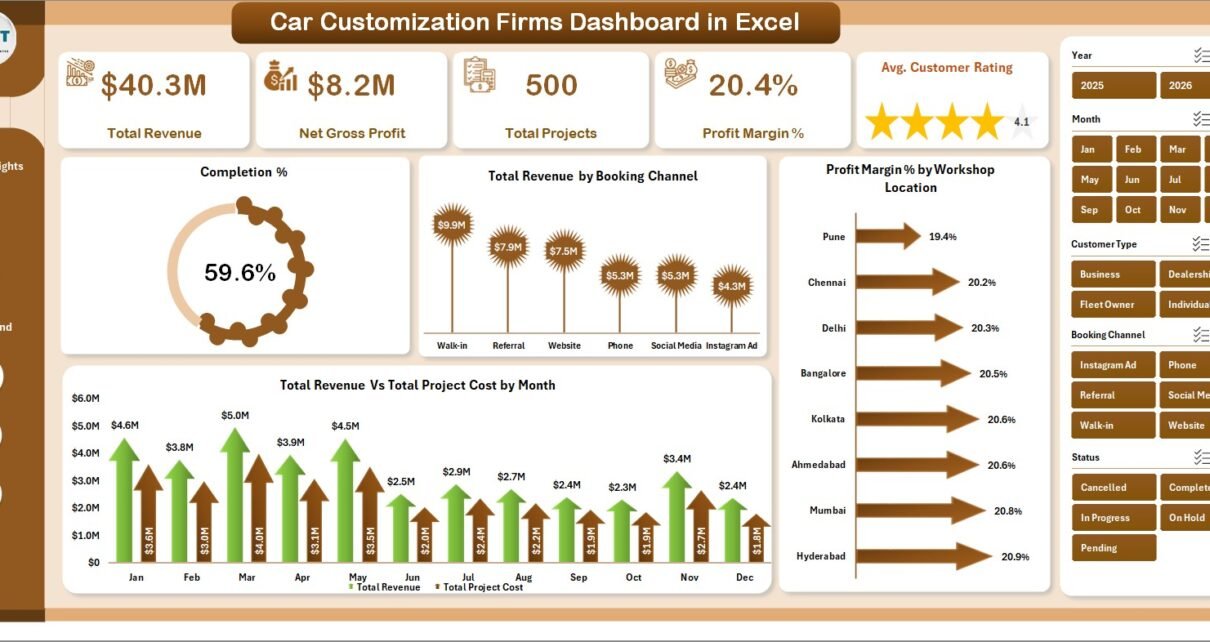
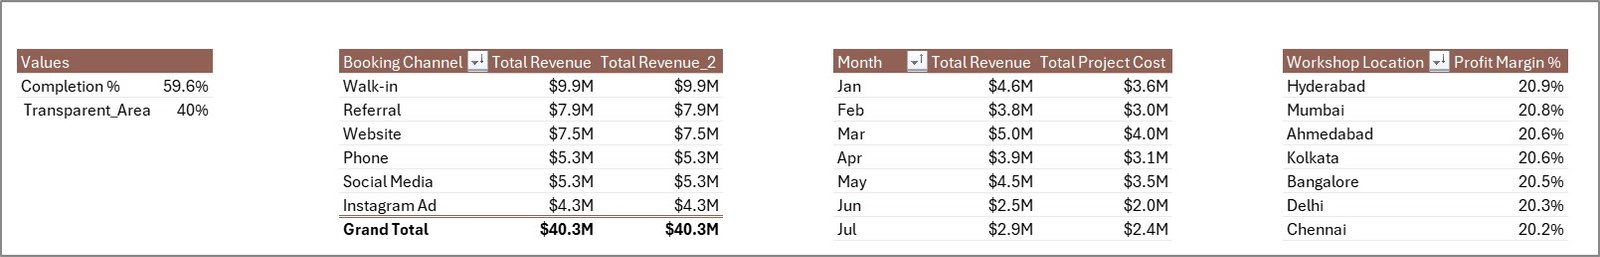
The Overview page is your command center. It shows the 5 most important business KPIs at the top, followed by 4 charts that cover revenue, profitability, and project trends. Slicers let you filter the entire page by booking channel, workshop location, or time period without touching a single formula.
KPI Cards
- Total Revenue – Aggregate income from all completed and in-progress customization projects
- Net Gross Profit – Revenue minus total project cost, giving your actual profitability figure
- Total Projects – Count of all service orders in the dataset
- Profit Margin % – Net Gross Profit divided by Total Revenue, expressed as a percentage
- Avg. Customer Rating – Mean satisfaction score across all rated projects
Charts
- Completion % – Progress-style chart showing completed vs. open or pending projects
- Total Revenue by Booking Channel – Compares walk-in, referral, online, and other channels by revenue
- Profit Margin % by Workshop Location – Bar chart identifying your highest and lowest-margin workshops
- Total Revenue vs. Total Project Cost by Month – Dual-line trend chart for cash flow visibility
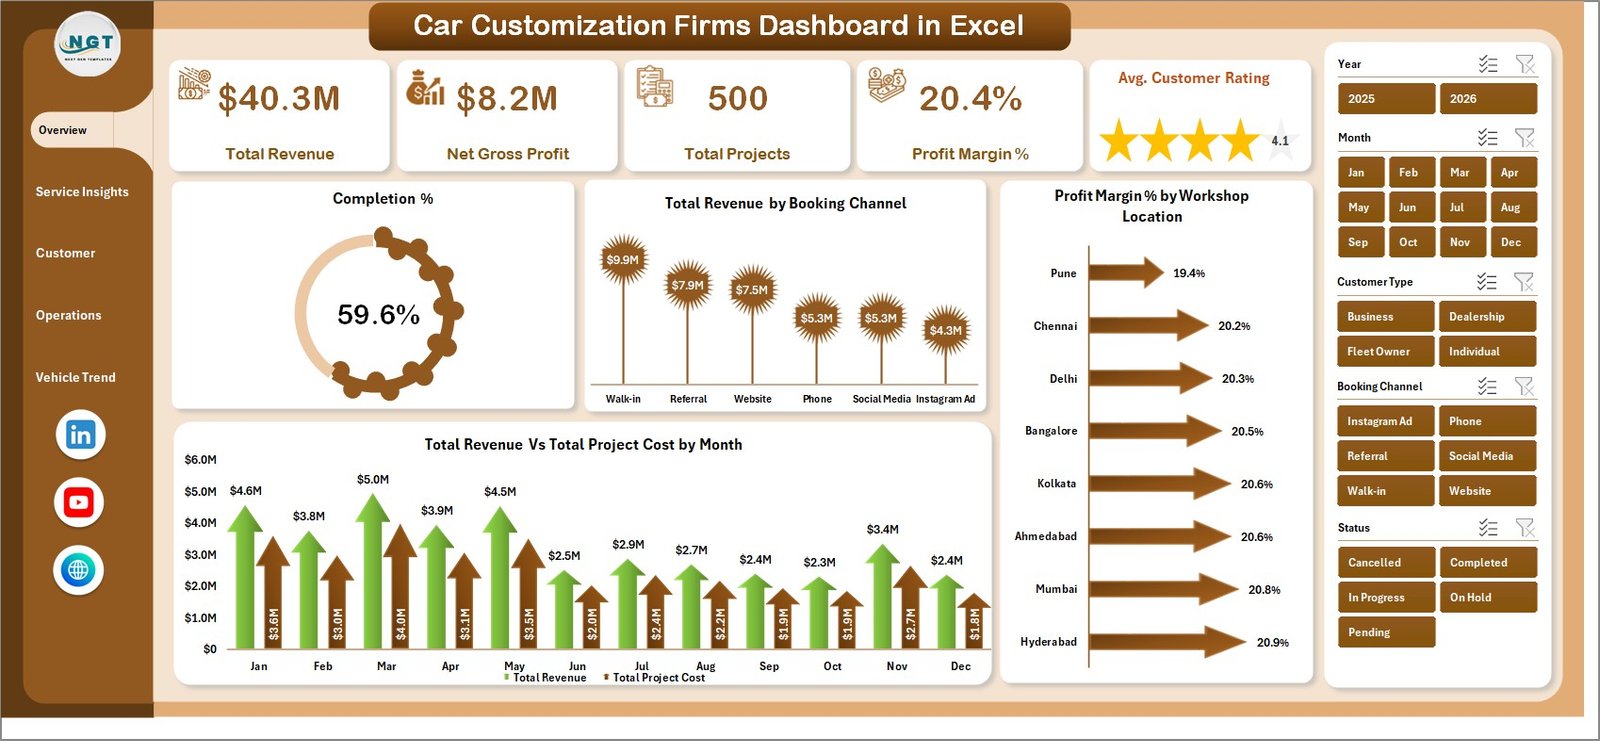 Overview Page – KPI Cards, Revenue Trends & Booking Channel Analysis
Page 2: Service Insights
The Service Insights tab helps you understand which services and customization categories are generating the most revenue and the best margins. If you’re thinking about expanding a service line or discontinuing one, this page gives you the data to back that decision.
- Total Revenue by Customization Category – Ranks wraps, interior, performance tuning, detailing, and other categories by revenue
- Total Revenue by Top 5 Service Type – Highlights your 5 highest-revenue individual services
- Avg. Customer Rating by Top 5 Service Type – Shows which specific services earn the best customer scores
- Profit Margin % by Customization Category – Reveals margin differences between service categories, helping you focus on what’s actually profitable
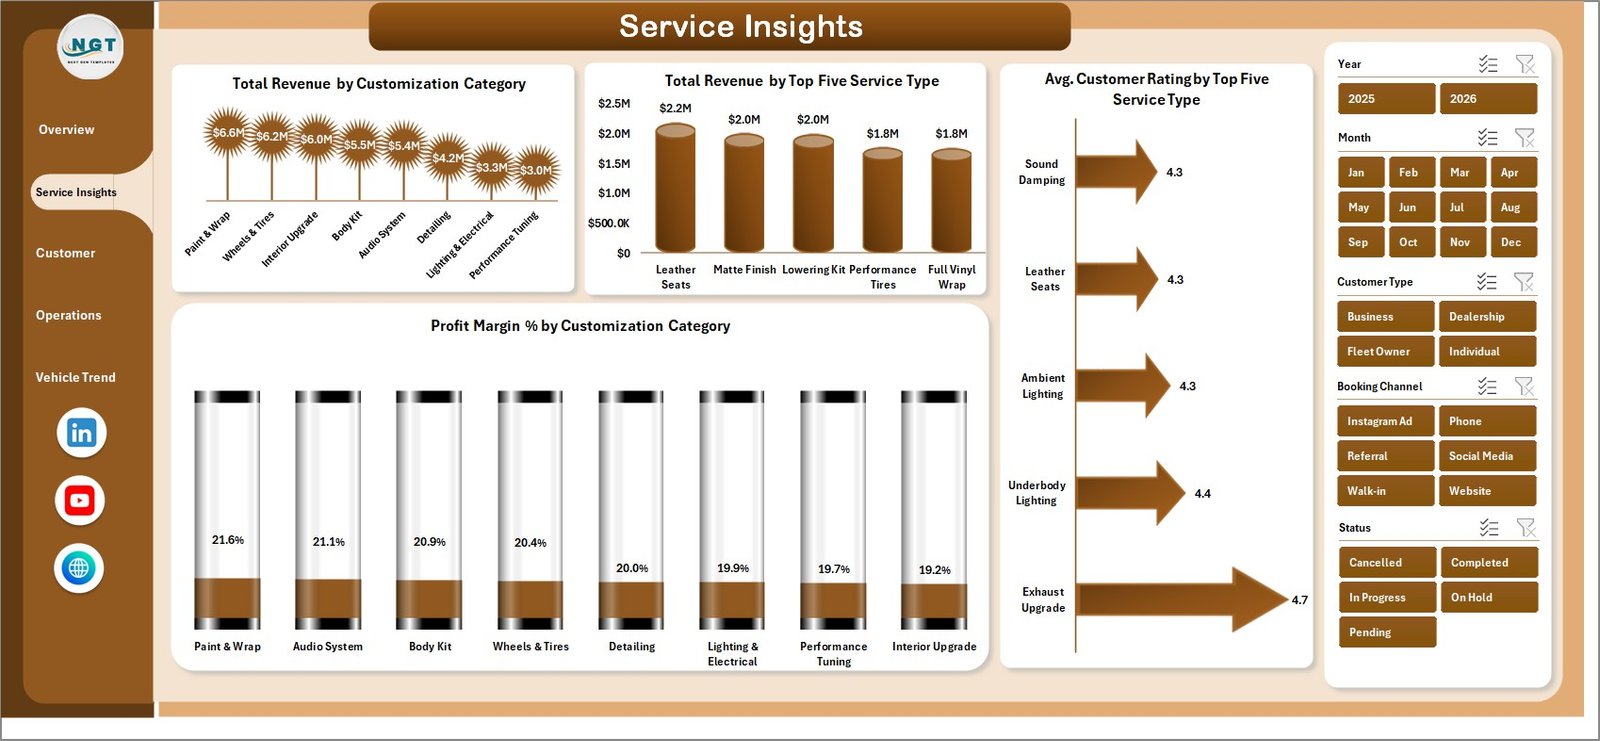 Service Insights – Revenue and Margin by Customization Category & Service Type
Page 3: Customer Analysis
Understanding who your customers are and how they pay shapes your marketing spend and payment infrastructure. The Customer Analysis page segments all revenue and project data by customer type, payment method, and booking channel.
- Total Revenue by Customer Type – New, returning, and corporate client revenue comparison
- Avg. Customer Rating by Customer Type – Shows whether certain client segments are harder or easier to satisfy
- Total Revenue by Payment Method – Cash, card, EMI, and online payment method revenue breakdown
- Total Projects by Booking Channel – Volume of projects by acquisition source
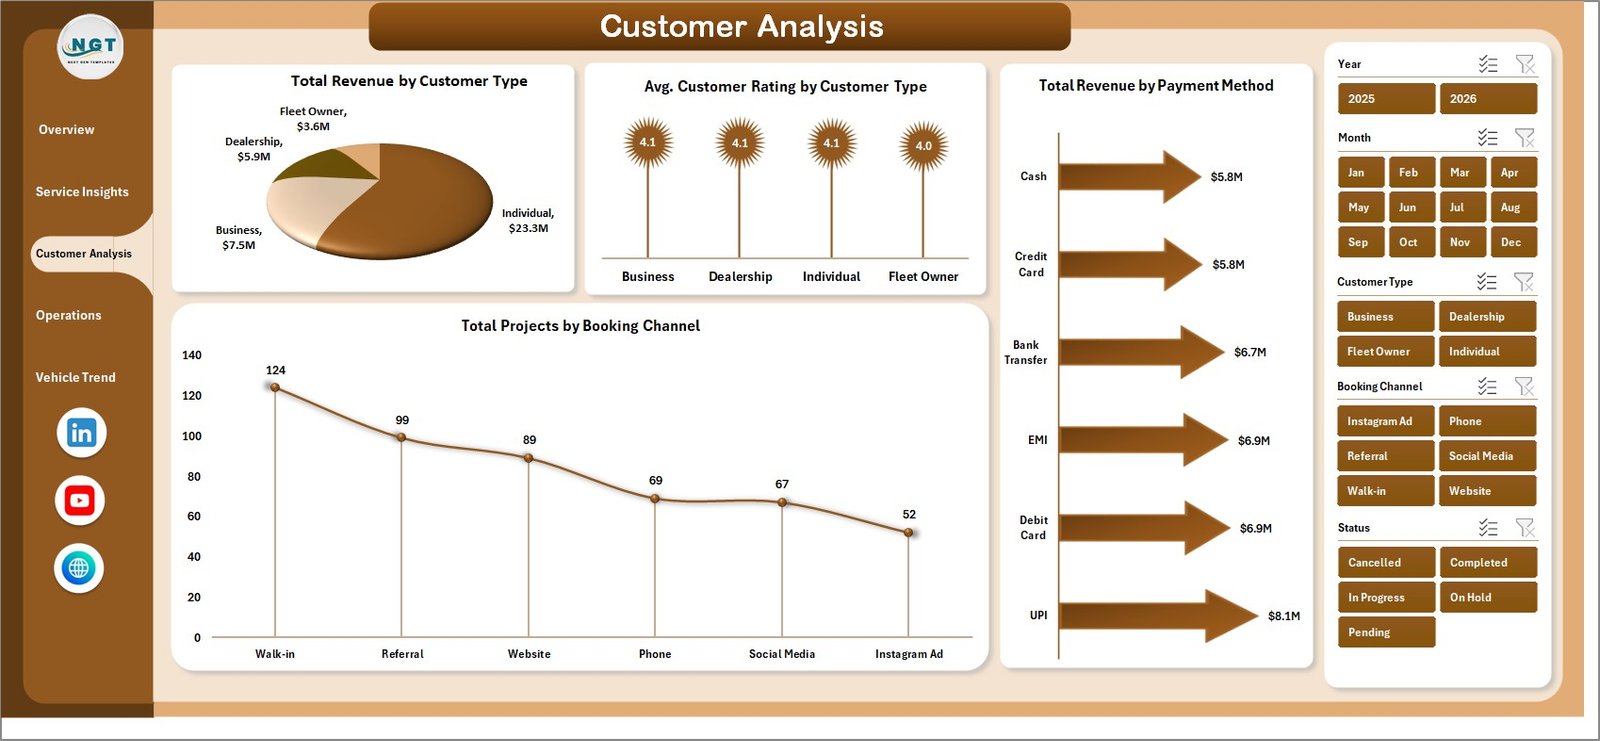 Customer Analysis – Segmentation by Customer Type, Payment Method & Booking Channel
Page 4: Operations
The Operations page focuses on internal performance: technician ratings, project status, and location-level profitability. Use it to reward top performers, manage project backlog, and decide where to invest in capacity.
- Total Project Cost by Booking Channel – Identifies which acquisition channels carry the highest service delivery costs
- Avg. Customer Rating by Top 5 Technician – Ranks your best technicians by customer satisfaction score
- Total Projects by Status – Completed, in-progress, and pending project count breakdown
- Net Gross Profit by Workshop Location – Location-level profitability to guide resource allocation
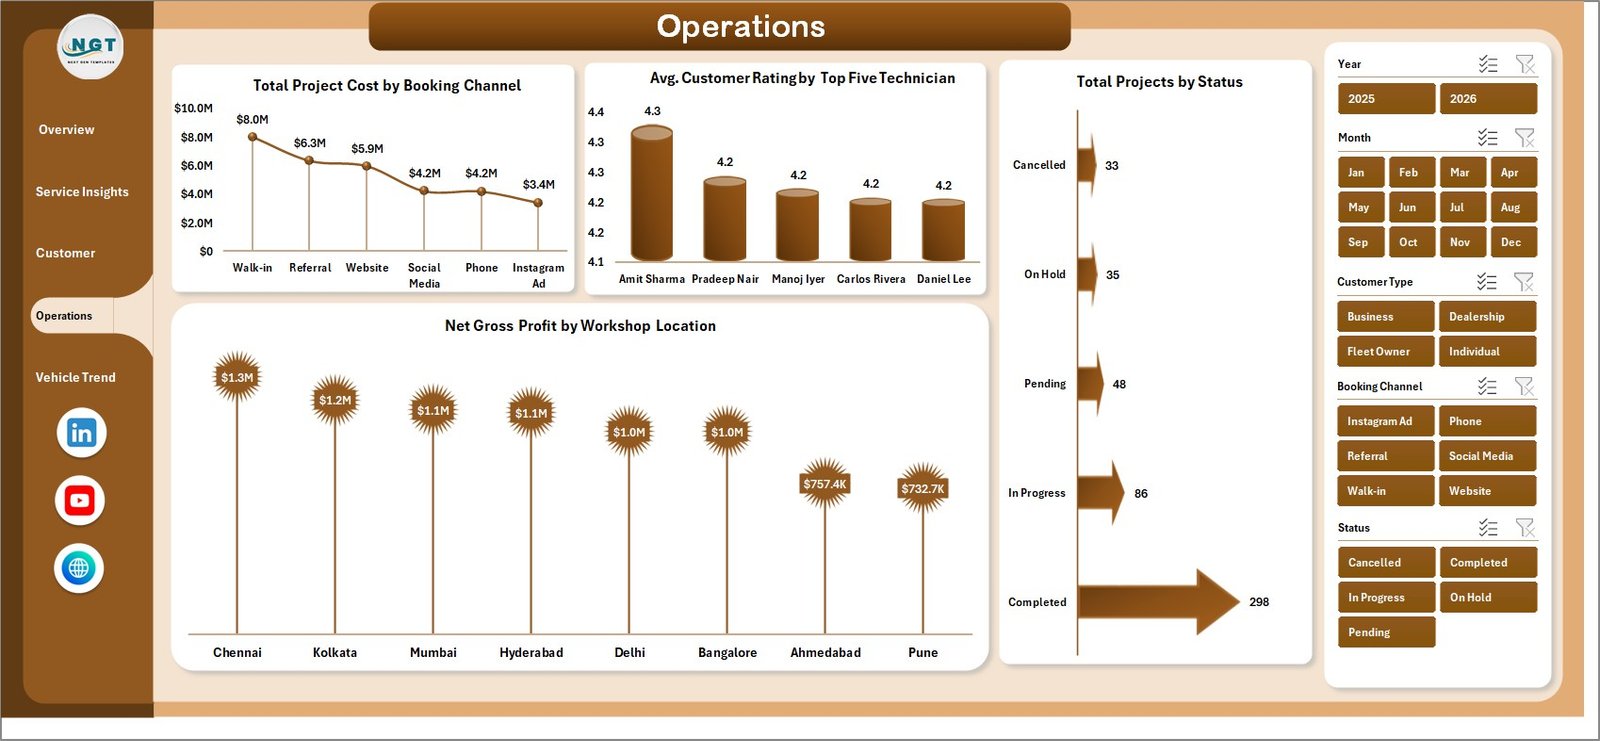 Operations – Technician Performance, Project Status & Location Profitability
Page 5: Vehicle Trend
The Vehicle Trend tab is unique to this dashboard. It analyzes your business performance through the lens of the vehicles themselves: which brands are serviced most, which generate the highest margins, and how revenue trends shift by year and month.
- Total Revenue by Year – Annual revenue trend for YoY growth tracking
- Profit Margin % by Top 5 Vehicle Brand – Margin comparison across your most serviced vehicle brands
- Total Revenue by Month – Monthly seasonality chart for staffing and inventory planning
- Avg. Customer Rating by Top 5 Vehicle Brand – Which vehicle brands are associated with the highest satisfaction
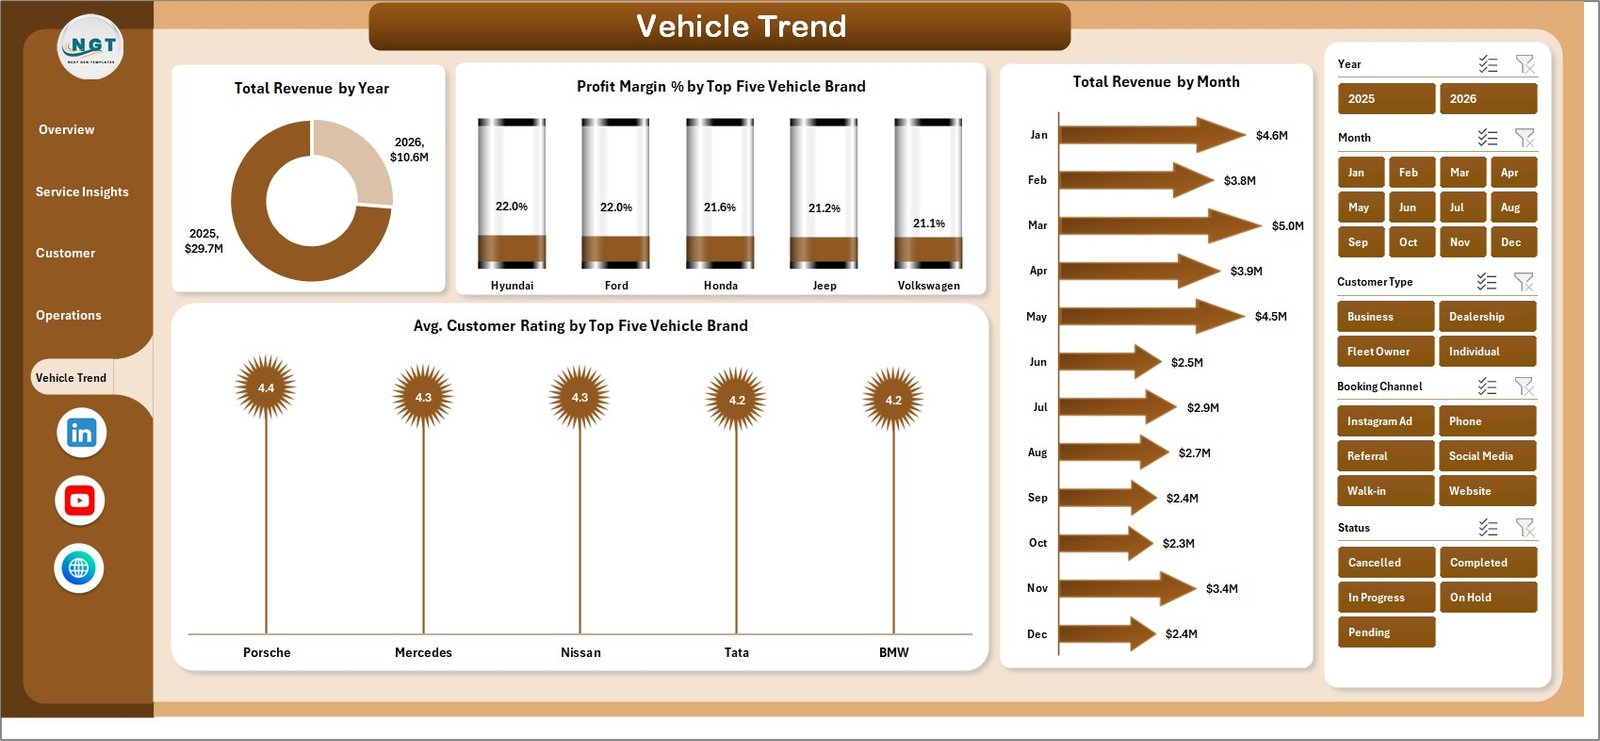 Vehicle Trend – Revenue, Margin & Ratings by Vehicle Brand, Year & Month
Page 6: Data Sheet
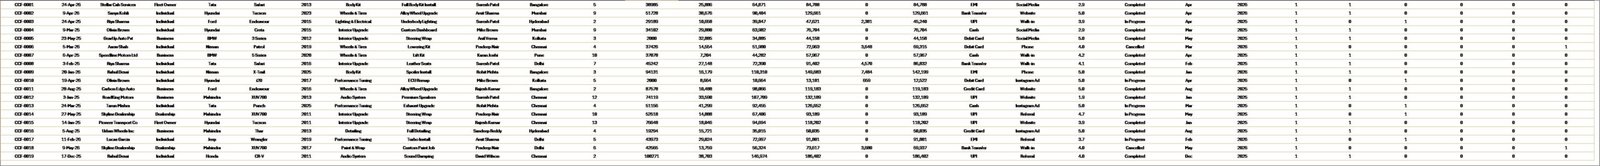
All your project records go into the Data Sheet. Each row is one job/service order. The columns map to the dimensions used across all 5 dashboard pages: customer type, service type, customization category, vehicle brand, workshop location, booking channel, payment method, technician, status, revenue, and cost fields.
The sample data included with the template shows you the exact format required. Replace it with your own records, then hit Data → Refresh All.
 Data Sheet – Structured Input Table for All Project Records
Page 7: Support Sheet
The Support Sheet holds all the pivot tables that power the dashboard. You don’t need to edit anything here—just be aware it exists. After updating the Data Sheet, go to Data → Refresh All in the Excel Ribbon. All pivots refresh simultaneously, and every chart and KPI card updates. You can hide this sheet once you’re familiar with the file.
 Support Sheet – Pivot Tables Powering the Entire Dashboard
How to Get Started
- Download the file from NextGenTemplates and open it in Excel 2016 or later
- Enable editing if prompted (Protected View)
- Go to the Data Sheet and replace the sample data with your own project records in the same column structure
- Click Data → Refresh All in the Excel Ribbon
- Use the slicers on each page to filter by any dimension
- Hide the Support Sheet if you want a cleaner view for day-to-day use
Key Features at a Glance
- ✅ 5 analytics pages: Overview, Service Insights, Customer Analysis, Operations, Vehicle Trend
- ✅ 20+ charts covering revenue, profit, ratings, and project metrics
- ✅ Interactive slicers for instant multi-dimensional filtering
- ✅ Pivot-driven: one-click Data → Refresh All updates everything
- ✅ No macros or VBA required
- ✅ Compatible with Excel 2016, 2019, 2021, and Microsoft 365
- ✅ Sample data included for immediate reference
Who Is This Dashboard For?
This template is designed for:
- Car customization workshops and detailing studios
- Vehicle wrapping and paint protection businesses
- Performance modification and tuning shops
- Auto accessory retailers with installation services
- Multi-location automotive service operators tracking profitability by branch
- Business analysts supporting automotive service businesses
Related Excel Dashboard Templates
Looking for similar analytics templates? Check out these related dashboards from NextGenTemplates:
- Auto Repair Dashboard in Excel
- Autonomous Vehicles Dashboard in Excel
- Car Dealership Dashboard in Google Sheets
- Fleet Management Dashboard in Google Sheets
Browse the full Excel Dashboard collection on NextGenTemplates for hundreds more industry-specific analytics templates.
Video Tutorial
PK has created extensive Excel dashboard tutorials on the @PK-AnExcelExpert YouTube channel covering pivot tables, slicers, and dashboard design in Excel. Subscribe to stay updated when a walkthrough video for this template is published.
Frequently Asked Questions
Does this dashboard require macros or VBA?
No. The entire dashboard is built with native Excel pivot tables and slicers. You don’t need to enable macros or know any VBA to use it.
Can I add more rows of data?
Yes. Add rows in the Data Sheet in the same column format as the sample data, then click Data → Refresh All to update the dashboard.
What Excel versions are supported?
The template works with Excel 2016, 2019, 2021, and Microsoft 365 on both Windows and Mac.
Can I customize the workshop locations, service categories, or vehicle brands?
Yes. Just enter your own values in the data rows. The pivot tables automatically pick up new values after a refresh.
Can I use this for multiple branches?
Yes. The Operations tab includes a Net Gross Profit by Workshop Location chart, and slicers allow you to isolate any single location across all dashboard pages.
👉 Download the Car Customization Firms Dashboard in Excel
👉 YouTube.com/@NextGenTemplates