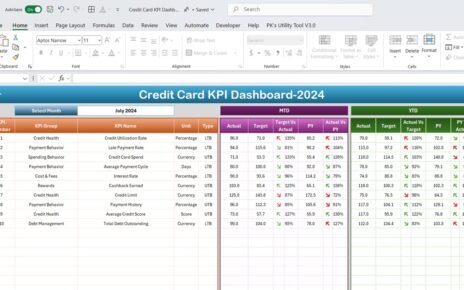
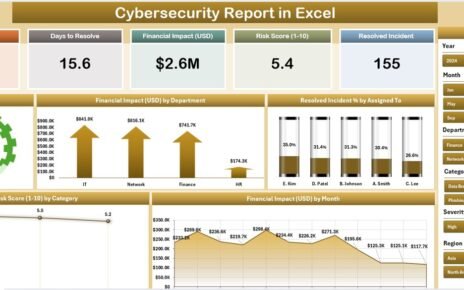
A 12-row sales table still leaves the same question open: are we on target or not? A speedometer answers it at a glance. In this tutorial you build a speedometer chart in Excel step by step: a doughnut dial with red, amber and green zones, a pie chart needle, a month drop down, a pack of four KPI gauges and a year to date progress ring. No add-ins and no macros. The example is Summit Ridge Outdoor Co. in Denver, Colorado.

⬇️ Join Free on Skool & Download the Practice File
Free membership · takes 1 minute · the file is in Classroom → Free Downloads from YouTube on Next Gen Templates. For a full KPI dashboard, look at the Sporting Goods KPI Dashboard in Excel. To learn dashboards in depth, join the Excel Pivot Tables & Dashboards: Basic to Advanced course.
More gauge tutorials: RYG dial gauge meter, rating meter chart and the animated speedometer with VBA.
Frequently Asked Questions
How do you make a speedometer chart in Excel?
Combine two charts: a doughnut chart with a hidden bottom half for the coloured dial, and a pie chart with one thin slice on the secondary axis for the needle. Both must add up to the same total, here 240.
Why must the dial and the needle both total 240?
The dial is 80 + 15 + 25 + 120 = 240, where the 120 is the hidden bottom half. The needle pie is the needle position + 1 + the rest of the circle, so it also adds up to 240. If the totals differ, the needle points to the wrong place.
How do I keep the needle on the dial when sales beat 120 percent?
Wrap the position in MIN and MAX: =IF($G$9="",0,MIN(MAX($G$9*100,0),119)). The needle stops at the edge of the dial instead of disappearing into the hidden half.
How do I chart a KPI where lower is better, such as return rate?
Flip the division. For higher-is-better KPIs use actual / target, for lower-is-better use target / actual, so a return rate of 6.2% against a 5.0% target shows 81 percent and the needle stays in the warning zone.
Does this work without macros or add-ins?
Yes. It uses only a doughnut chart, a pie chart and ordinary formulas, and works in Excel 2016 and every later version.
How do I copy the gauge for several KPIs?
Copy the finished chart, paste it once per KPI, then use Select Data to point the Dial series at the zone cells and the Needle series at that KPI's own row.
Is the practice file free?
Yes. The zip has the Practice and Solution workbooks for a fictional outdoor gear retailer. All names and numbers are example data for learning.
Download the Free Practice Files
⬇️ Join Free on Skool & Download the Practice File
Free membership · takes 1 minute · the file is in Classroom → Free Downloads from YouTube
Practice + Solution workbooks · speedometer chart · .zip · Excel 365 / 2021 / 2019 / 2016
By PK, An Excel Expert. The business and numbers are fictional example data for learning.
Conclusion
A speedometer chart needs only a doughnut, a pie and formulas that keep both at 240. Download the free files, build along with the video and compare with the Solution file if you get stuck.