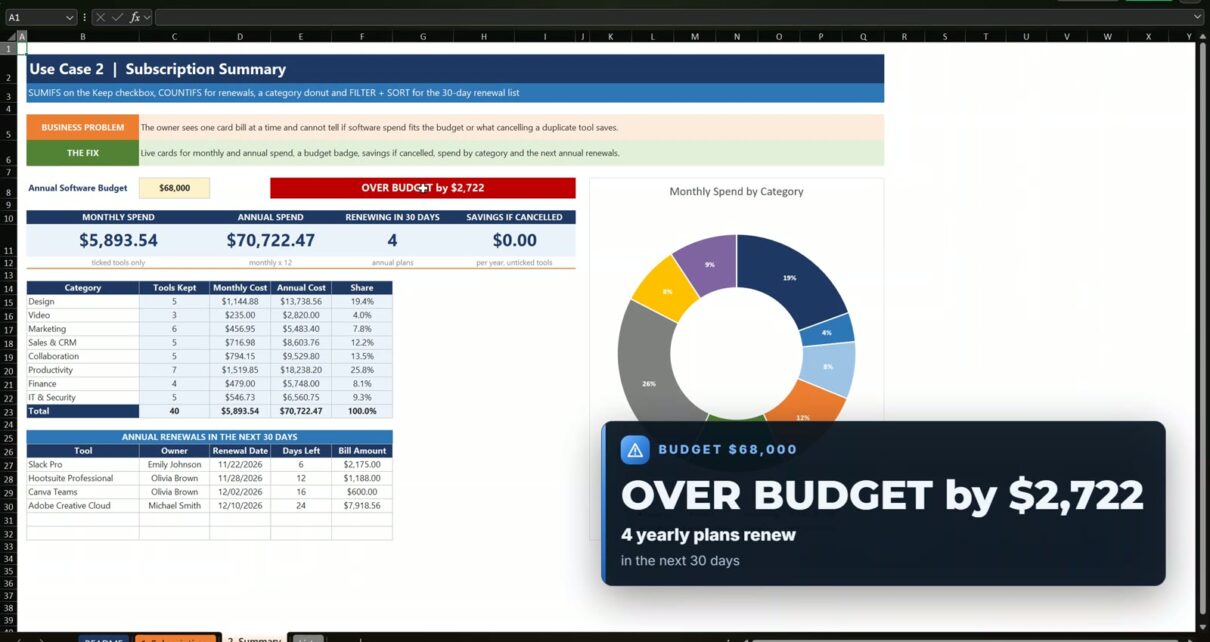
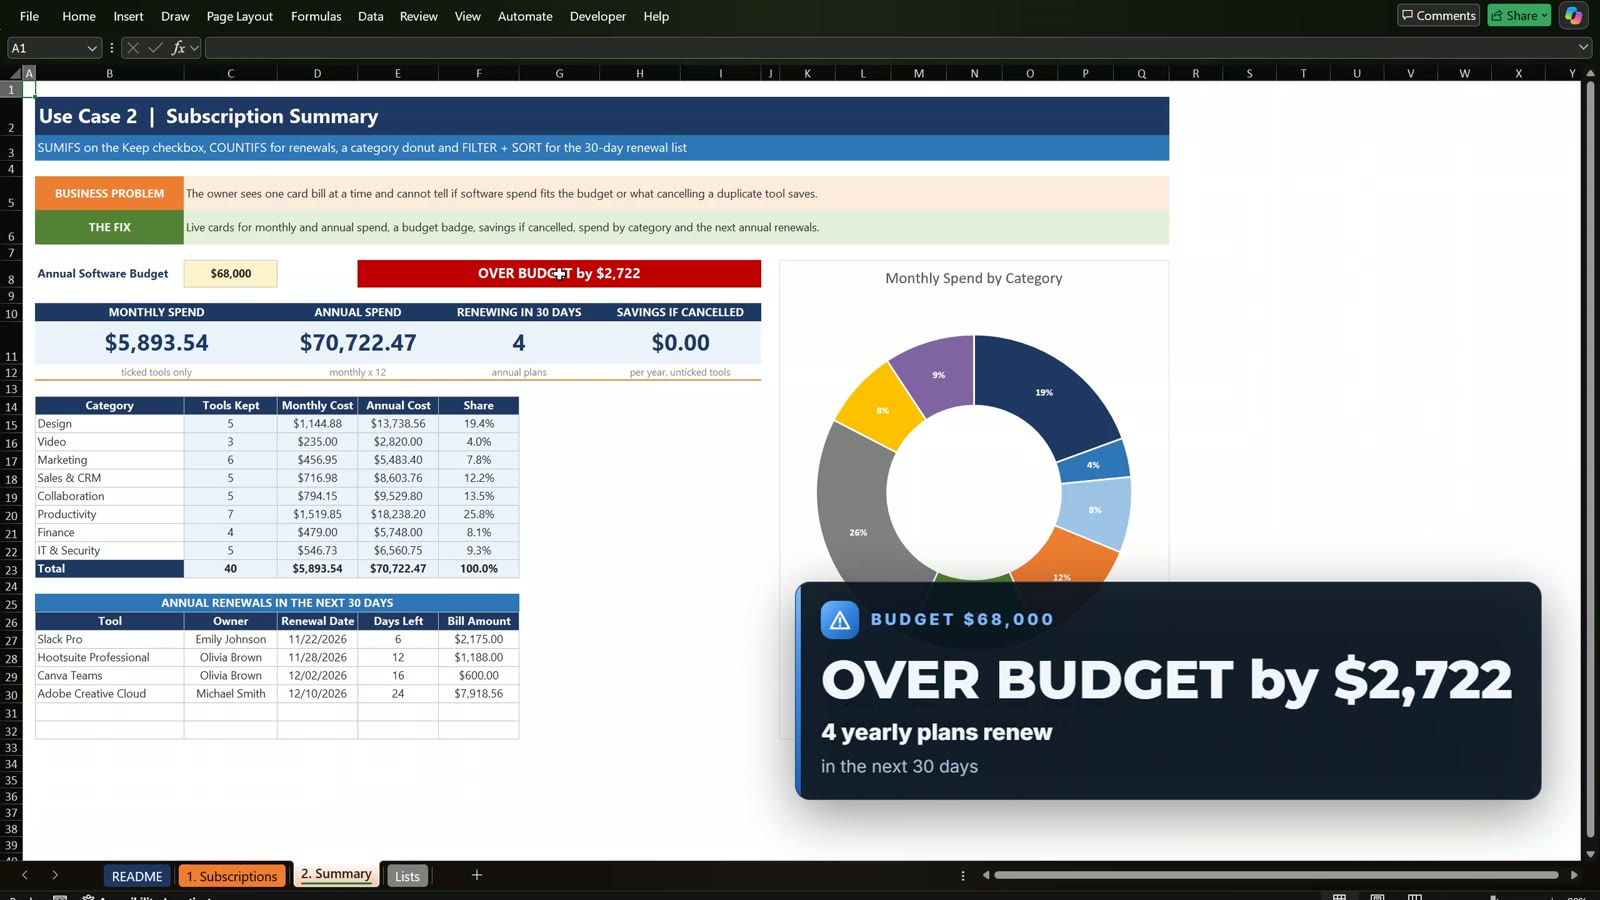
Software subscriptions pile up quietly: a few tools pay twice for the same job, and a yearly plan can renew before anyone notices. In this tutorial you build a business subscription tracker in Excel that shows the real monthly and yearly cost of every tool, warns you 30 days before an annual plan renews, and shows how much you save when you cancel something. The example is Brightline Creative LLC, a 25-person design agency in Austin, Texas, with 40 software tools: $5,893.54 a month, $70,722.47 a year against a $68,000 budget, so the badge says over budget by $2,722.
⬇️ Download the Free Practice Files
Practice file + solution workbook · .zip · Excel 365 recommended
Watch the Video Tutorial
Video Overview
The video opens with the finished file. Untick Canva Teams, a tool the agency already covers with Adobe and Figma, and its alert turns red and says Cancel, it leaves the renewal list and the savings card shows $600 a year. Then you build everything from the practice file in eleven steps, and finish by cancelling three duplicate tools, which turns the badge green: within budget with $1,070 to spare.
What You Will Build
- Keep checkboxes so you can test a cancellation with one click.
- Monthly and annual cost for every tool in the same unit.
- A 30-day renewal alert with red, orange and green colors.
- Summary cards and a budget badge that turns red or green.
- A category table with a doughnut chart and a renewal list from one formula.
The Practice File
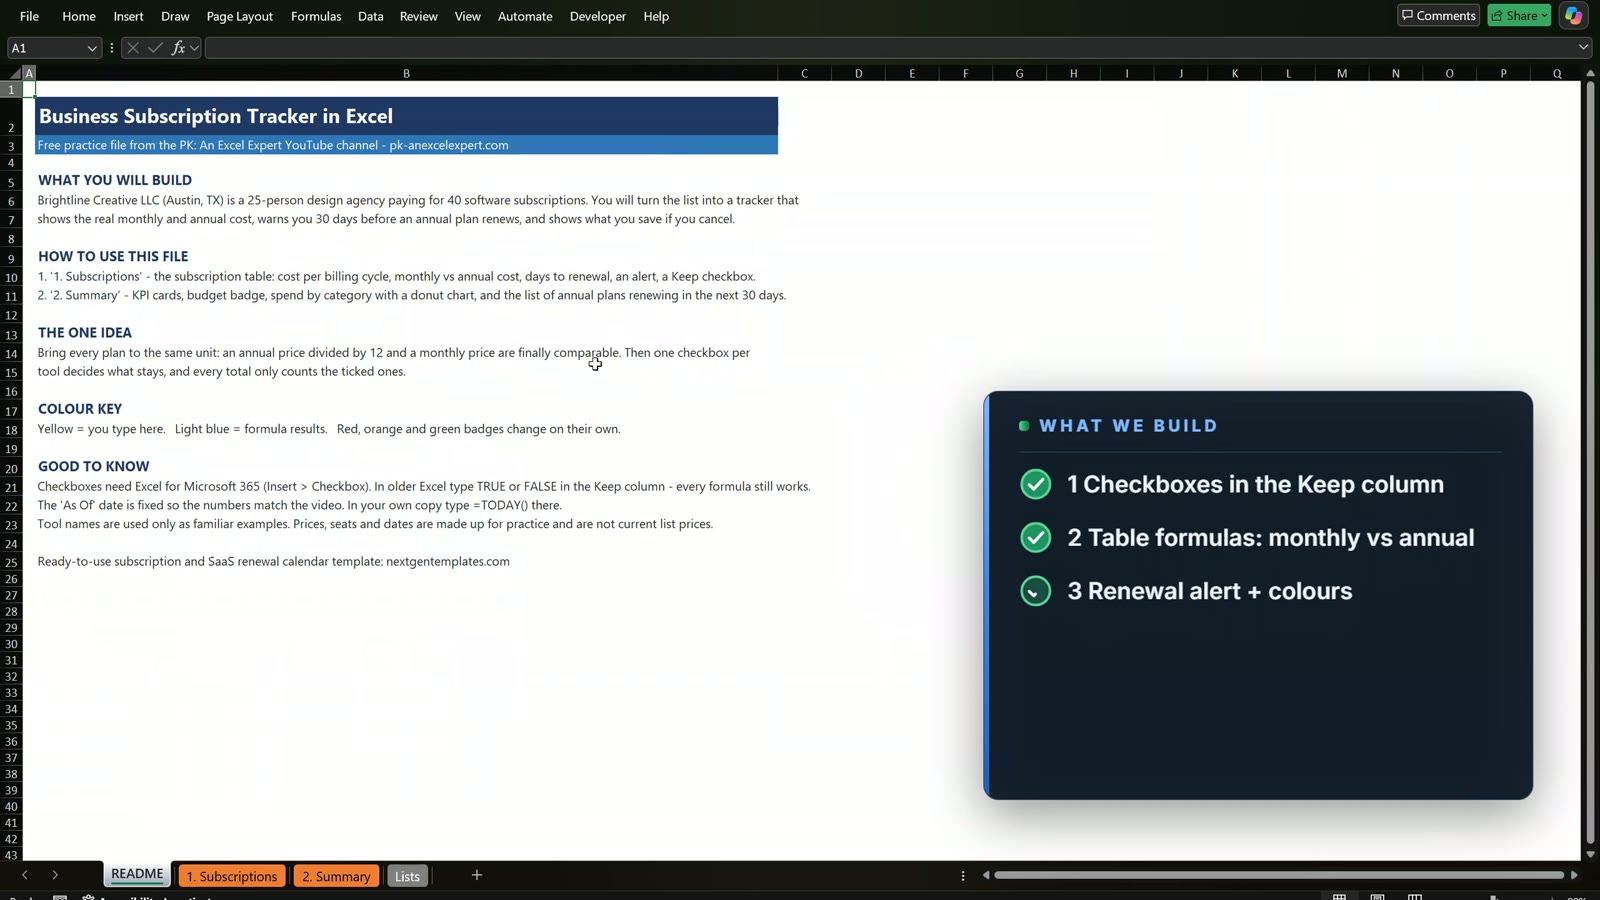
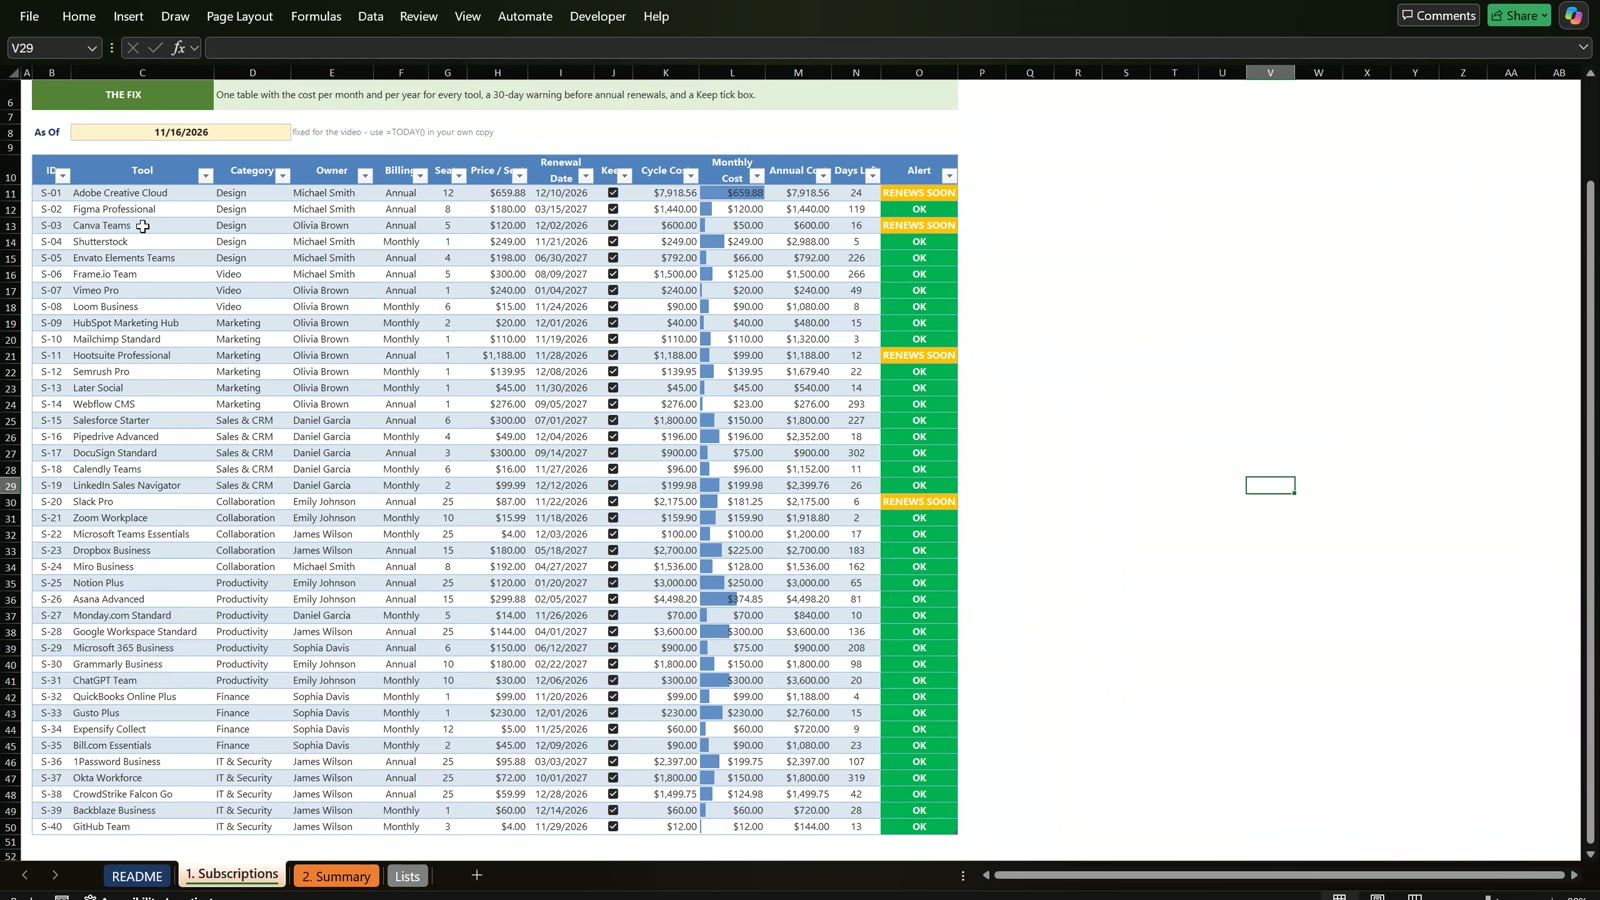
The Practice file has a README tab, a Subscriptions tab with the register, a Summary tab and a Lists tab for the drop-downs. The register is already an Excel table, so every formula you type in the first row fills down by itself. One problem: the price per seat is for one billing cycle, per month for a monthly plan and per year for an annual plan, so you cannot add the column up before you bring every tool to the same unit.
Step 1: Checkboxes for the Keep Column
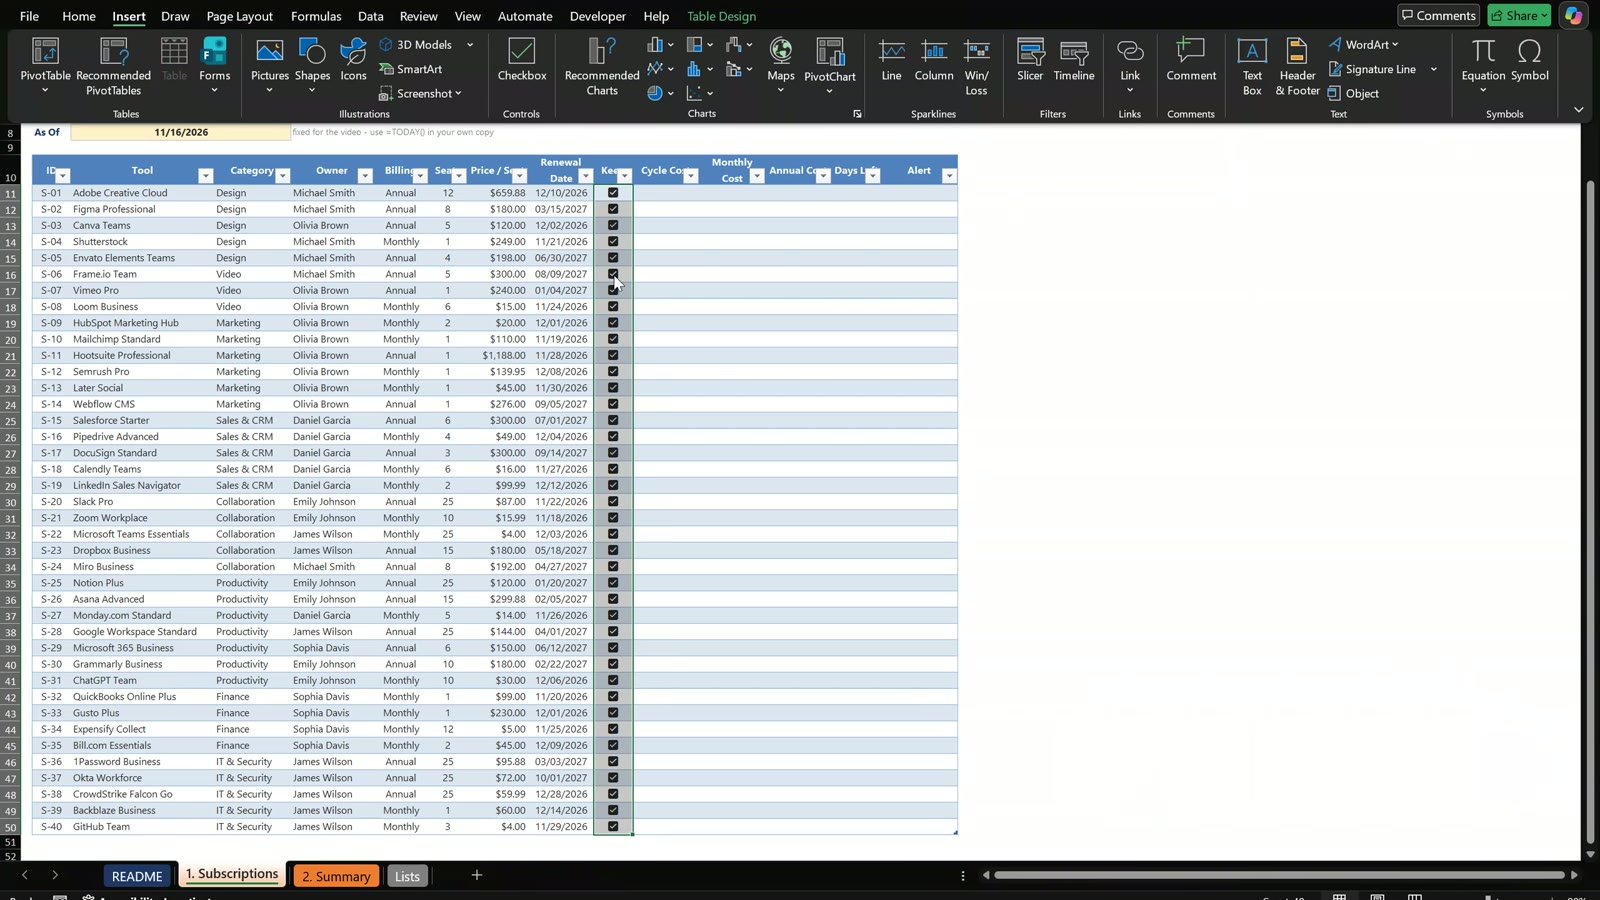
Select the Keep column, go to Insert and click Checkbox. Every TRUE becomes a ticked box: ticked means keep the tool, empty means cancel it. Checkboxes need Microsoft 365; in an older version just type TRUE or FALSE.
Steps 2 to 5: The Cost Columns and Days Left
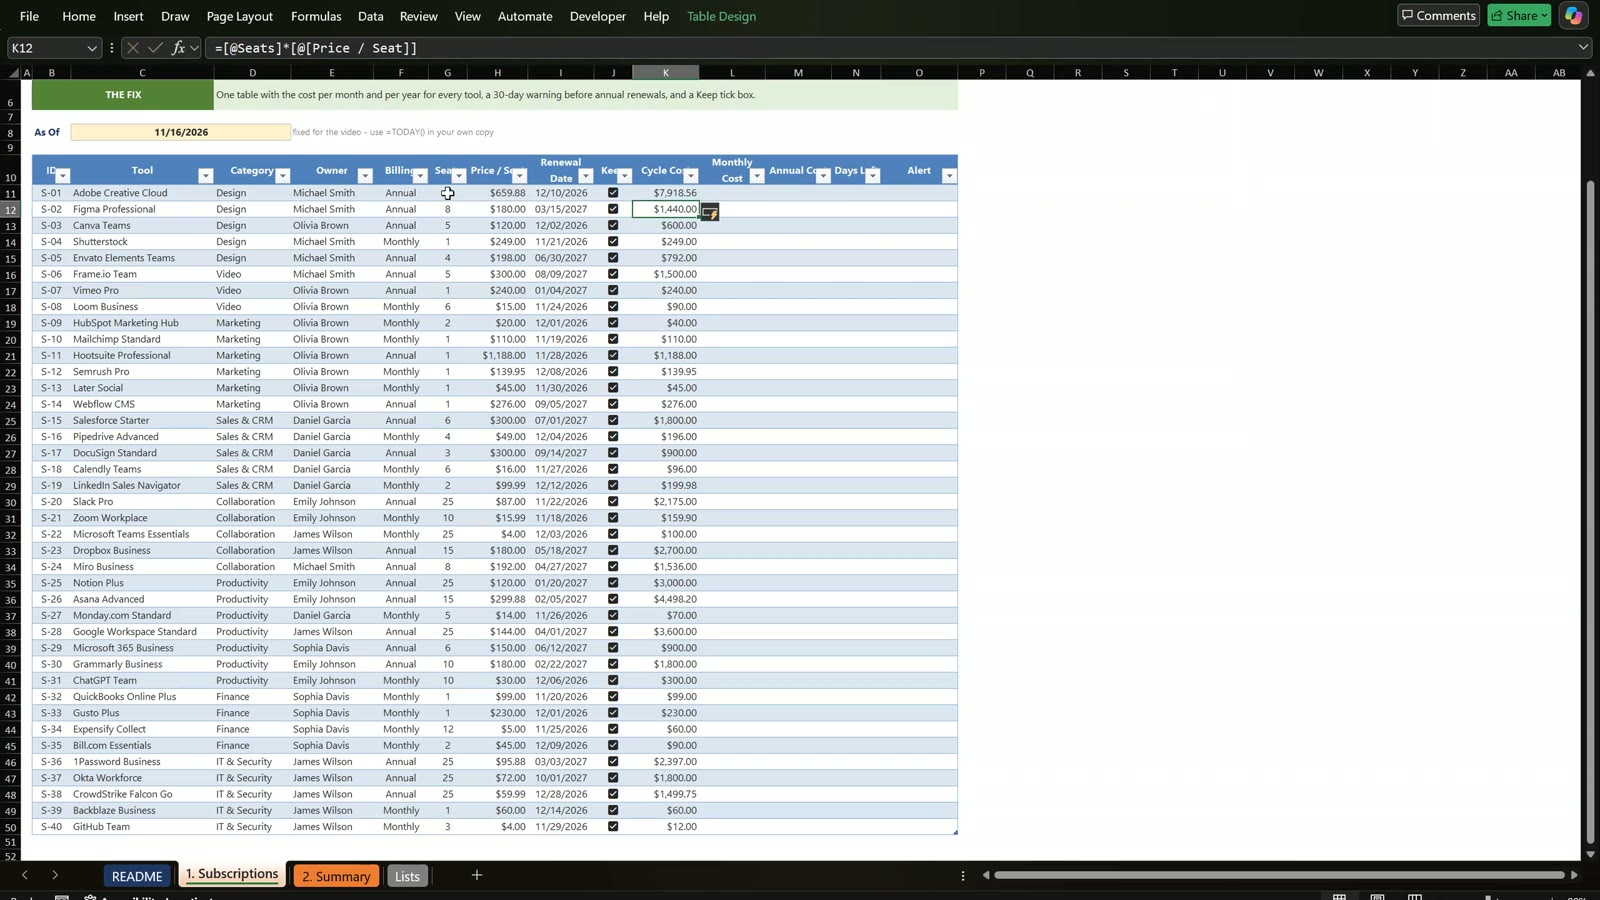
Type each formula in the first row of its column and press Enter, and Excel writes the column names and fills the table down.
Cycle Cost: =[@Seats]*[@[Price / Seat]]
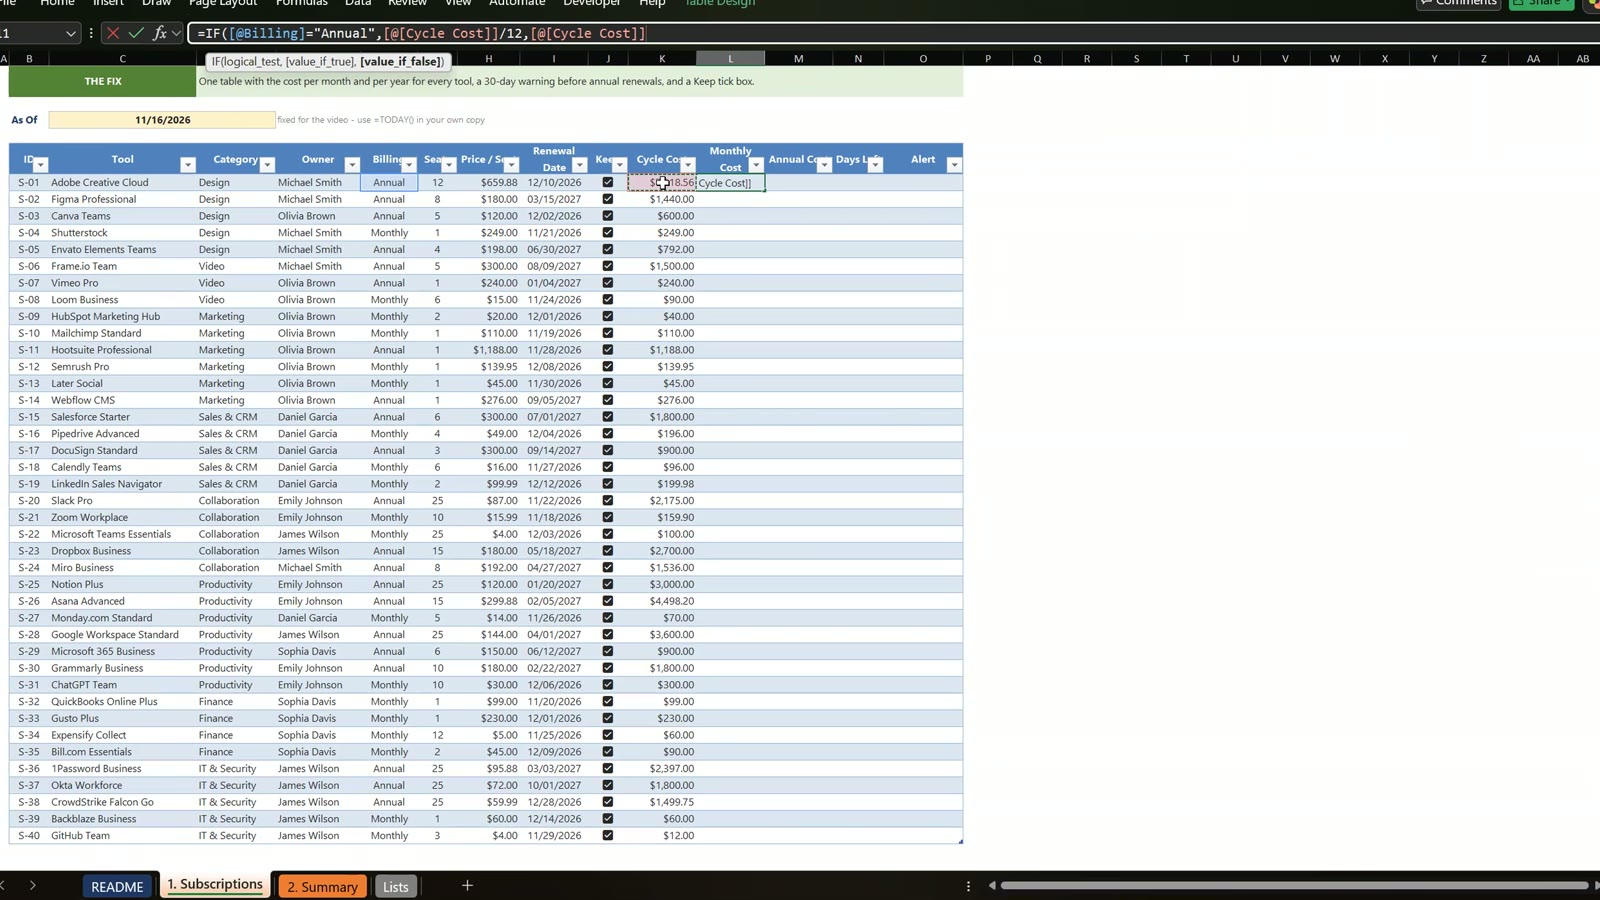
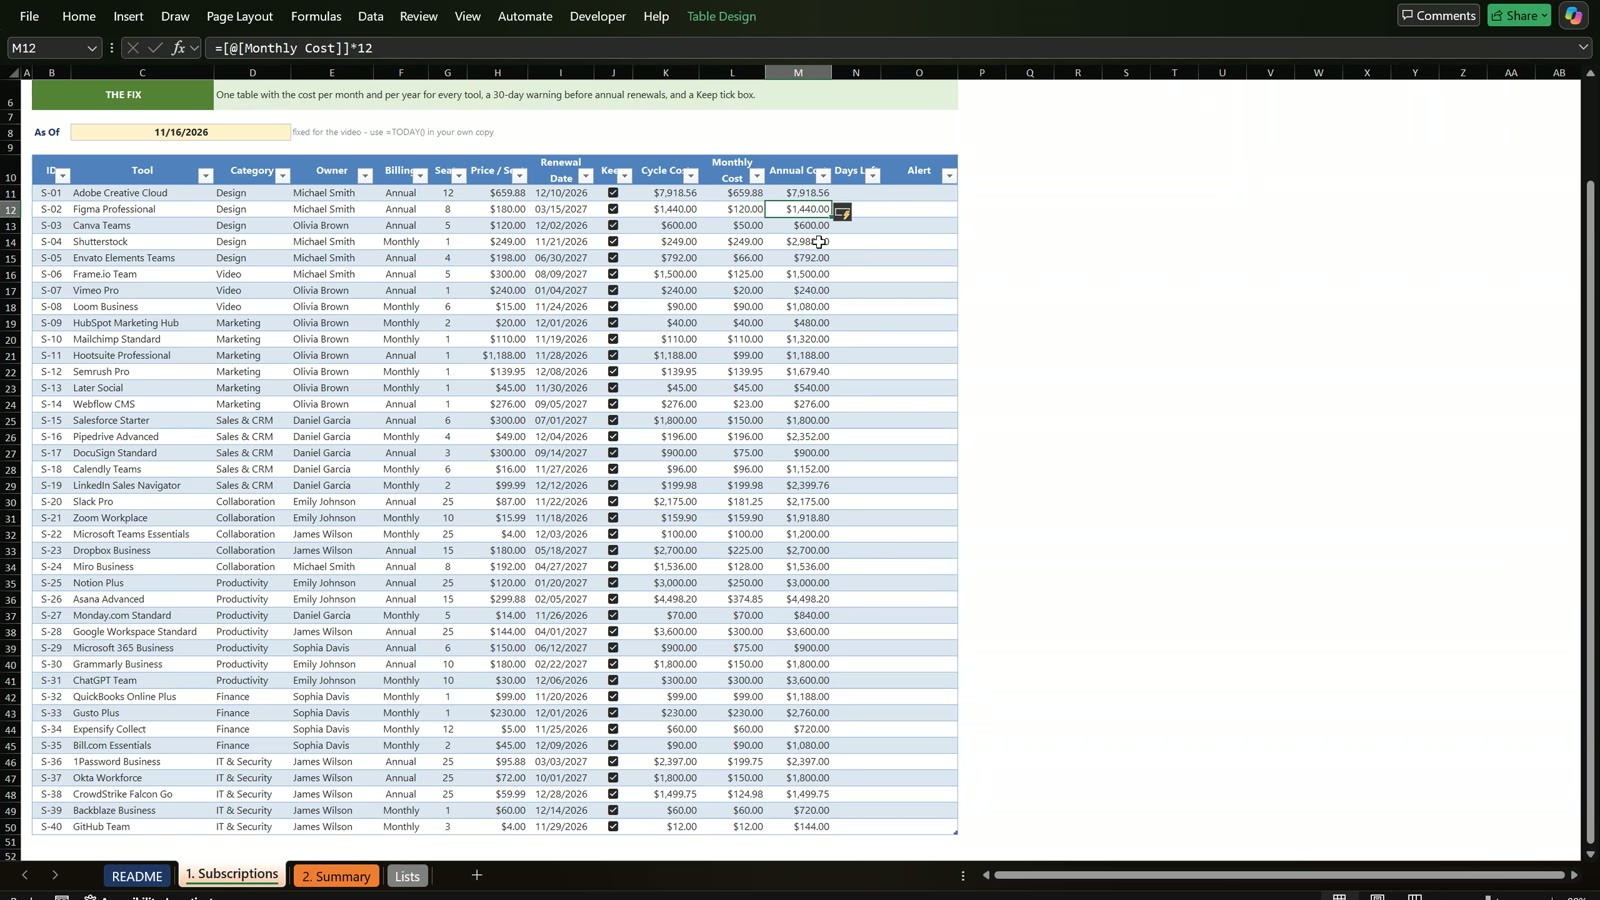
Monthly Cost, the important one: =IF([@Billing]="Annual",[@[Cycle Cost]]/12,[@[Cycle Cost]]). Adobe is annual, so $7,918.56 divided by 12 is $659.88 a month. A monthly tool stays as it is.
Annual Cost: =[@[Monthly Cost]]*12
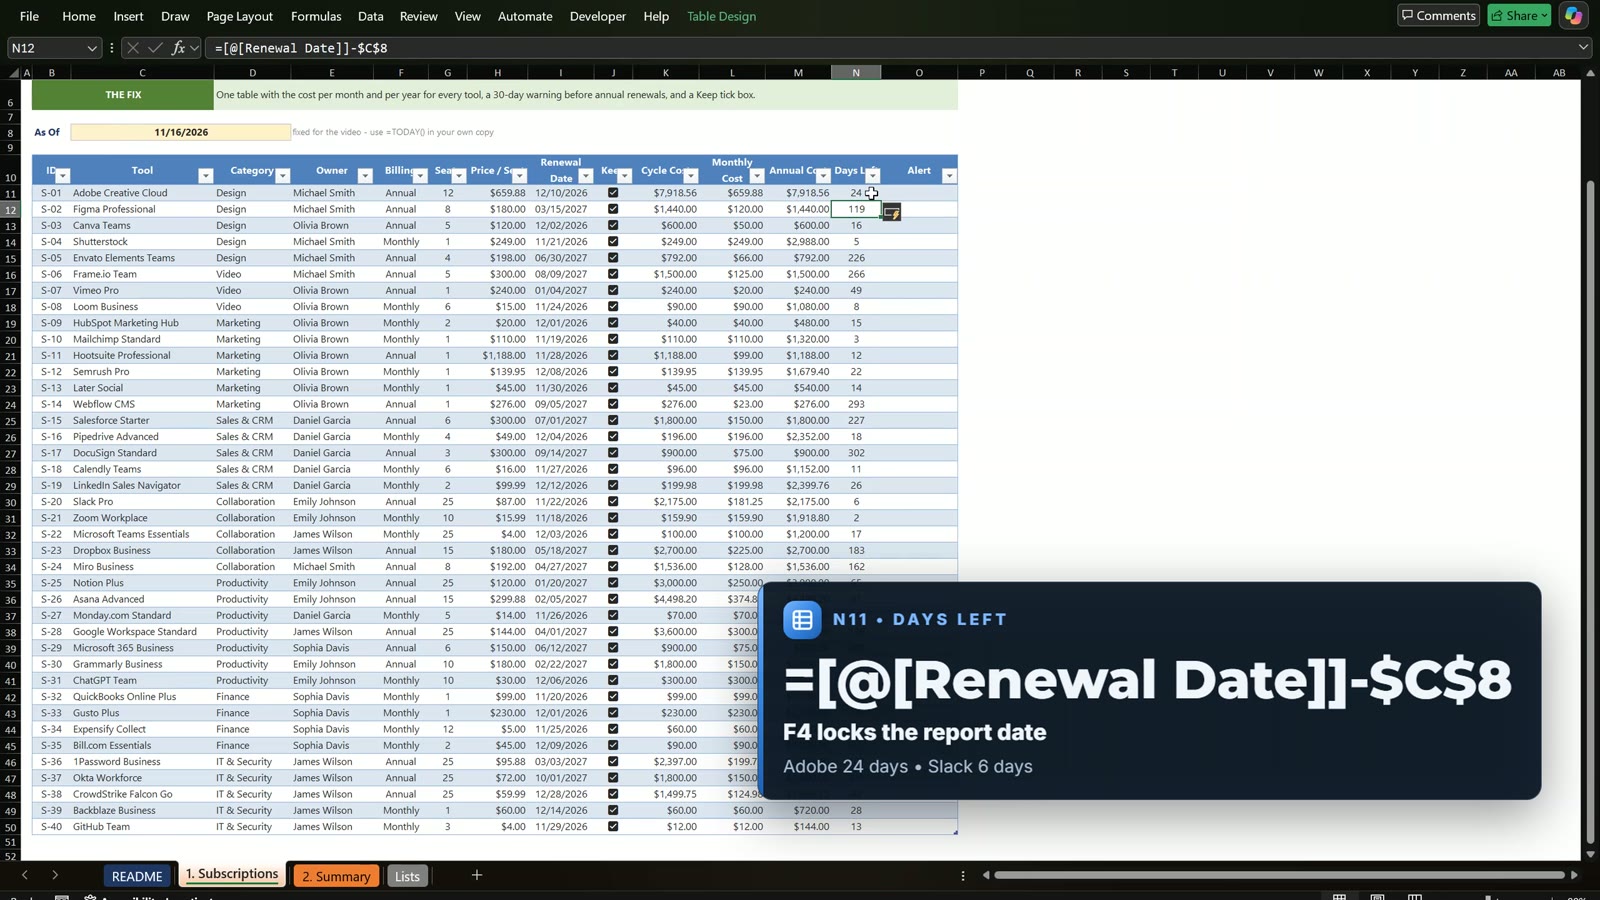
Days Left: =[@[Renewal Date]]-$C$8. Press F4 to lock the report date in C8 so every row uses it. Adobe renews in 24 days and Slack in only 6.
Step 6: The Alert
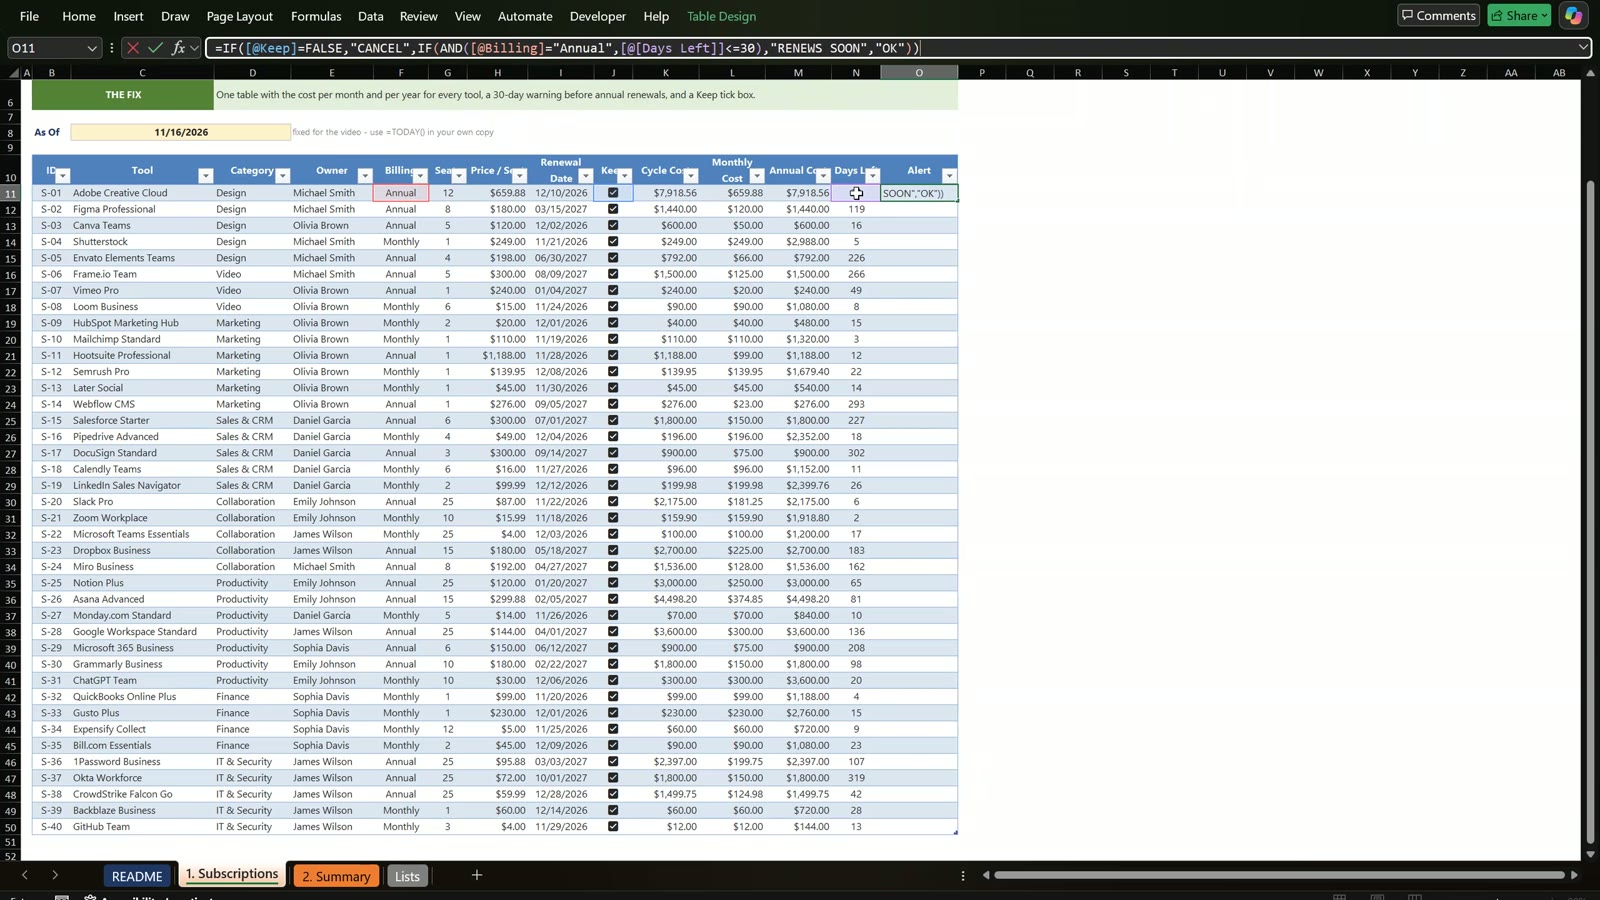
A monthly plan can be cancelled any month, but an annual plan locks you in for a year, so only annual plans get a 30-day warning:
=IF([@Keep]=FALSE,"CANCEL",IF(AND([@Billing]="Annual",[@[Days Left]]<=30),"RENEWS SOON","OK"))
Adobe, Canva, Hootsuite and Slack now say RENEWS SOON and everything else says OK.
Step 7: Data Bars and Alert Colors
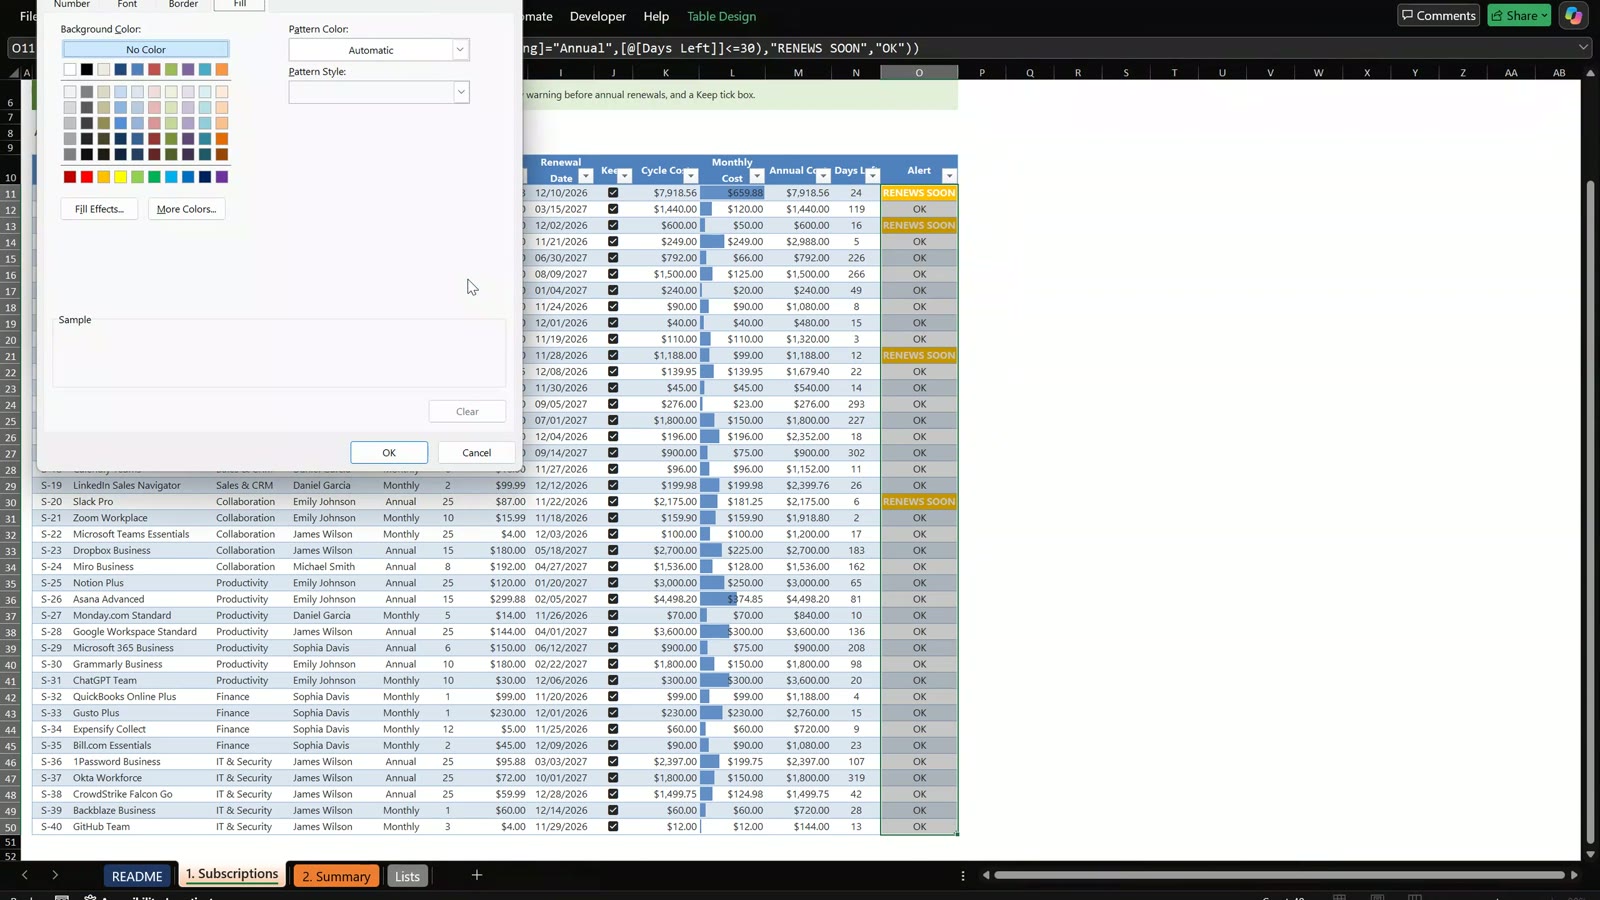
Select Monthly Cost and add solid blue Data Bars so the expensive tools stand out. For the Alert column use New Rule with a formula, for example =$O11="CANCEL" with a red fill and white bold text, then the same for RENEWS SOON in orange and OK in green.
Step 8: Summary Cards
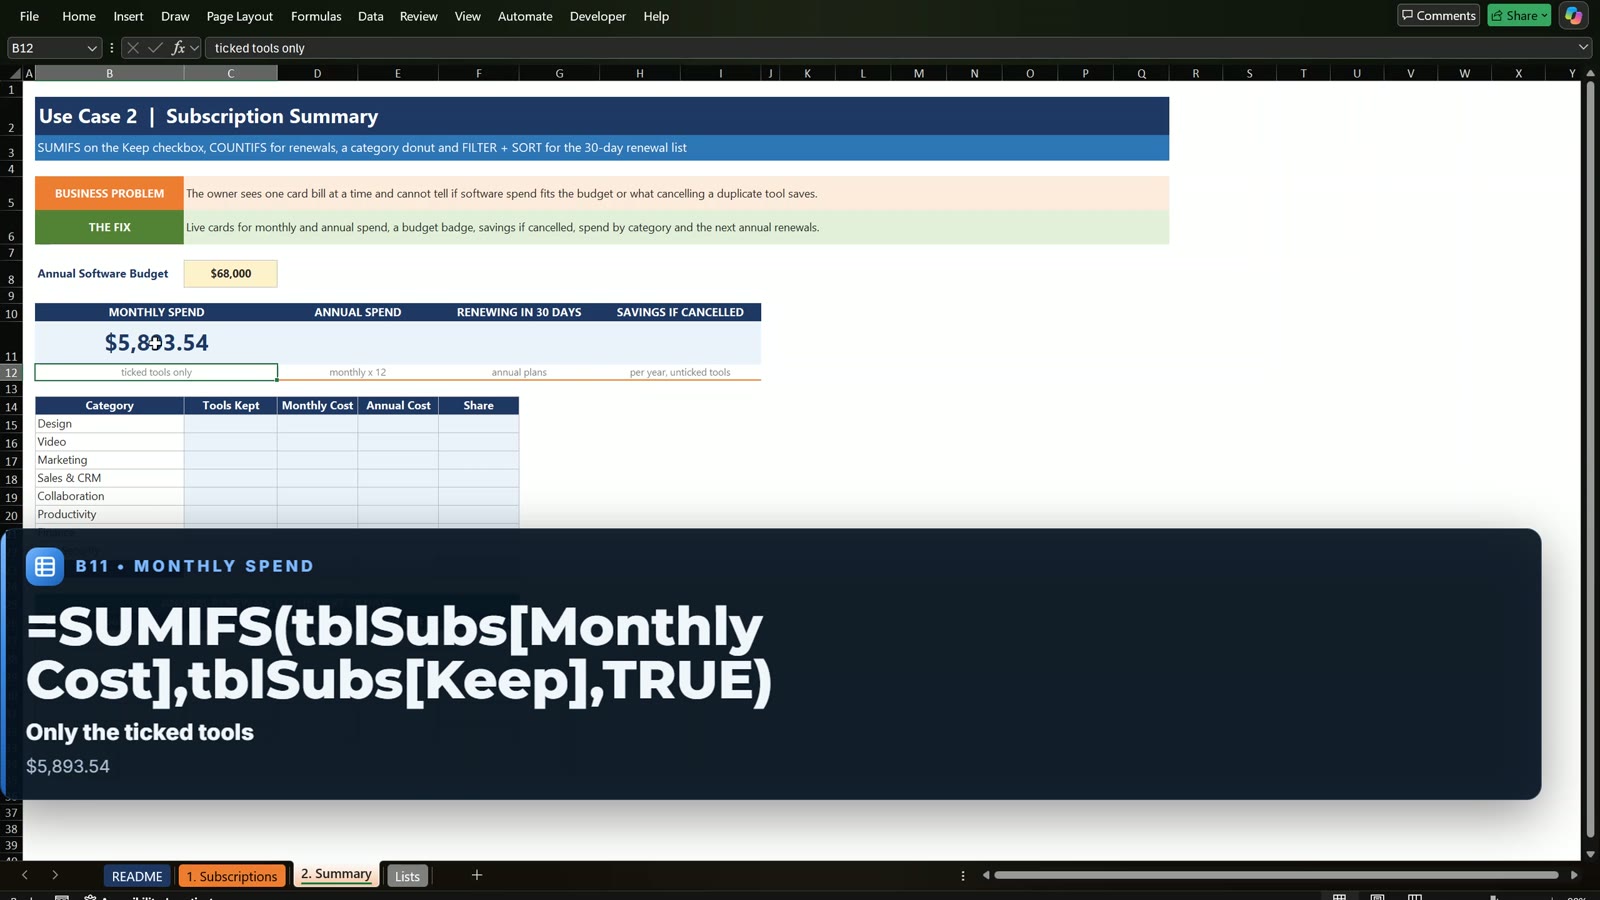
On the Summary tab the budget is the yellow input, $68,000 a year. The four cards use SUMIFS and COUNTIFS on the Keep column, with TRUE and no quotes:
=SUMIFS(tblSubs[Monthly Cost],tblSubs[Keep],TRUE) gives $5,893.54 a month.=SUMIFS(tblSubs[Annual Cost],tblSubs[Keep],TRUE) gives $70,722.47 a year.=COUNTIFS(tblSubs[Alert],"RENEWS SOON") gives 4 renewals.=SUMIFS(tblSubs[Annual Cost],tblSubs[Keep],FALSE) gives $0.00 savings, because nothing is unticked yet.
Step 9: The Budget Badge
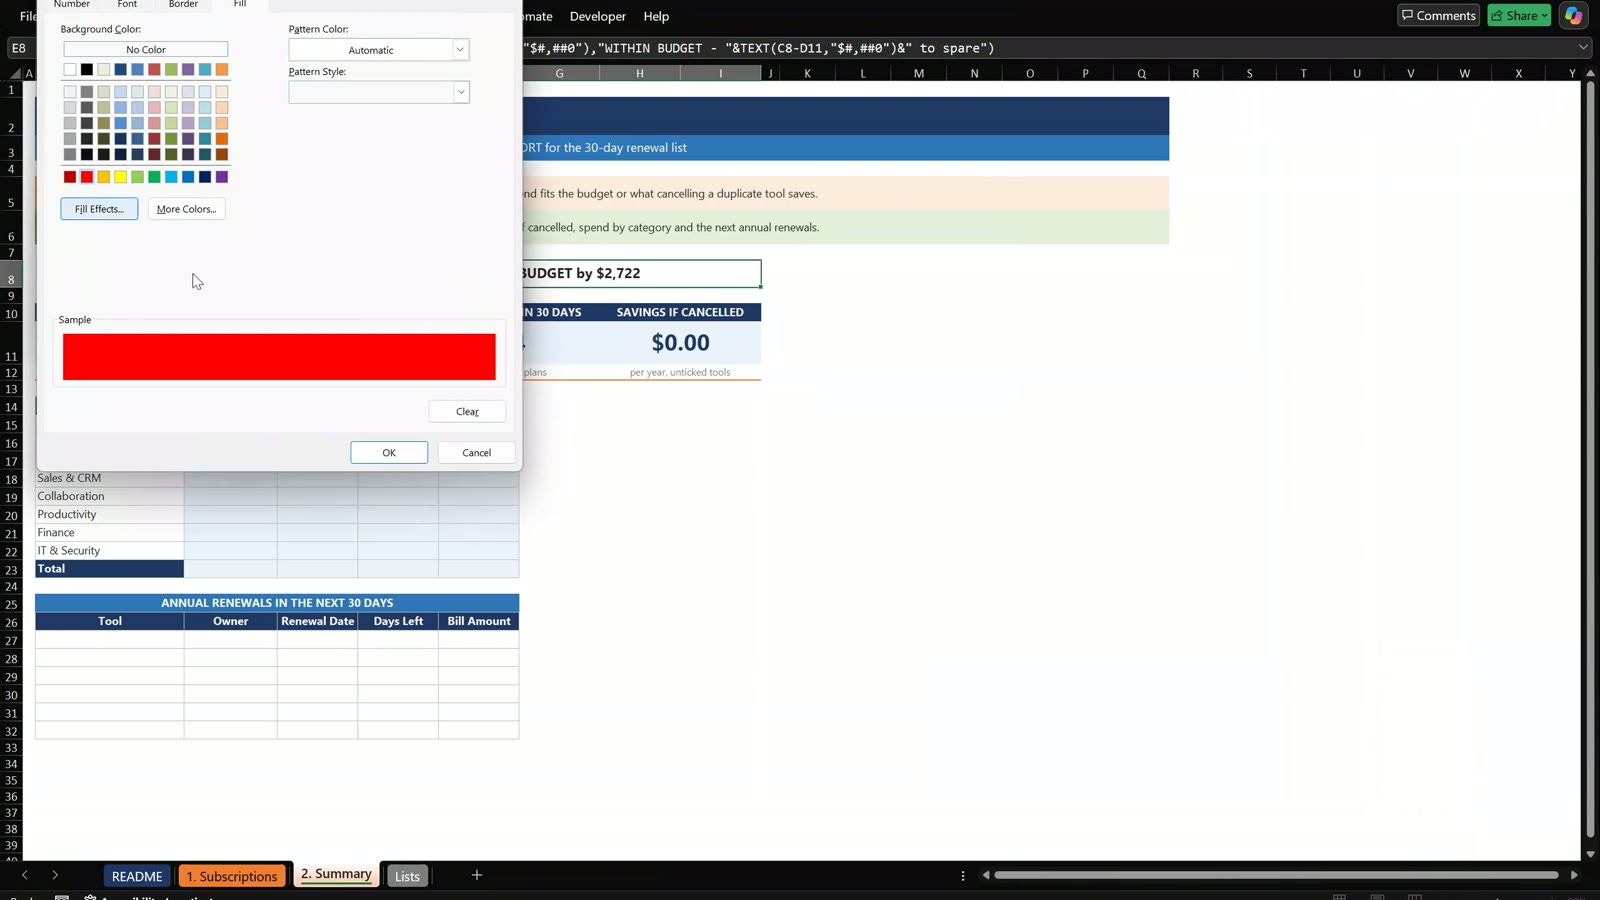
=IF(D11>C8,"OVER BUDGET by "&TEXT(D11-C8,"$#,##0"),"WITHIN BUDGET - "&TEXT(C8-D11,"$#,##0")&" to spare")
Add two formula rules to color it: =LEFT($E$8,4)="OVER" in red and =LEFT($E$8,6)="WITHIN" in green.
Step 10: Spend by Category and a Doughnut Chart
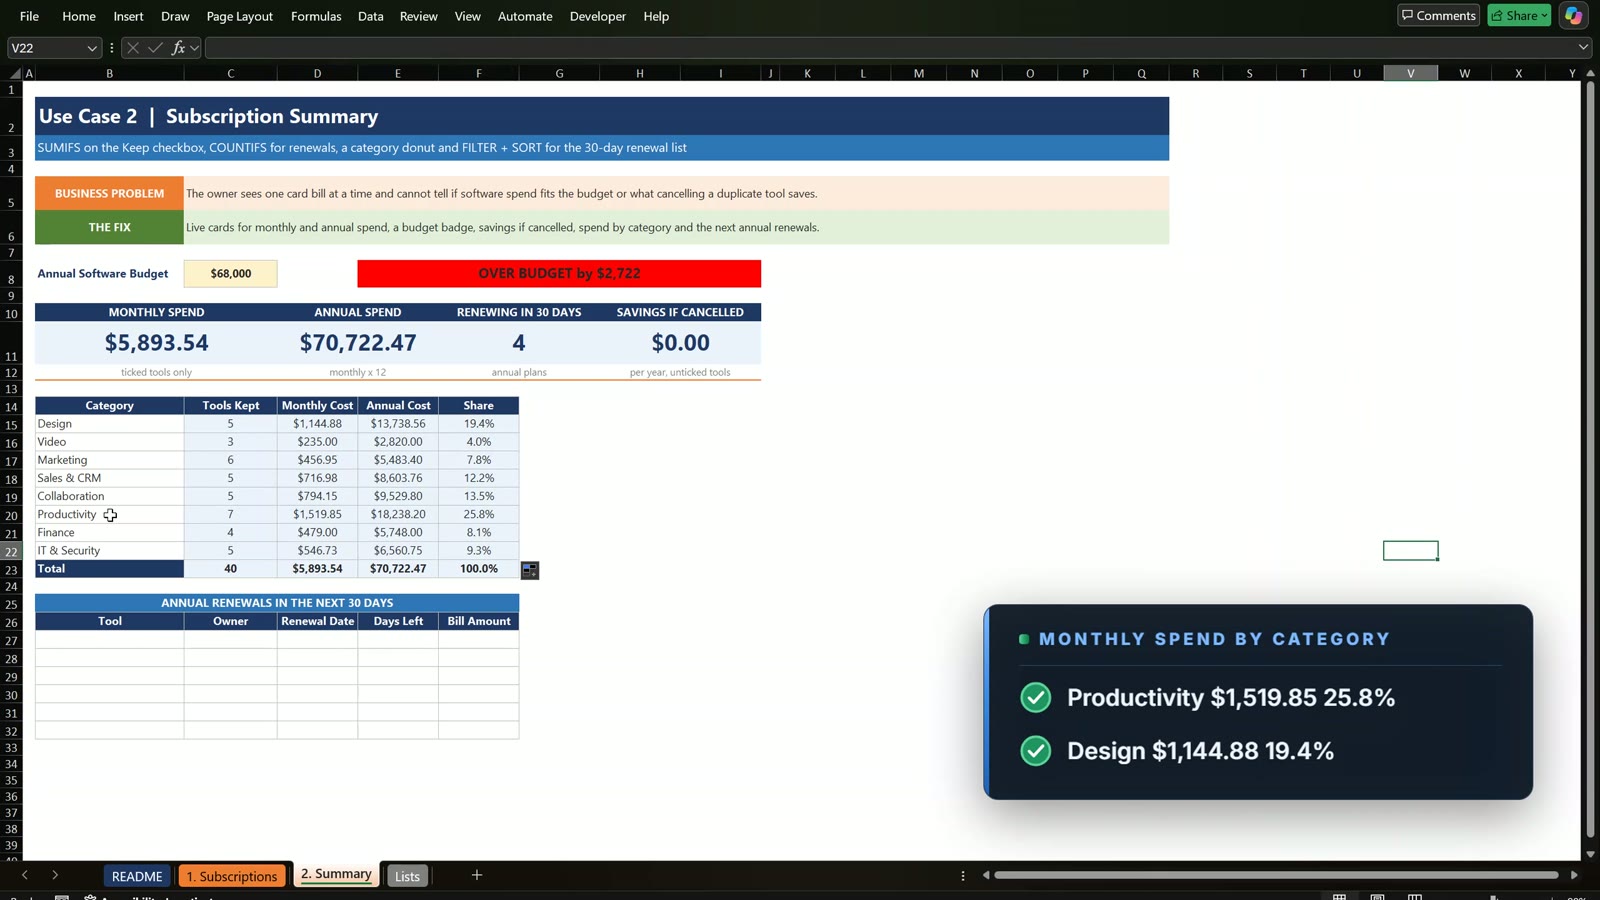
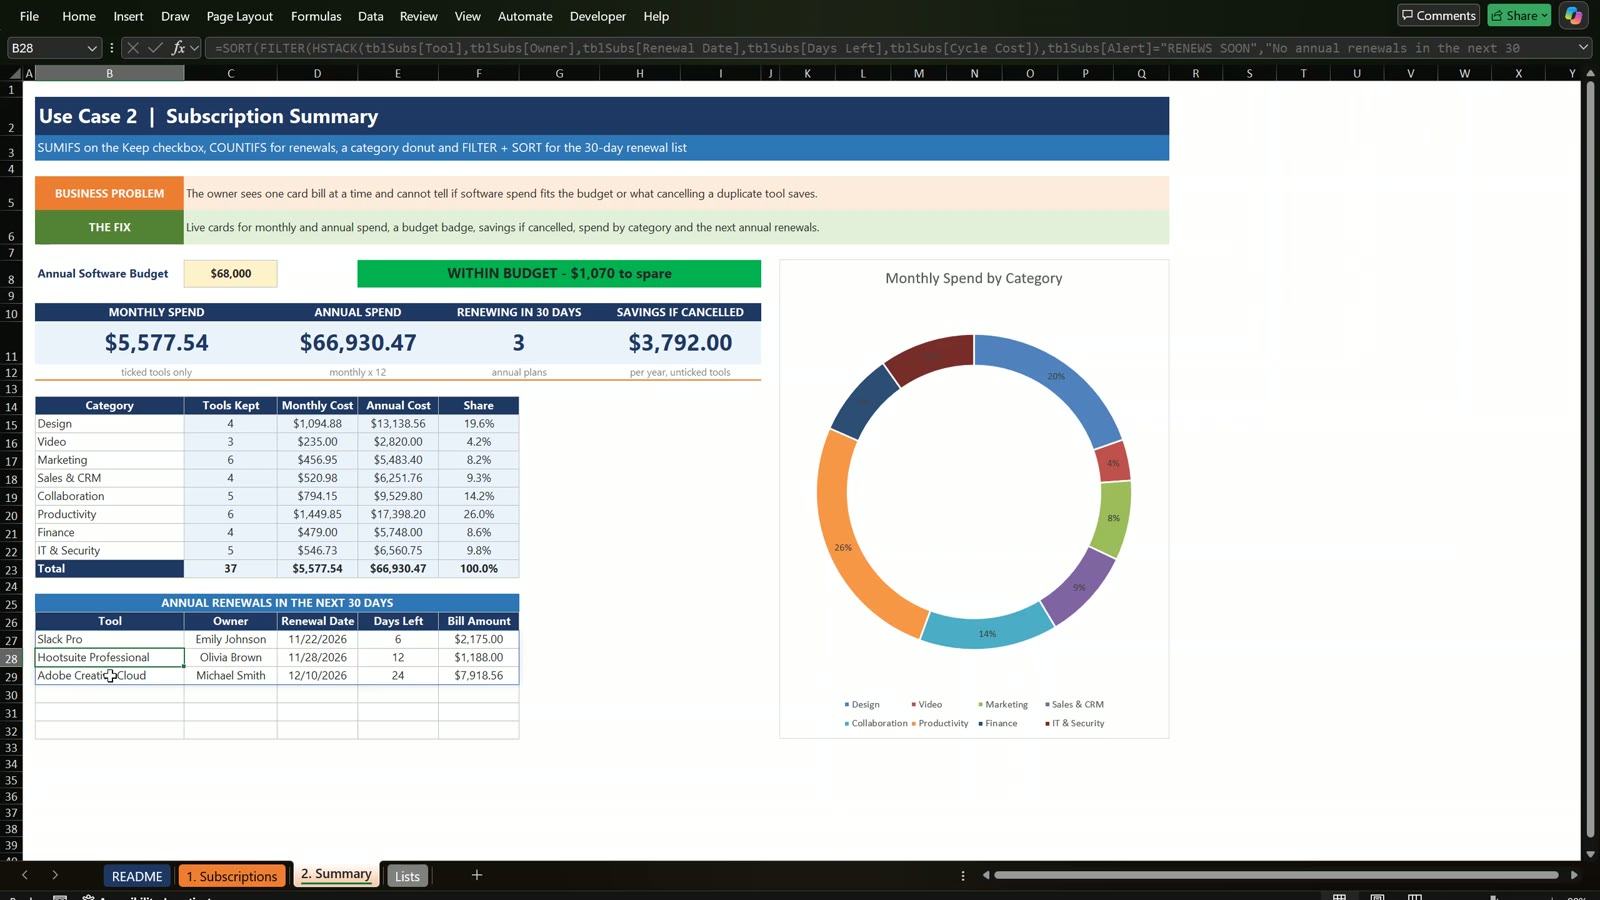
For each category count the kept tools with =COUNTIFS(tblSubs[Category],$B15,tblSubs[Keep],TRUE) and add up the monthly cost with =SUMIFS(tblSubs[Monthly Cost],tblSubs[Category],$B15,tblSubs[Keep],TRUE). The annual cost is the monthly cost times 12 and the share is the monthly cost divided by the locked total. Productivity is the biggest group at $1,519.85 a month (25.8%), and Design is second at 19.4%.
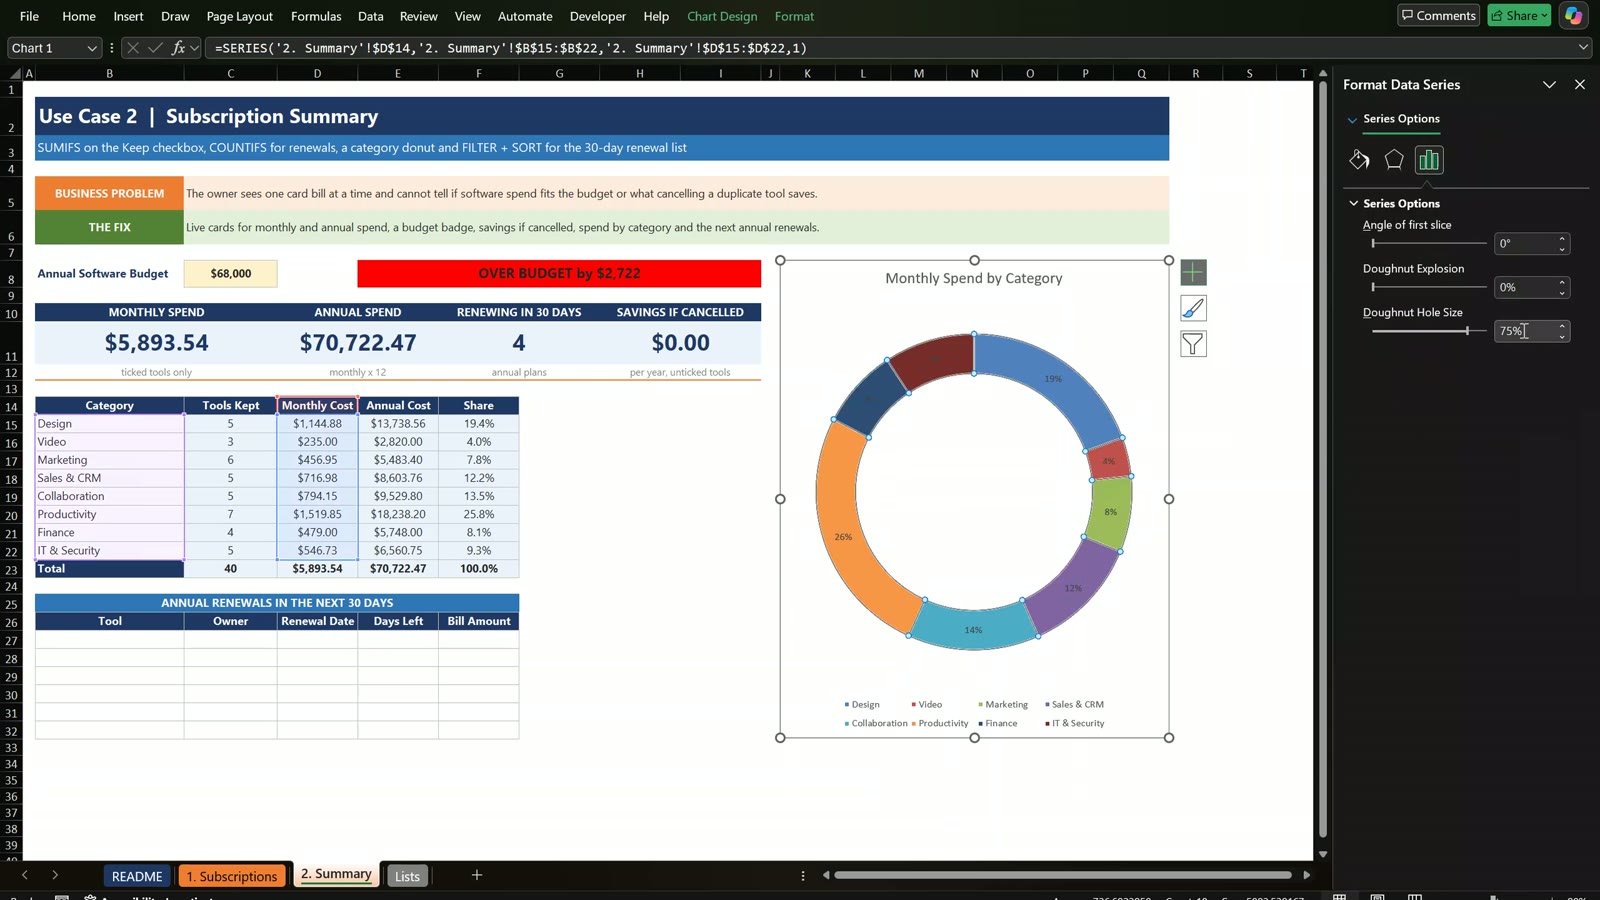
Select the category names and the monthly cost, then Insert, Doughnut. Title it Monthly Spend by Category, move the legend to the bottom, show percentage labels and make the hole bigger.
Step 11: The Renewal List With One Formula
=SORT(FILTER(HSTACK(tblSubs[Tool],tblSubs[Owner],tblSubs[Renewal Date],tblSubs[Days Left],tblSubs[Cycle Cost]),tblSubs[Alert]="RENEWS SOON","No annual renewals in the next 30 days"),3)
HSTACK puts the columns side by side, FILTER keeps the tools that renew soon and SORT orders them by the renewal date. The list spills down by itself: Slack Pro on 11/22 ($2,175.00), Hootsuite, Canva and Adobe Creative Cloud ($7,918.56). It needs Microsoft 365 or Excel 2021 or later.
The Payoff: Cancel Three Duplicate Tools
Untick Canva Teams (the agency already has Adobe and Figma), Monday.com Standard (the team works in Asana) and Pipedrive Advanced (sales uses Salesforce). The annual spend drops to $66,930.47, savings show $3,792.00 a year, Canva leaves the renewal list and the badge turns green: within budget with $1,070 to spare.
Want a Ready-Made Version?
This free file teaches the formulas. For a ready-to-use tool with more features, see the Subscription and SaaS Renewal Calendar in Excel. To learn formulas like SUMIFS and FILTER in depth, join the Excel + AI Mastery: 100 Essential Formulas course on Next Gen Templates Academy.
Related Tutorials
- Employee Attendance Tracker in Excel 2026
- 13-Week Cash Flow Forecast in Excel
- Employee Timesheet with Overtime Calculator in Excel
Frequently Asked Questions
How do I track subscriptions in Excel?
Make a table with one row per tool: category, owner, billing type (monthly or annual), seats, price per seat and renewal date. Then add formulas for the monthly cost, annual cost and days left until renewal, and summarize them with SUMIFS.
How do I compare monthly and annual plans?
Bring both to the same unit. Multiply seats by price to get the cost per billing cycle, then divide by 12 if the plan is annual to get a monthly cost. Multiply the monthly cost by 12 to get the annual cost.
How do I get a renewal alert in Excel?
Subtract the report date from the renewal date to get the days left, then use IF with AND to return Renews Soon when the plan is annual and the days left are 30 or fewer. Add conditional formatting to color the result.
Why only annual plans in the renewal alert?
A monthly plan can be cancelled any month, so the risk is small. An annual plan locks you in for a full year, so you need a warning 30 days before it renews.
How do I add checkboxes in Excel?
Select the cells, go to the Insert tab and click Checkbox. A TRUE value becomes a ticked box. This needs Microsoft 365. In older versions type TRUE or FALSE and every formula still works.
How do I list upcoming renewals with one formula?
Use =SORT(FILTER(HSTACK(…),alert column="Renews Soon","No annual renewals in the next 30 days"),3). HSTACK puts the columns side by side, FILTER keeps the rows that need attention and SORT orders them by renewal date. These functions need Microsoft 365 or Excel 2021 or later.
Should I use TODAY() for the report date?
In your own tracker, yes: type =TODAY() so the days left always stay current. In this tutorial the date is fixed at 11/16/2026 so your numbers match the video.
Is the practice file free?
Yes. The zip has the Practice and Solution workbooks for a fictional design agency, Brightline Creative LLC in Austin, Texas. All names and numbers are example data.
Download the Free Practice Files
⬇️ Download the Free Practice Files
Practice file + solution workbook · .zip · Excel 365 recommended
By PK, An Excel Expert. Brightline Creative LLC and all names and numbers are fictional example data for learning.
Conclusion
You built a subscription tracker with checkboxes, monthly and annual costs in one unit, a 30-day renewal alert, summary cards with a budget badge, a category doughnut and a one-formula renewal list. Download the free files, build along with the video and compare with the Solution file if you get stuck.