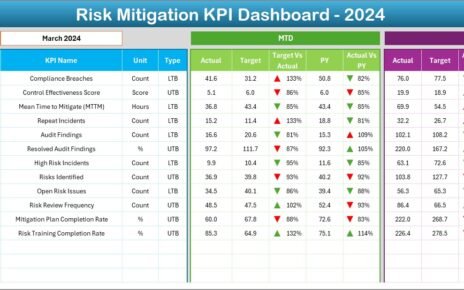
In any organization, managing risks effectively is crucial to ensuring long-term success and stability. The Risk Mitigation KPI Dashboard in
In today's fast-paced, regulation-heavy business environment, managing compliance tasks efficiently is more important than ever. Whether you're overseeing data privacy,
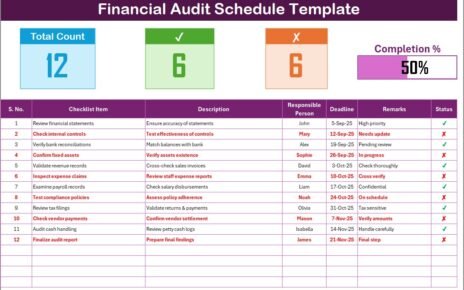
Every organization, whether small or large, needs a structured approach to ensure its finances remain transparent and compliant. A Financial