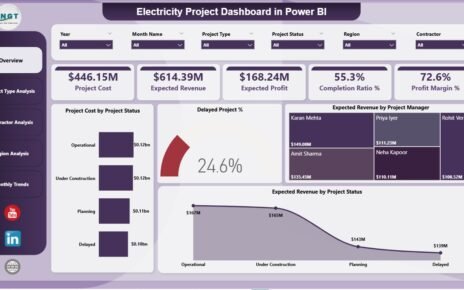
Electricity projects require huge investments, complex planning, and strong coordination among engineers, contractors, project managers, and stakeholders. Power generation plants,
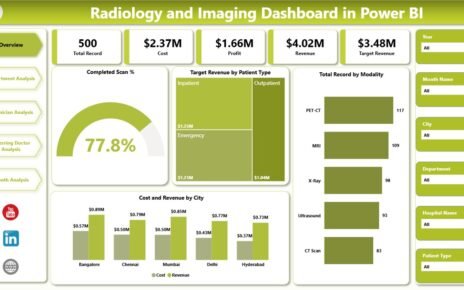
Healthcare organizations generate massive amounts of diagnostic data every day. Radiology and imaging centers handle thousands of scans, patient records,
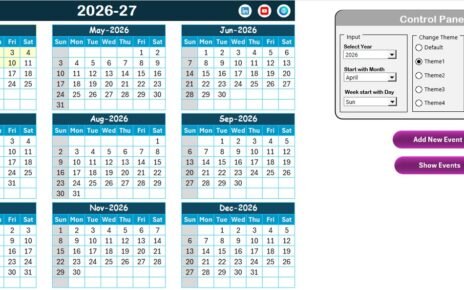
Healthcare organizations operate in a highly regulated environment. Deadlines for audits, policy reviews, certifications, and reporting never stop. Moreover, regulatory