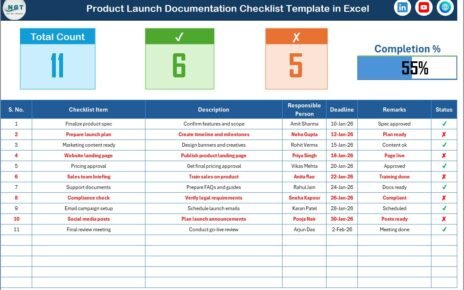
Launching a product without proper documentation often leads to missed tasks, confusion, and costly delays. However, when teams use a
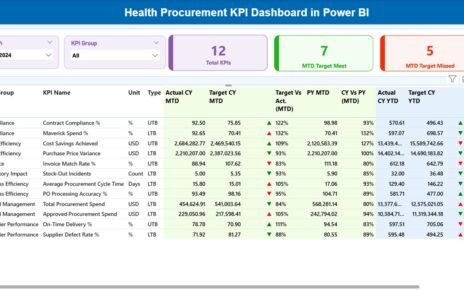
Managing healthcare procurement without accurate performance tracking creates delays, overspending, and compliance risks. Therefore, healthcare organizations now rely heavily on
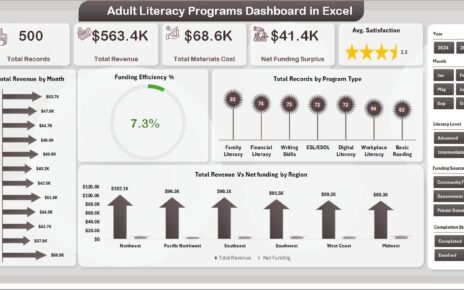
Introduction Adult Literacy Programs Dashboard in Excel is a comprehensive, ready-to-use analytics template designed for literacy organizations, adult education centers,