In today's fast-paced business environment, effective project management is crucial for success. One of the most popular tools for managing
Managing healthcare operations sustainably is not just about reducing costs or going paperless. It’s about making informed decisions using data
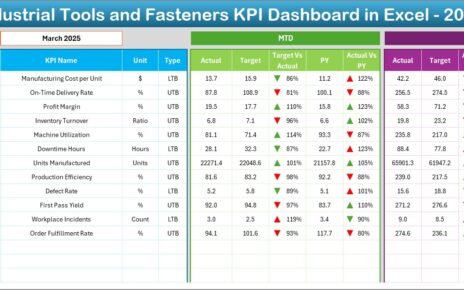
In today’s highly competitive manufacturing environment, companies that produce industrial tools and fasteners must continuously monitor performance to remain profitable