In today’s fast-moving business world, a smooth and efficient supply chain is no longer a luxury—it’s a necessity. Companies rely on optimized logistics to deliver products faster, reduce costs, and improve customer satisfaction. However, achieving this level of performance requires constant monitoring and data-driven decision-making. That’s where the Supply Chain and Logistics Process Improvement KPI Dashboard in Excel comes into play.
This article will help you understand what this dashboard is, how it works, its benefits, best practices, and how to get started—even if you’re not an Excel expert.
Table of Contents
ToggleClick to Purchases Supply Chain and Logistics Process Improvement KPI Dashboard in Excel
What Is a Supply Chain and Logistics Process Improvement KPI Dashboard?
A KPI Dashboard is a centralized tool that tracks Key Performance Indicators (KPIs) for your supply chain and logistics operations. These KPIs cover critical metrics like delivery performance, cost control, lead time, and inventory efficiency.
While many dashboards require complex software, this Excel-based version gives you a simple, flexible, and cost-effective alternative. You get real-time insights into performance so you can spot issues early, take corrective action quickly, and continuously improve your logistics strategy.
Why Use Excel for Your KPI Dashboard?
You might wonder why Excel is a good fit for something as complex as supply chain management. Here’s why:
-
💡 Familiarity: Most professionals already know how to use Excel.
-
🧰 Customization: You can tweak formulas, charts, and layouts easily.
-
🔐 Offline Access: No internet? No problem.
-
💵 Budget-Friendly: You avoid expensive software and subscriptions.
Structure of the KPI Dashboard: Worksheet Breakdown
This ready-to-use Excel template includes 7 functional worksheets, each designed for a specific purpose.
Home Sheet – Your Navigation Hub
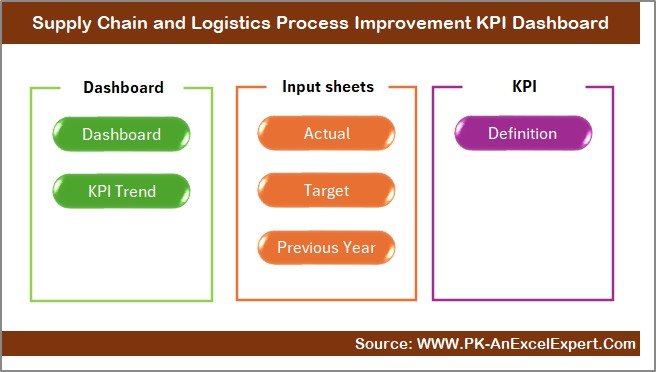
The Home sheet serves as the control center. It includes 6 clickable buttons that instantly take you to the relevant sheets. No need to scroll or search—everything is one click away.
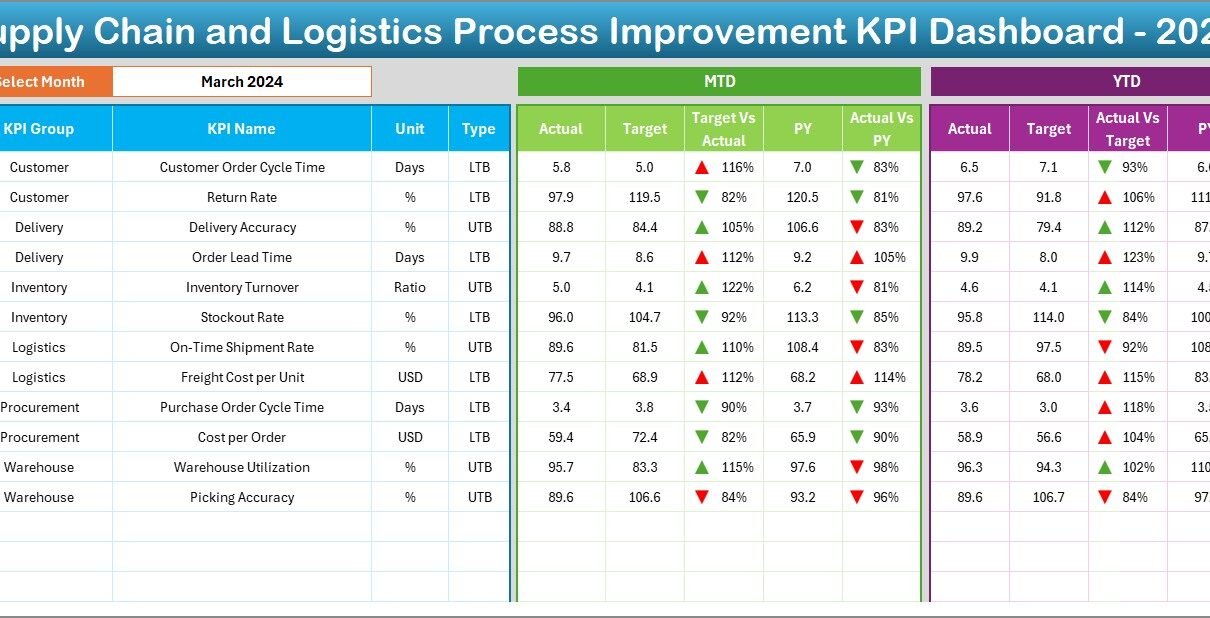
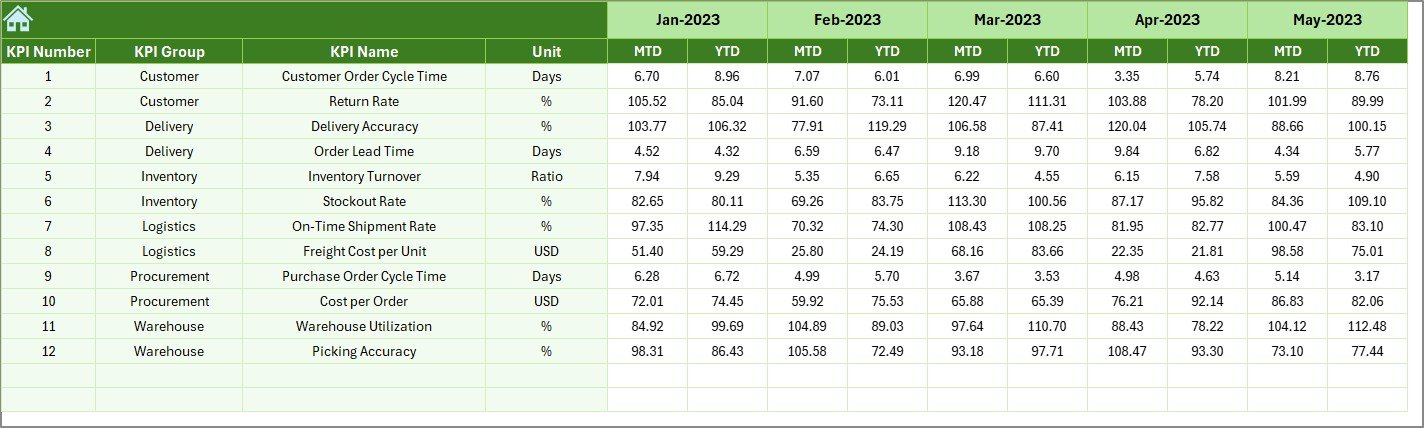
Dashboard Sheet – Real-Time Performance View
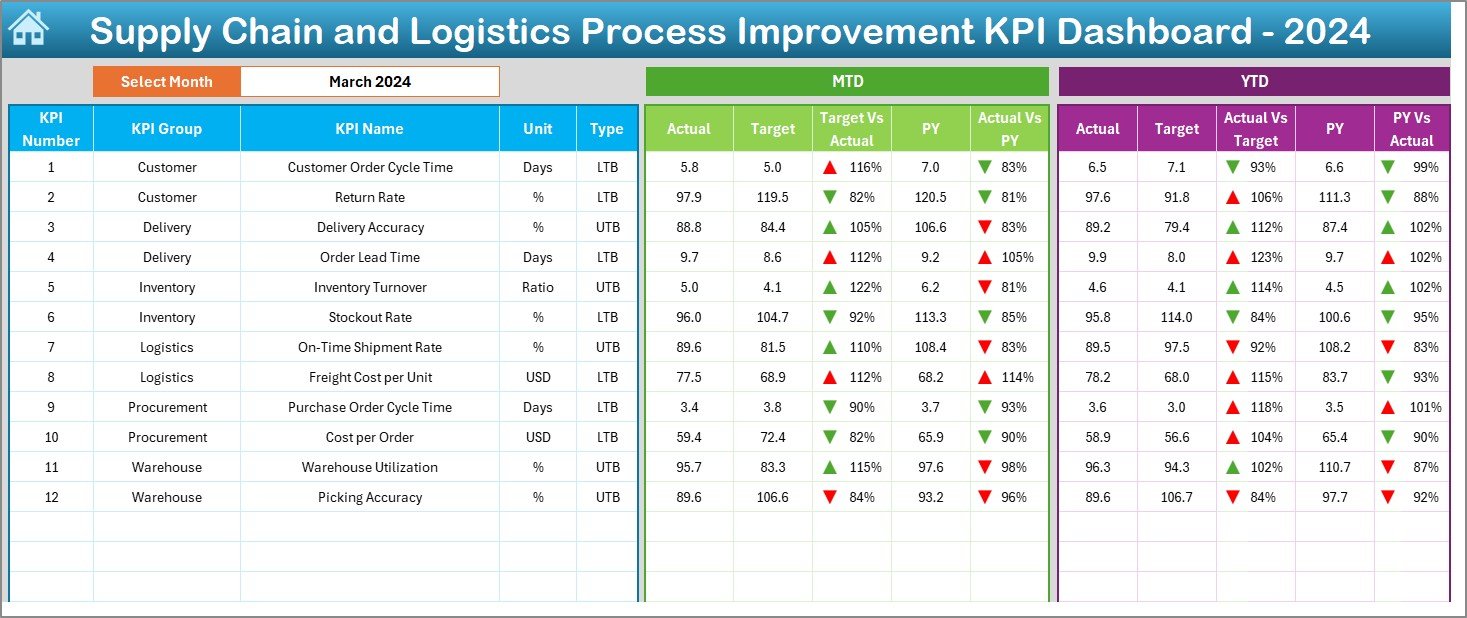
This is the core of the dashboard, where you get an overview of all KPIs.
-
🗓️ Month Selector: Choose any month using the dropdown in cell D3.
-
📊 Dynamic Values: Automatically updates MTD (Month-To-Date), YTD (Year-To-Date), and previous year figures.
-
🔄 Comparison Metrics: View Target vs Actual and Previous Year vs Actual.
-
📉 Conditional Formatting: Arrows indicate performance—up for good, down for poor.
KPI Trend Sheet – Historical Analysis at Your Fingertips
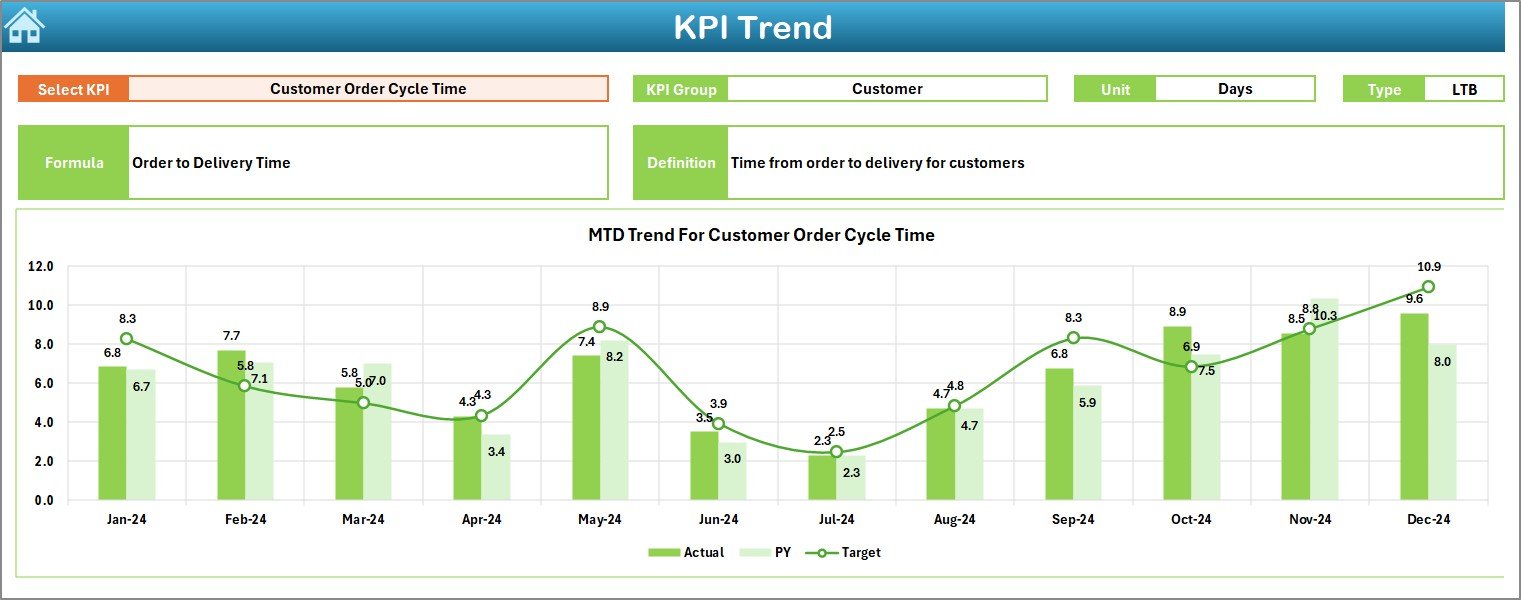
This sheet provides a deeper view of individual KPI trends.
-
🔽 Dropdown at C3: Select the KPI you want to analyze.
-
🧾 Metadata: Displays KPI Group, Unit, Type (UTB or LTB), Formula, and Definition.
-
📈 Trend Charts: Visuals for MTD and YTD data across months for Actual, Target, and Previous Year.
Click to Purchases Supply Chain and Logistics Process Improvement KPI Dashboard in Excel
Actual Numbers Input Sheet – Easy Data Entry
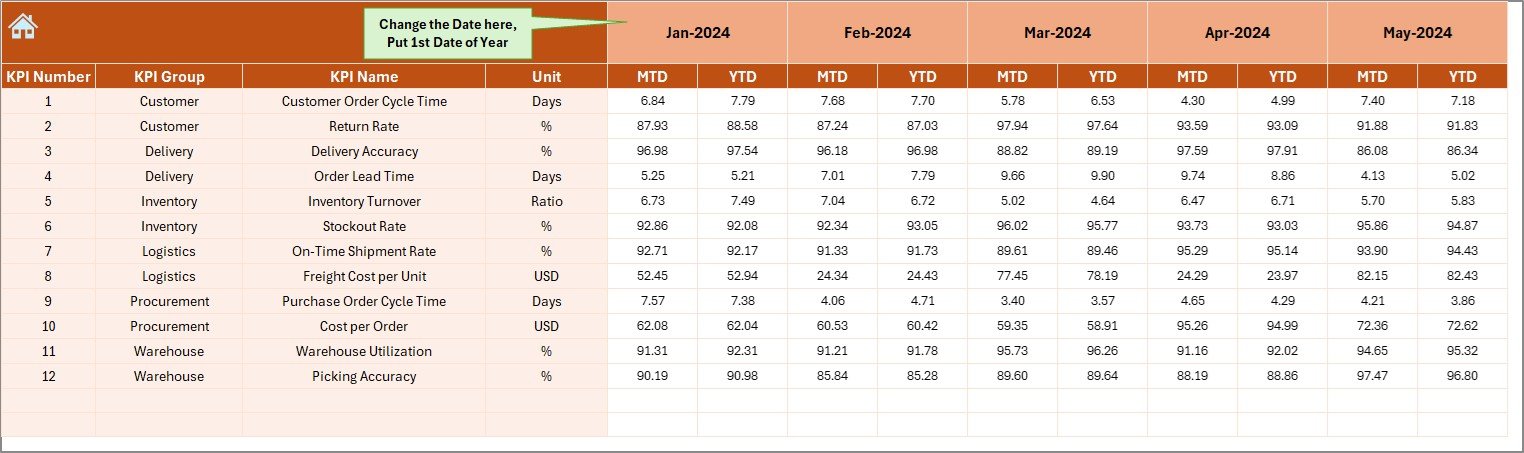
Enter actual KPI values here.
-
🔁 Month Control: Set the starting month in cell E1.
-
✍️ MTD and YTD Entry: Just type your numbers; everything else updates automatically.
Target Sheet – Set Your Goals
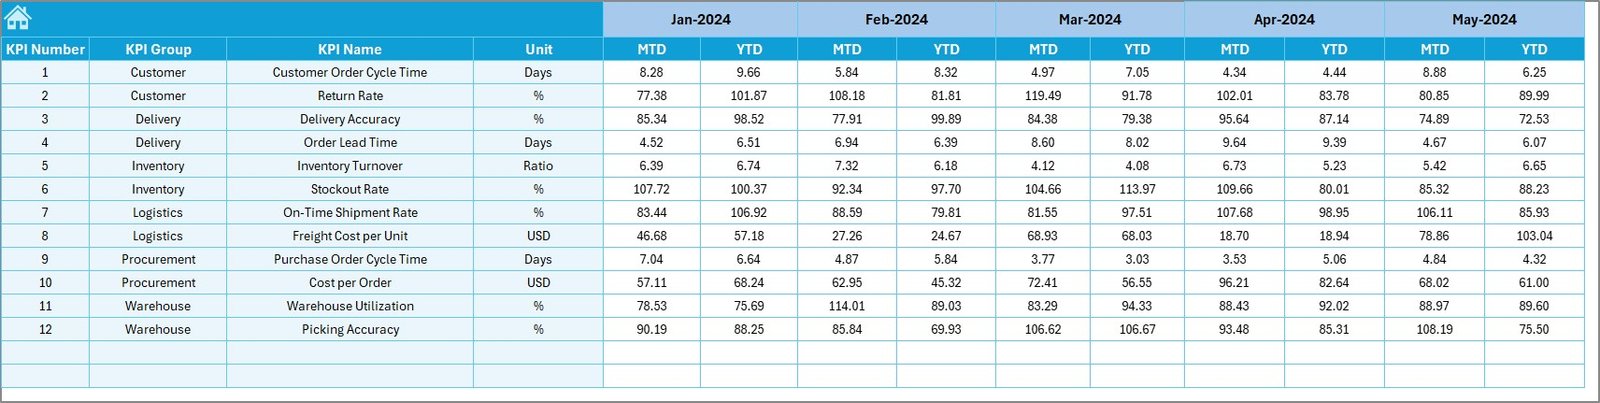
Use this sheet to input monthly targets.
-
🎯 Dual Input: Fill both MTD and YTD target values.
-
🧩 Align KPIs with Strategy: Helps keep performance expectations transparent and measurable.
Previous Year Sheet – Historical Benchmarking
Enter previous year’s KPI values in this sheet.
-
🕒 Side-by-Side Comparison: Lets you measure current performance against the past.
KPI Definition Sheet – Know What You’re Measuring
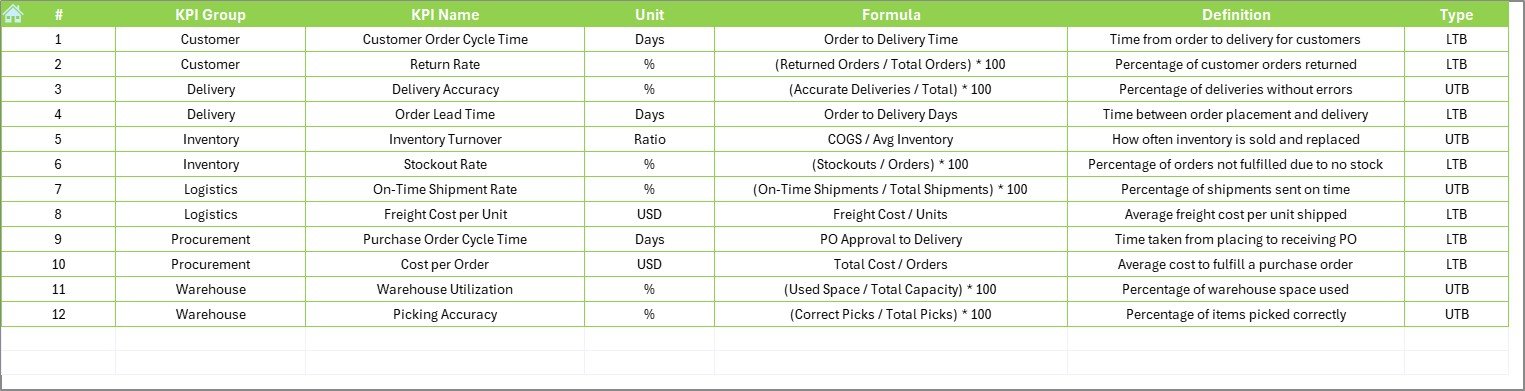
Here, you define each KPI clearly.
-
📘 Columns Include: KPI Name, Group, Unit, Formula, and Definition.
-
✔️ Clarity Matters: Ensures consistency in understanding and reporting.
Advantages of a Supply Chain and Logistics KPI Dashboard in Excel
Let’s look at the top benefits of using this dashboard:
🚀 Instant Visibility
You can immediately see which areas are performing and which ones need attention.
🕒 Saves Time
No need to prepare manual reports each month—just input the data and let the dashboard do the rest.
💸 Cost-Effective
Why invest in expensive software when Excel gives you 90% of what you need?
📈 Drives Continuous Improvement
Track trends over time and take timely actions to fix bottlenecks or inefficiencies.
👨💼 Encourages Team Accountability
Everyone understands their role and performance through visual metrics.
Best Practices for Using the KPI Dashboard
To get the best out of your dashboard, follow these expert tips:
1. Keep It Updated
Regularly input actual data and targets to maintain accuracy.
2. Validate Your KPIs
Ensure each KPI you track is relevant to your logistics goals and measurable with available data.
3. Limit Manual Entry
Where possible, link your dashboard with automated data sources (like Power Query or VBA).
4. Review Monthly
Set a fixed time to review the dashboard and discuss insights with your team.
5. Use Consistent Units
Always measure in consistent units (e.g., hours, dollars, %, etc.) to avoid confusion.
How to Customize the Dashboard
One of the best parts of using Excel is the freedom to modify. Here’s how you can tailor this template:
-
🎨 Change Colors: Match your brand or highlight critical KPIs.
-
🔢 Add KPIs: Insert more rows in definition and trend sheets.
-
🔄 Link with Forms: Use Excel Forms or Power Automate to collect data.
-
🧮 Add Calculations: Insert new columns for custom metrics (like rolling averages).
Real-Life Example of Dashboard Use
Imagine you’re a Logistics Manager at a manufacturing company. You notice rising transportation costs over three months in your dashboard. On investigating, you find a new route is less efficient. You switch vendors and update the Target in your dashboard. The next month, you track a 12% cost improvement. Without the dashboard, this insight may have been missed.
Common Mistakes to Avoid
-
❌ Ignoring KPI Definitions: Always define what and how you’re measuring.
-
❌ Skipping Monthly Updates: Leads to outdated insights.
-
❌ Tracking Too Many KPIs: Focus on the vital few, not the trivial many.
-
❌ Using Inconsistent Formats: Stick to one style for clear communication.
Who Can Use This Dashboard?
This Excel-based KPI dashboard is suitable for:
-
✅ Supply Chain Analysts
-
✅ Logistics Managers
-
✅ Operations Heads
-
✅ Small Businesses
-
✅ E-commerce Stores
-
✅ Consultants and Auditors
You don’t need to be an Excel wizard. If you can use filters and type in cells—you’re good to go!
Conclusion
Improving your supply chain and logistics operations doesn’t need fancy tools or big budgets. With the Supply Chain and Logistics Process Improvement KPI Dashboard in Excel, you get clarity, control, and continuous improvement—all in a user-friendly spreadsheet.
Whether you run a local delivery service or manage global logistics, this dashboard is your strategic partner in staying efficient, competitive, and future-ready.
Visit our YouTube channel to learn step-by-step video tutorials