In today’s fast-paced retail and e-commerce world, staying compliant with industry regulations and internal policies plays a vital role in building customer trust and avoiding costly penalties. Therefore, organizations must track their compliance performance through clear, actionable metrics. As a result, a Retail and E-commerce Compliance KPI Dashboard in Excel becomes an indispensable tool for business leaders and analysts.
In this comprehensive guide, we will explore every aspect of creating and using a compliance KPI dashboard in Excel. Moreover, we’ll share best practices, highlight key advantages, and answer common questions. Ultimately, you will gain everything you need to implement a ready-to-use template and drive continuous improvement.
Click to Purchases Retail and E-commerce Compliance KPI Dashboard in Excel
What Is a Compliance KPI Dashboard?
A Compliance KPI Dashboard is a visual management tool that displays critical performance indicators related to regulatory and policy adherence. Specifically for retail and e-commerce organizations, it tracks metrics such as product labeling compliance, data privacy adherence, payment security standards, age-restricted item sales, and more.
Active tracking of these KPIs helps you catch issues early and take corrective action. As a result, your team can maintain high compliance standards, avoid fines, and improve operational efficiency.
Key Features of the Retail and E-commerce Compliance KPI Dashboard
We designed a ready-to-use Excel template that includes the following seven worksheets:
Home Sheet
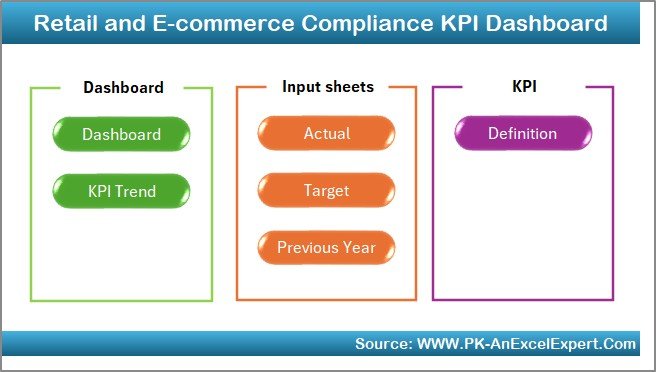
- Serves as an index with six buttons linking to each worksheet.
- Provides a clear navigation path for users.
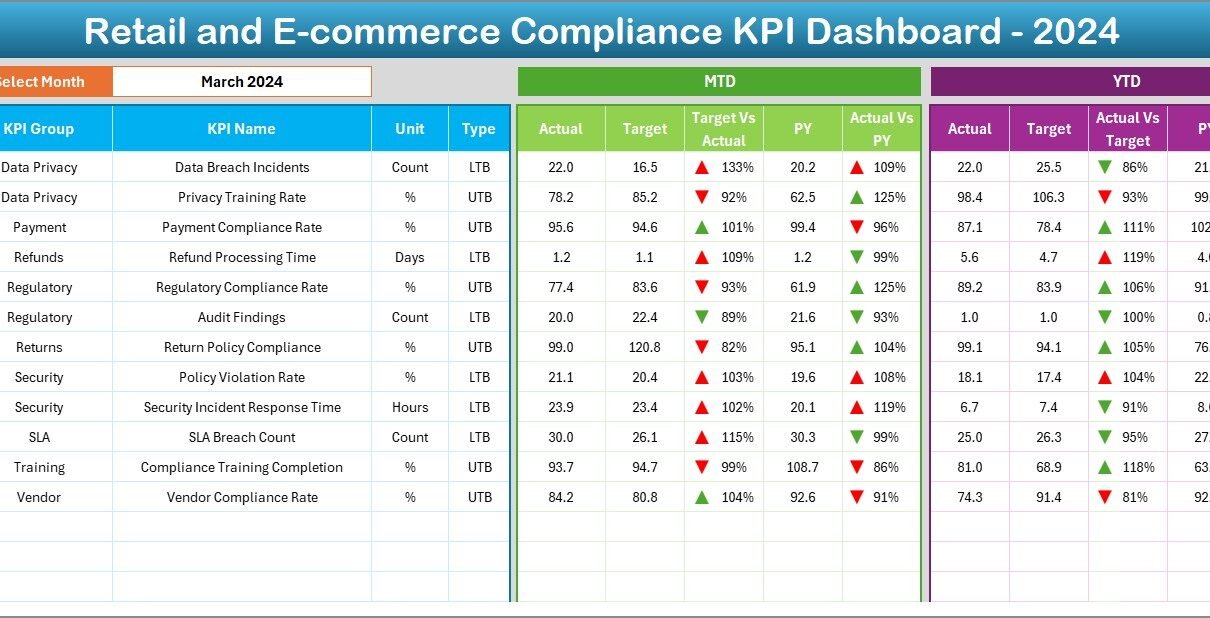
Dashboard Sheet
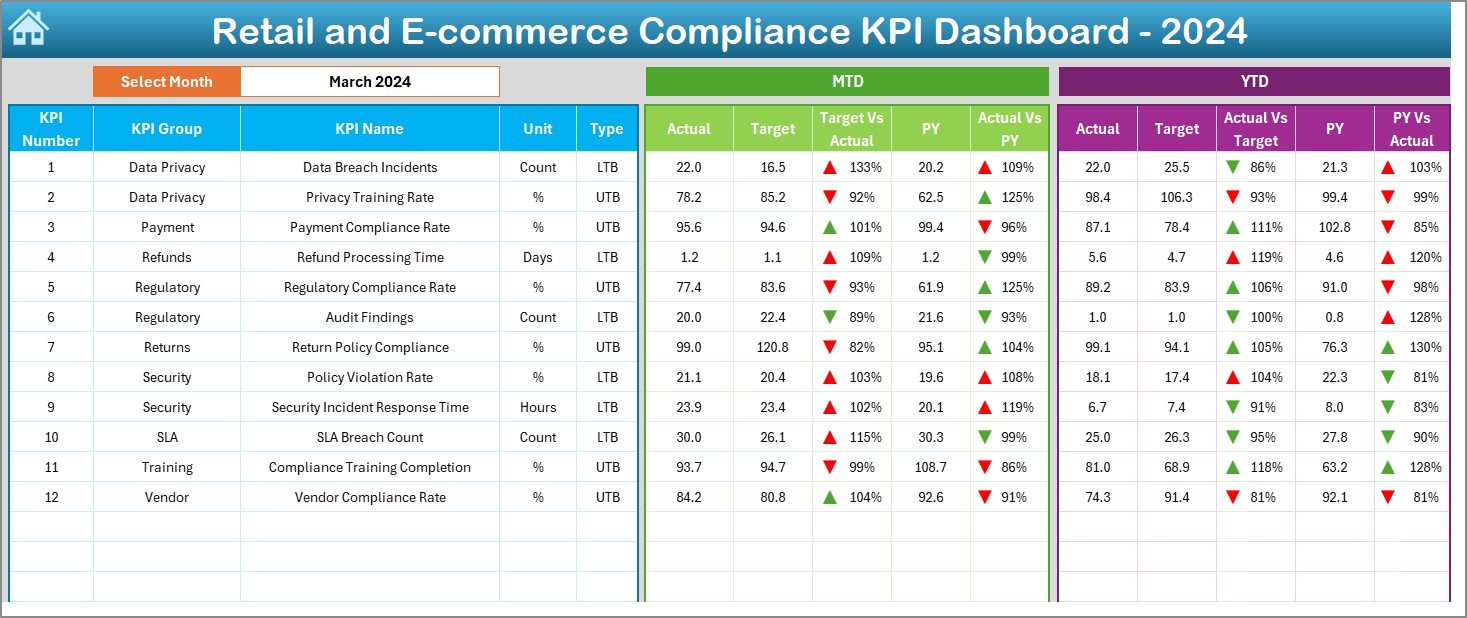
- Main interface showing Month-to-Date (MTD) and Year-to-Date (YTD) data.
- Includes MTD Actual, Target, Previous Year, Target vs. Actual, and PY vs. Actual comparisons.
- Uses conditional formatting with up/down arrows to highlight performance trends.
- Interactive month selection from a dropdown in cell D3.
Click to Purchases Retail and E-commerce Compliance KPI Dashboard in Excel
KPI Trend Sheet
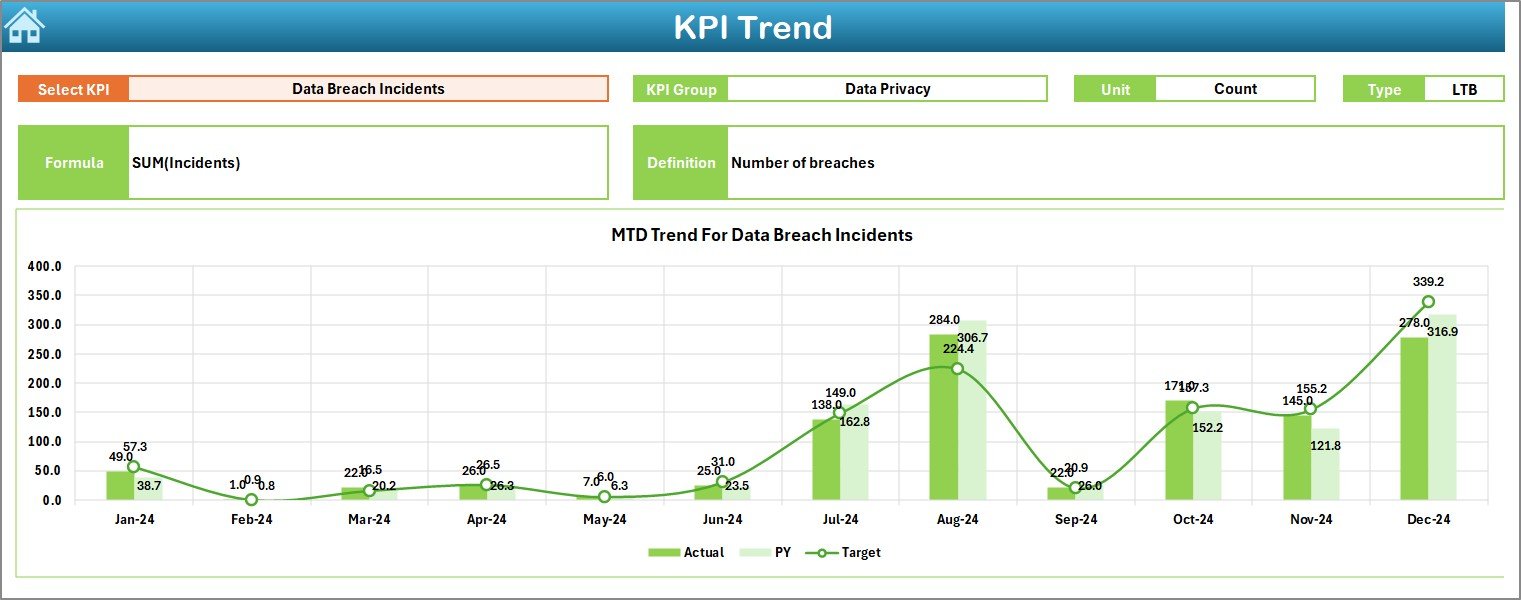
- Dropdown in cell C3 for selecting any KPI.
- Displays KPI Group, Unit, KPI Type (Lower the Better or Upper the Better), Formula, and Definition.
- Plots MTD and YTD trend charts for Actual, Target, and PY values.
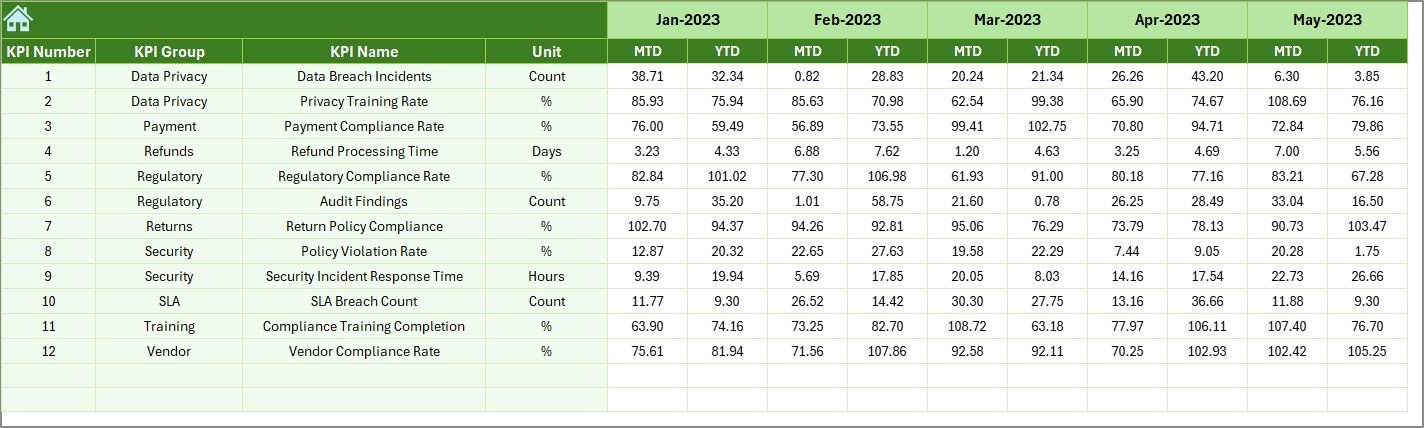
Actual Numbers Input Sheet
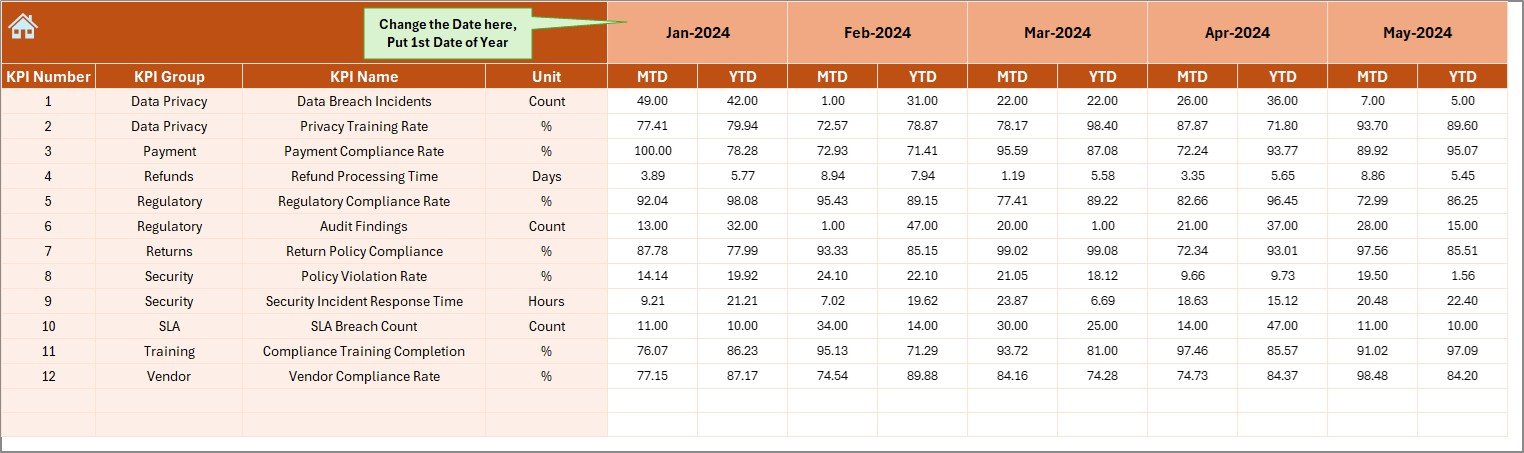
- Allows you to enter actual MTD and YTD values for the selected month.
- Month selection via range E1; update the first month of the year to adjust the timeline.
Target Numbers Sheet
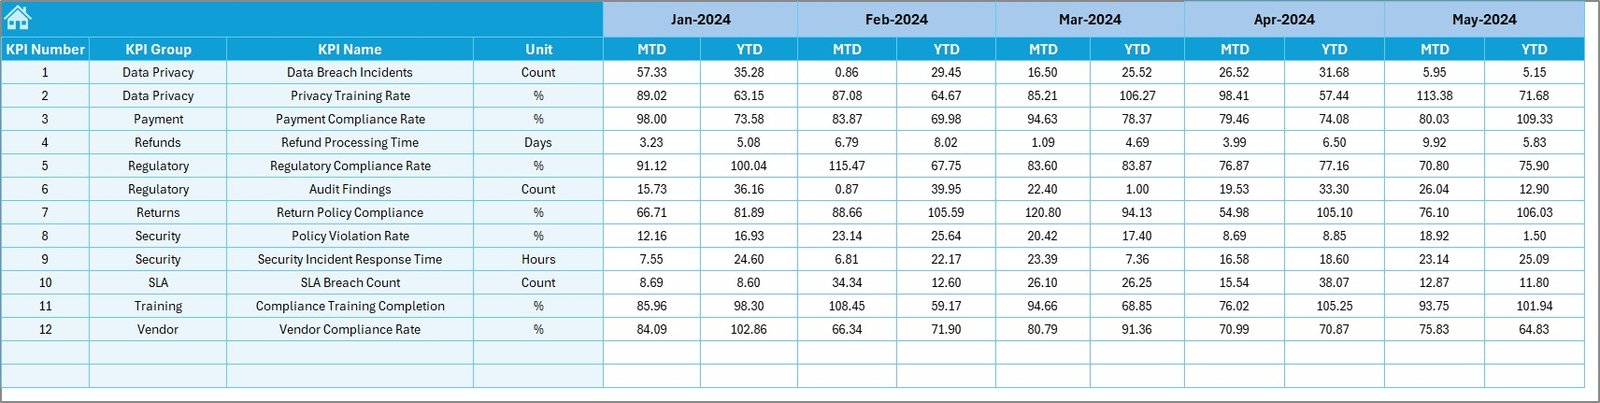
- Enter monthly and YTD target values for each KPI to set performance benchmarks.
Previous Year Numbers Sheet
- Input historical KPI data for year-over-year comparisons.
KPI Definition Sheet
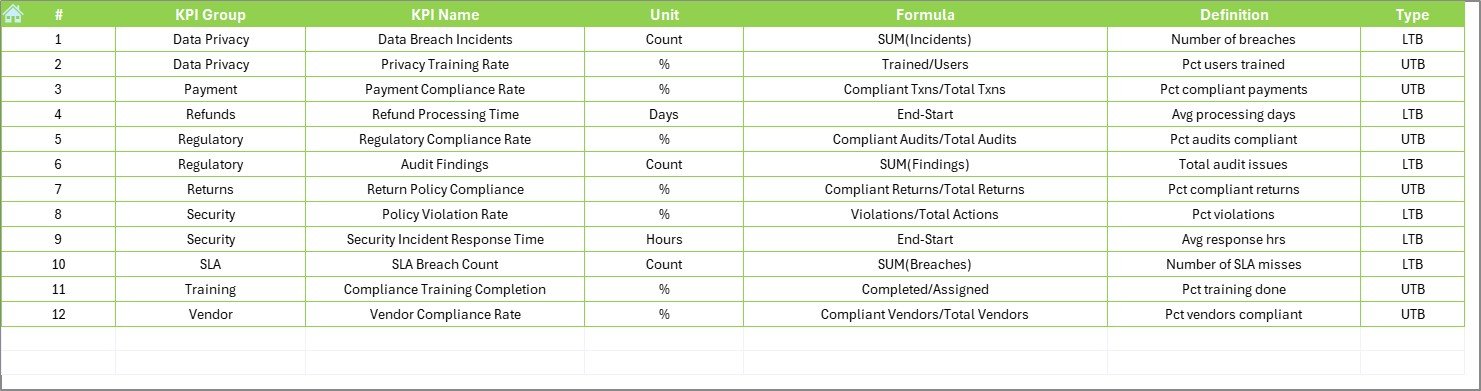
- Maintain a central list of KPI Name, KPI Group, Unit, Formula, and Definition.
By organizing the template this way, you ensure clear data flow, easy updates, and robust analytics.
Click to Purchases Retail and E-commerce Compliance KPI Dashboard in Excel
Why You Need a Compliance Dashboard
Retail and e-commerce businesses face a myriad of regulations—from product safety rules to data protection laws. Additionally, internal policies must align with strategic goals and brand reputation. Without clear visibility, you risk:
- Regulatory fines due to non-compliance.
- Reputation damage from compliance breaches.
- Operational delays when manual processes slow decision-making.
However, when you implement a compliance KPI dashboard, you gain:
- Real-time insights into performance.
- Automated tracking that reduces human error.
- Data-driven decisions that drive continuous improvement.
Therefore, a dashboard helps you stay agile, proactive, and compliant.
Advantages of Retail and E-commerce Compliance KPI Dashboard
4.1 Enhanced Visibility
A dashboard consolidates all compliance metrics in one place, so stakeholders can quickly spot trends and outliers.
4.2 Improved Accountability
With clearly defined KPIs and targets, each team member knows exactly what they need to deliver. Moreover, you can assign ownership and track progress over time.
4.3 Faster Decision-Making
You make data-driven decisions on the spot. Instead of waiting for weekly reports, you update targets, analyze performance, and implement corrective actions instantly.
4.4 Trend Analysis
By comparing MTD and YTD data against prior year values, you detect recurring issues. Consequently, you can plan process improvements and policy updates proactively.
4.5 Cost Savings
Early detection of compliance gaps reduces the risk of fines and penalties. Also, automated tracking frees up staff time to focus on strategic initiatives.
4.6 User-Friendly Interface
The template uses dropdowns, buttons, and charts to simplify navigation. Therefore, even non-technical users can interact with the dashboard effortlessly.
How to Build the Dashboard Step by Step
Follow these steps to implement the Retail and E-commerce Compliance KPI Dashboard in Excel.
1 Home Sheet Setup
- Create a new worksheet named Home.
- Add six buttons and link each to the corresponding worksheet (Dashboard, KPI Trend, Actual, Target, PY Numbers, KPI Definition).
- Label each button clearly—for example, “Go to Dashboard”.
2 Dashboard Sheet Configuration
- Insert a new sheet named Dashboard.
- In cell D3, add a data validation dropdown listing all months (Jan–Dec).
- Design a layout showing:
- MTD Actual vs. Target vs. Prior Year
- YTD Actual vs. Target vs. Prior Year
- Use
VLOOKUPorINDEX/MATCHformulas to fetch data from the Actual, Target, and PY sheets. - Apply conditional formatting rules:
- Green arrow up if Actual ≥ Target.
- Red arrow down if Actual < Target.
3 KPI Trend Analysis Sheet
- Create a sheet named KPI Trend.
- Add a dropdown in cell C3 listing all KPI Names from the KPI Definition sheet.
- Use
INDEX/MATCHto display: - KPI Group
- Unit of Measure
- KPI Type (LTB or UTB)
- Formula
- Definition
- Insert two line charts:
- Chart 1: MTD Actual, Target, PY over time.
- Chart 2: YTD Actual, Target, PY over time.
4 Actual Numbers Input Sheet
- Add a sheet called Actual Numbers Input.
- In cell E1, set the year start month.
- Create columns for:
- KPI Number
- KPI Group
- KPI Name
- Unit
- Month
- MTD Actual
- YTD Actual
- Enter sample or live data for each KPI and month.
5 Target Numbers Sheet
- Add Target Numbers sheet.
- Mirror the columns of the Actual sheet, but for MTD Target and YTD Target.
- Input your KPI targets monthly and cumulatively.
6 Previous Year Numbers Sheet
- Create Previous Year Numbers sheet.
- Use the same layout as the Actual sheet.
- Copy or import last year’s KPI data for accurate comparisons.
7 KPI Definition Sheet
Create KPI Definition sheet.
Define these columns:
KPI Number
KPI Group
KPI Name
Unit
Formula
Definition
Type (LTB or UTB)
Fill in each KPI’s metadata so formulas and dropdowns link correctly.
After you complete these steps, your dashboard becomes fully interactive and provides clear compliance insights.
Best Practices for the Retail and E-commerce Compliance KPI Dashboard
To maximize the value of your compliance dashboard, follow these best practices:
- Keep Data Updated Regularly
Update actuals, targets, and prior year data at least monthly. This practice ensures that your dashboard reflects the latest performance. - Limit the Number of KPIs
Focus on 10–12 high-impact compliance metrics. Too many KPIs dilute attention and reduce clarity. - Use Clear Naming Conventions
Standardize KPI names and groups. For example, use “Inventory Accuracy” instead of vague terms. - Automate Data Entry
Where possible, link your Excel file to your ERP or data management system. Automation reduces errors and saves time. - Validate Inputs
Use data validation rules to prevent incorrect entries. For example, only allow numeric values in MTD Actual. - Document Your Formulas
Add comments or a separate “Notes” sheet explaining complex formulas. This documentation helps future users understand the logic. - Train Your Team
Offer a quick training session on navigating and updating the dashboard. Even simple guidance increases adoption. - Review and Refine Quarterly
Compliance requirements evolve. Schedule a quarterly review to add new KPIs or remove outdated ones. - Leverage Conditional Formatting Sparingly
Excessive colors or icons can distract. Stick to two or three statuses, such as green, amber, and red. - Backup Your File
Maintain version control. Save a copy before making major changes to safeguard against accidental data loss.
Click to Purchases Retail and E-commerce Compliance KPI Dashboard in Excel
Common Mistakes to Avoid
- Overcomplicating Formulas: Keep formulas simple and modular.
- Ignoring Data Validation: Incorrect data ruins your dashboard’s reliability.
- Neglecting Historical Data: Always include prior year comparisons to spot trends.
- Using Passive Voice: Write active statements so responsibilities remain clear.
By avoiding these pitfalls, you maintain a robust and user-friendly dashboard.
8. Frequently Asked Questions (FAQs)
1. What KPIs should I include in a compliance dashboard?
Include metrics such as product compliance rate, data privacy adherence percentage, payment security exceptions, audit findings closed on time, and vendor compliance scores.
2. How often should I update my dashboard data?
Update it at least monthly. However, for critical compliance areas, consider weekly updates.
3. Can I automate the data import process?
Yes. Use Power Query or connect Excel to your database to pull data automatically.
4. How many KPIs are too many?
Aim for 10–12 KPIs. This range balances comprehensiveness with clarity.
5. Should I share the dashboard with the entire team?
Share read-only versions broadly and editable versions with authorized users only. This practice preserves data integrity.
6. What is the difference between LTB and UTB KPIs?
LTB (Lower the Better) indicates metrics where lower values are preferred (e.g., number of compliance violations). UTB (Upper the Better) indicates metrics where higher values are desired (e.g., percentage of on-time audits).
7. How do I add new KPIs to the template?
Simply add rows to the KPI Definition sheet and update the data entry sheets accordingly. Ensure dropdown lists refresh to include the new KPI.
Conclusion
Implementing a Retail and E-commerce Compliance KPI Dashboard in Excel empowers your organization to monitor, analyze, and act on compliance-related metrics effectively. By following the step-by-step setup, leveraging best practices, and avoiding common mistakes, you create a powerful tool that drives continuous improvement, reduces risk, and fosters a culture of accountability.
Click to Purchases Retail and E-commerce Compliance KPI Dashboard in Excel
Visit our YouTube channel to learn step-by-step video tutorials