Managing an office renovation project involves multiple stakeholders, tight timelines, strict budgets, and meticulous coordination. Without the right tools, project managers often struggle to track tasks, manage costs, and evaluate contractor performance. To make project monitoring simple, visual, and effective, the Office Renovation Project Dashboard in Excel serves as an all-in-one solution.
This powerful and ready-to-use Excel dashboard provides comprehensive insights into every aspect of your office renovation. From tracking departmental progress to monitoring contractor performance, this dashboard empowers you to make data-driven decisions and ensures that your project stays on track.
Click to Purchases Office Renovation Project Dashboard in Excel
Why Choose an Excel Dashboard for Office Renovation Projects?
Microsoft Excel remains a go-to tool for many project managers due to its accessibility, flexibility, and customization capabilities. With the Office Renovation Project Dashboard in Excel, you don’t need complex software or high-cost solutions. Instead, you gain a fully functional project tracking system within a tool you’re already familiar with.
Key Features of the Office Renovation Project Dashboard
This dashboard includes five interactive pages designed to deliver critical insights and simplify project management:
Overview Page
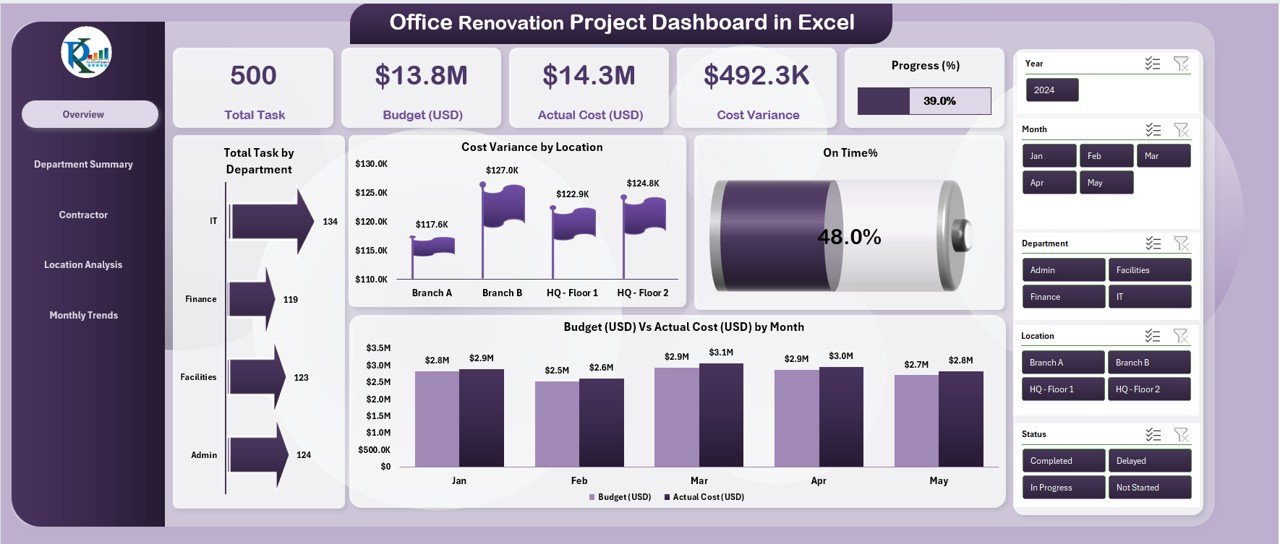
The Overview page acts as the central hub. On this page, you will find:
- A page navigator on the left for easy access to other pages
- 5 summary cards displaying high-level KPIs
4 dynamic charts:
- Total Tasks by Department
- Cost Variance by Location
- On-Time %
- Budget (USD) vs Actual Cost (USD) by Month
These visualizations give you a quick snapshot of overall performance, allowing you to stay informed at a glance.
Click to Purchases Office Renovation Project Dashboard in Excel
Department Summary Page
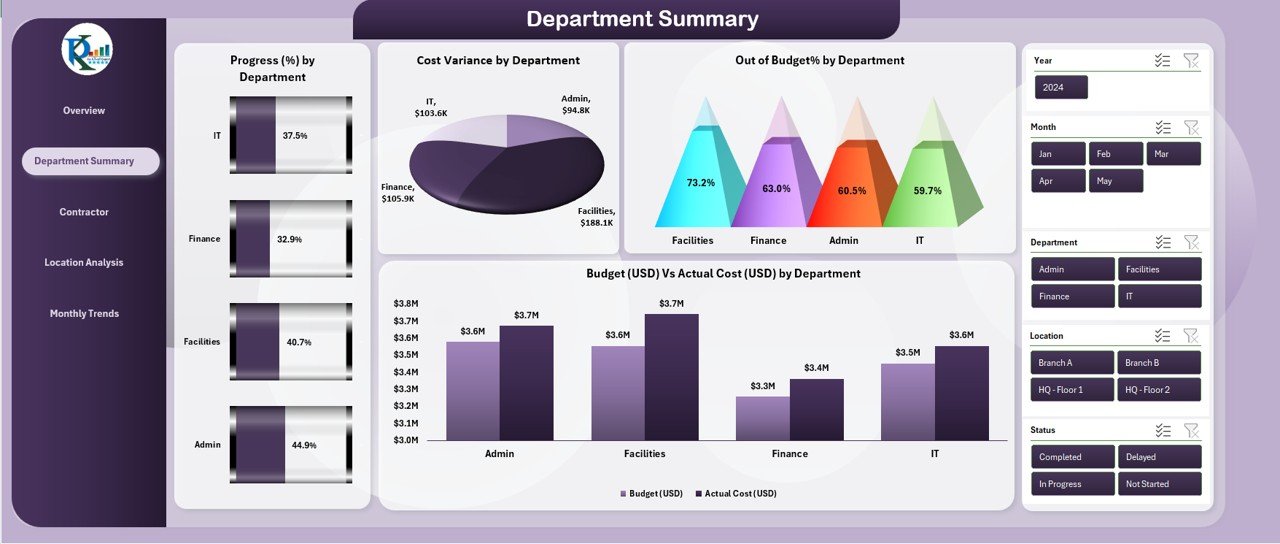
This page provides a departmental breakdown of the renovation project:
4 insightful charts:
- Progress (%) by Department
- Cost Variance by Department
- Out-of-Budget % by Department
- Budget (USD) vs Actual Cost (USD) by Department
Use this page to evaluate how well each department is adhering to the project scope and budget.
Contractor Performance Page
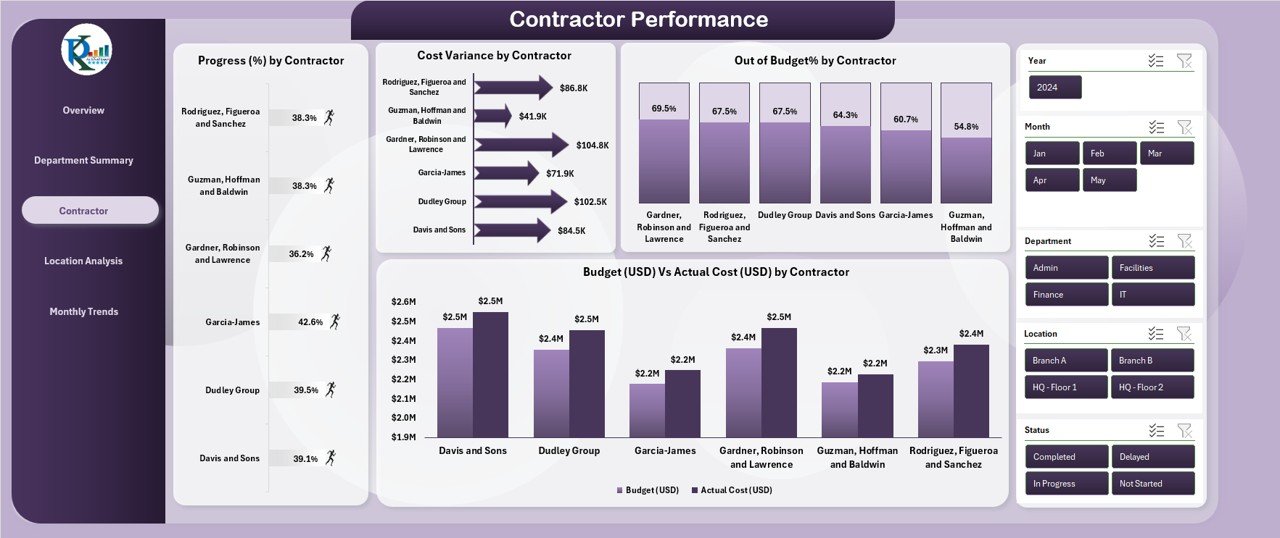
Contractors play a critical role in any renovation. This page includes:
4 detailed charts:
- Progress (%) by Contractor
- Cost Variance by Contractor
- Out-of-Budget % by Contractor
- Budget (USD) vs Actual Cost by Contractor
With these charts, you can identify top-performing contractors and those who may require closer oversight.
Location Analysis Page
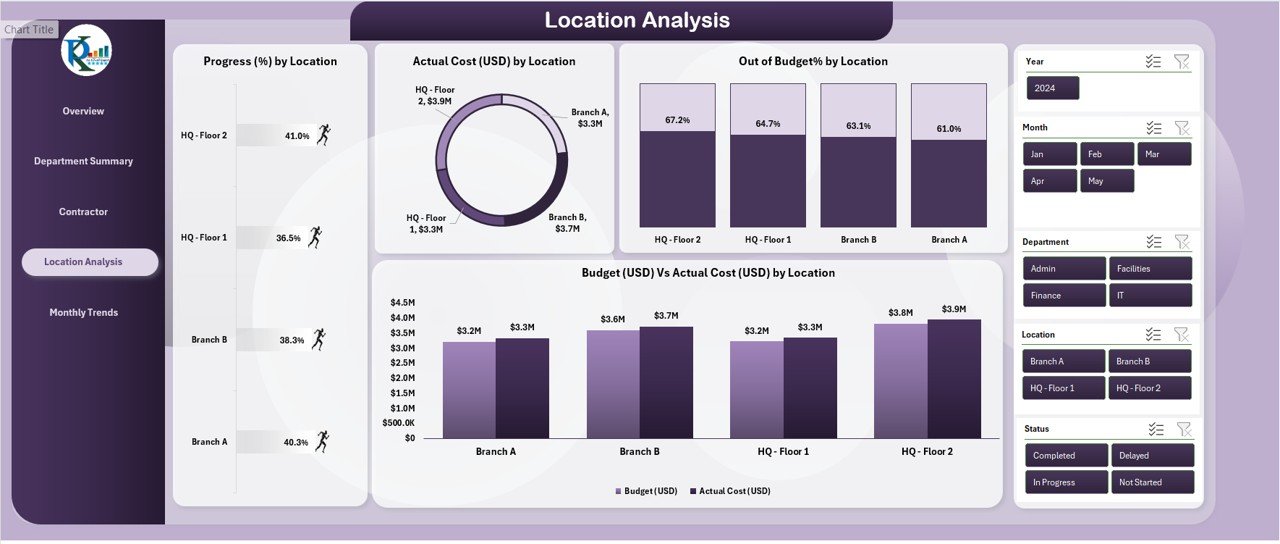
For renovation projects across multiple office locations, this page delivers location-specific analytics:
4 focused charts:
- Progress (%) by Location
- Cost Variance by Location
- Out-of-Budget % by Location
- Budget (USD) vs Actual Cost by Location
You can quickly pinpoint which locations are underperforming or over budget.
Monthly Trends Page
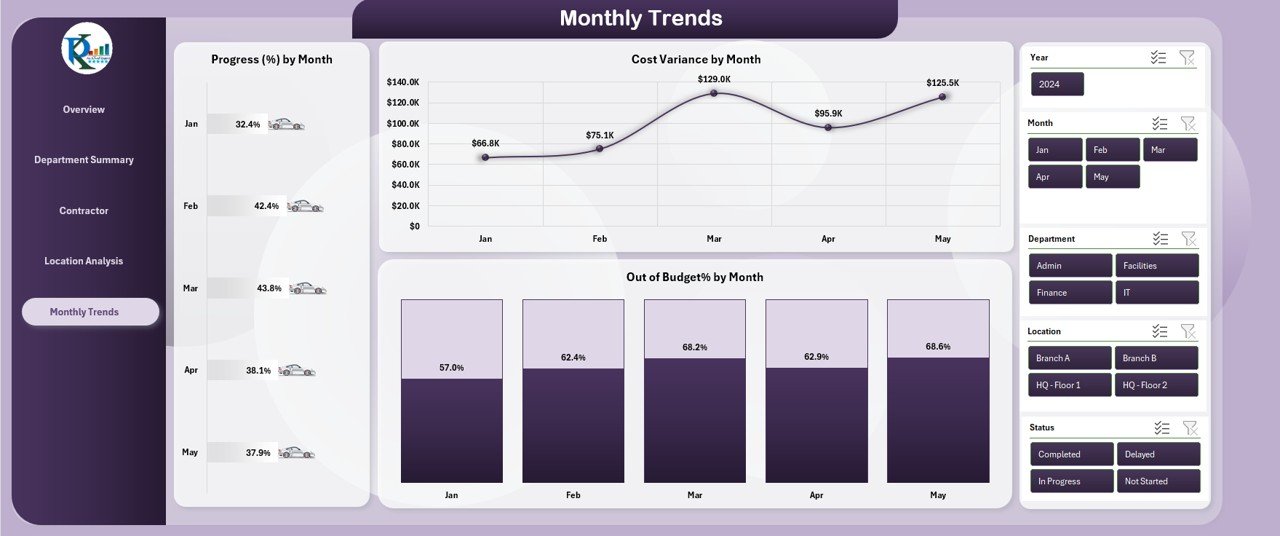
This page helps in tracking progress and financial trends over time:
4 time-series charts:
- Progress (%) by Month
- Cost Variance by Month
- Out-of-Budget % by Month
- Budget (USD) vs Actual Cost by Month
Understanding trends enables better forecasting and proactive planning.
Supporting Sheets
- Data Sheet: Contains all raw project data used to generate visuals
- Support Sheet: Houses reference lists and drop-down values to maintain data integrity
Advantages of Using the Office Renovation Dashboard
Choosing this dashboard offers a variety of benefits:
1. Time Savings
You avoid switching between multiple tools by having all project details in one place.
2. Increased Accuracy
Automated charts reduce the risk of manual calculation errors.
3. Better Decision-Making
Visual insights allow managers to act faster and smarter.
4. Improved Team Communication
Team members stay aligned with clear visibility into task progress and costs.
5. Cost Control
Detailed breakdowns help identify areas where costs exceed budgets.
Click to Purchases Office Renovation Project Dashboard in Excel
Best Practices for Using the Office Renovation Project Dashboard
To get the most out of this dashboard, follow these best practices:
1. Update Data Regularly
Ensure the Data Sheet is updated consistently to keep visuals accurate.
2. Set Clear Departmental Goals
Assign measurable goals to each department for easier progress tracking.
3. Monitor Contractor KPIs
Use contractor performance charts to hold vendors accountable.
4. Review Monthly Trends
Identify recurring issues or successes by analyzing the Monthly Trends page.
5. Use Filters and Slicers
Utilize built-in slicers to customize views by location, department, or timeline.
How to Get Started with the Dashboard
Getting started is easy. Follow these steps:
- Download the Excel Template
- Open in Excel Desktop App (Recommended)
- Go to the Data Sheet and Enter Your Project Information
- Use the Page Navigator to Explore Insights
- Customize Charts with Slicers as Needed
Within minutes, your office renovation tracking system will be up and running.
Common Challenges Solved by the Dashboard
1. Lack of Visibility
The dashboard offers complete visibility across departments and locations.
2. Budget Overruns
Cost variance and budget charts highlight budgetary issues early.
3. Missed Deadlines
Progress and On-Time % charts help teams stay on schedule.
4. Poor Contractor Performance
Contractor analytics allow you to spot and address underperformance.
Who Can Benefit from This Dashboard?
- Project Managers – for holistic project tracking
- Facilities Managers – to coordinate space updates
- Finance Teams – to monitor and control renovation budgets
- HR Teams – to stay informed about renovation schedules
- Executives – to gain high-level insights into renovation progress
Conclusion
The Office Renovation Project Dashboard in Excel turns complexity into clarity. It provides project managers and stakeholders with a powerful, visual, and easy-to-use tool for managing renovation projects from start to finish. With department-wise tracking, contractor monitoring, location analysis, and trend visualization, this dashboard offers everything you need to ensure your renovation is a success.
Frequently Asked Questions (FAQs)
What software do I need to use this dashboard?
You need Microsoft Excel (preferably the desktop version) to use this dashboard effectively.
Can I customize the dashboard for different projects?
Yes, the dashboard is fully customizable. You can modify departments, contractors, and locations based on your project.
How often should I update the data?
It is recommended to update the data at least once a week or after each major project milestone.
Does this dashboard support multiple office locations?
Absolutely! The Location Analysis page is designed specifically for multi-site renovation tracking.
Can I share this dashboard with my team?
Yes, you can share it via email or a shared drive. Make sure everyone uses the same version of Excel.
Is this dashboard beginner-friendly?
Yes, it includes slicers and navigators that make it easy even for non-technical users to explore project data.
How can I track budget vs actual costs?
Each analytical page includes charts that compare budgeted and actual costs by department, contractor, location, or month.
Click to Purchases Office Renovation Project Dashboard in Excel
Visit our YouTube channel to learn step-by-step video tutorials
Watch the step-by-step video tutorial: