In today’s competitive business environment, customer satisfaction and market expansion go hand in hand. Companies that prioritize customer service while expanding into new markets enjoy greater loyalty, higher revenue, and long-term sustainability. But tracking performance in both areas isn’t easy—unless you have the right tools.
That’s where the Customer Service and Support Market Expansion KPI Dashboard in Excel comes into play. This ready-to-use Excel template helps organizations measure key performance indicators (KPIs) related to service quality and business growth. Whether you’re a small business owner or a corporate manager, this dashboard helps you stay informed, proactive, and strategic.
Click to Purchases Customer Service and Support Market Expansion KPI Dashboard in Excel
What Is the Customer Service and Support Market Expansion KPI Dashboard?
This Excel dashboard is a comprehensive tool designed to track, analyze, and visualize service-related KPIs that influence market growth. It gives a clear picture of how your customer support initiatives are performing and whether they are driving expansion across regions, products, or segments.
The dashboard contains seven key worksheet tabs, each with a specific purpose. Together, they offer a seamless workflow from data input to insightful analytics and visualization.
Key Components of the Dashboard
Let’s explore the seven essential worksheet tabs that make up the template:
Home Sheet
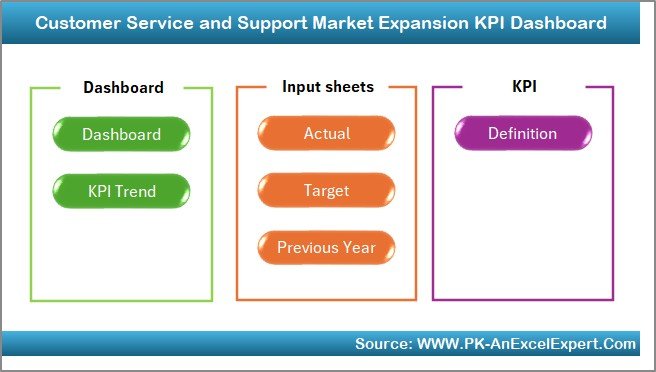
This is the command center of your dashboard. It provides an index-like interface with six navigation buttons that instantly take you to any of the key worksheets. This ensures an easy and user-friendly experience.
Dashboard Sheet
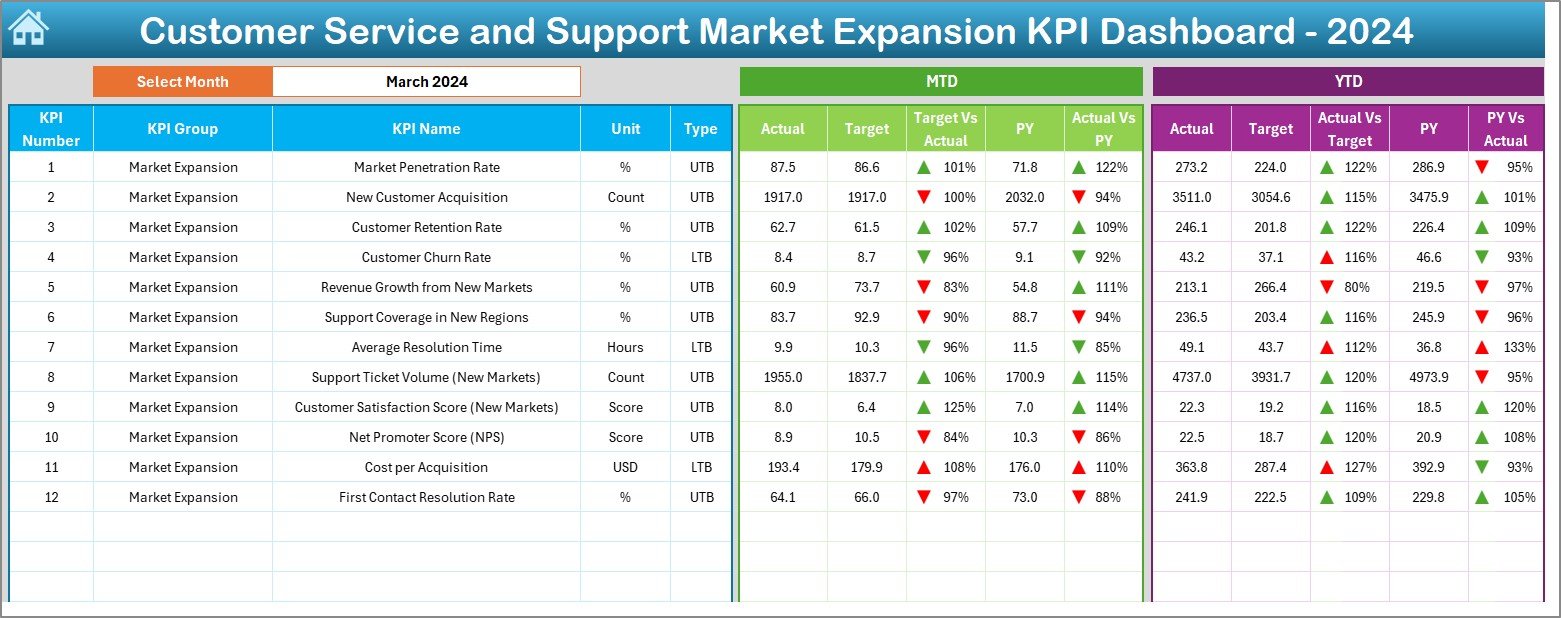
This is the heart of the entire dashboard. Here, you can:
-
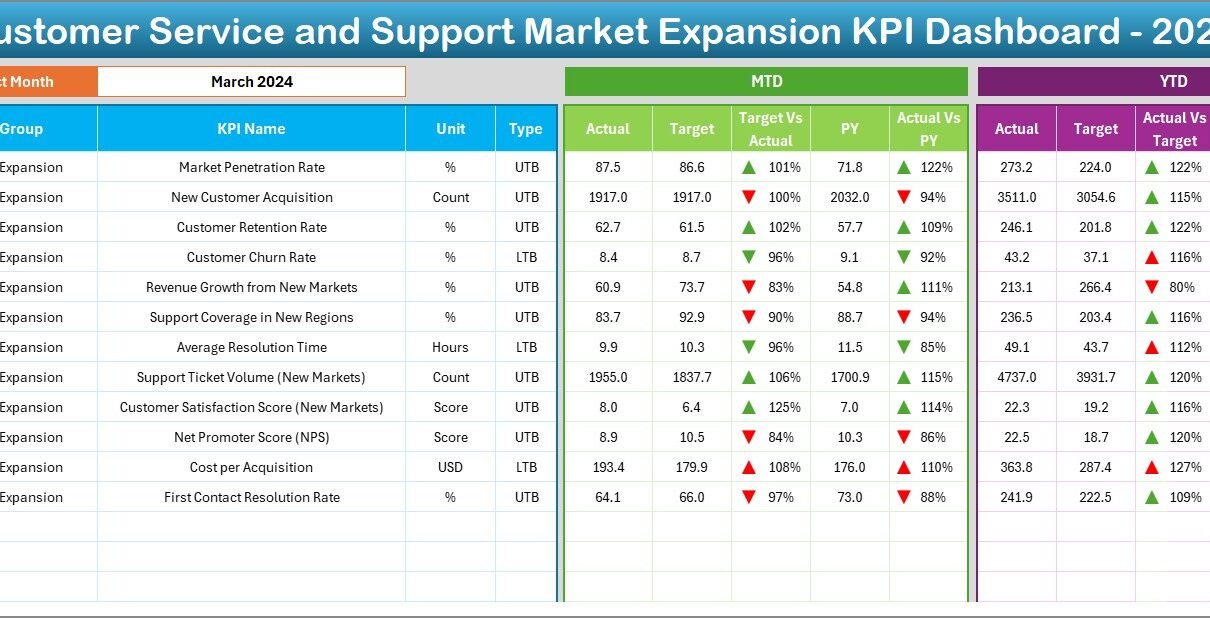
Select a Month from a dropdown (cell D3) to filter all visuals and data.
-
View MTD (Month-to-Date) and YTD (Year-to-Date) performance.
-
Compare Actuals vs. Targets and Actuals vs. Previous Year values.
-
Use conditional formatting with up/down arrows to track trends.
Metrics are auto-updated based on the selected month, helping you make timely decisions.
Click to Purchases Customer Service and Support Market Expansion KPI Dashboard in Excel
KPI Trend Sheet
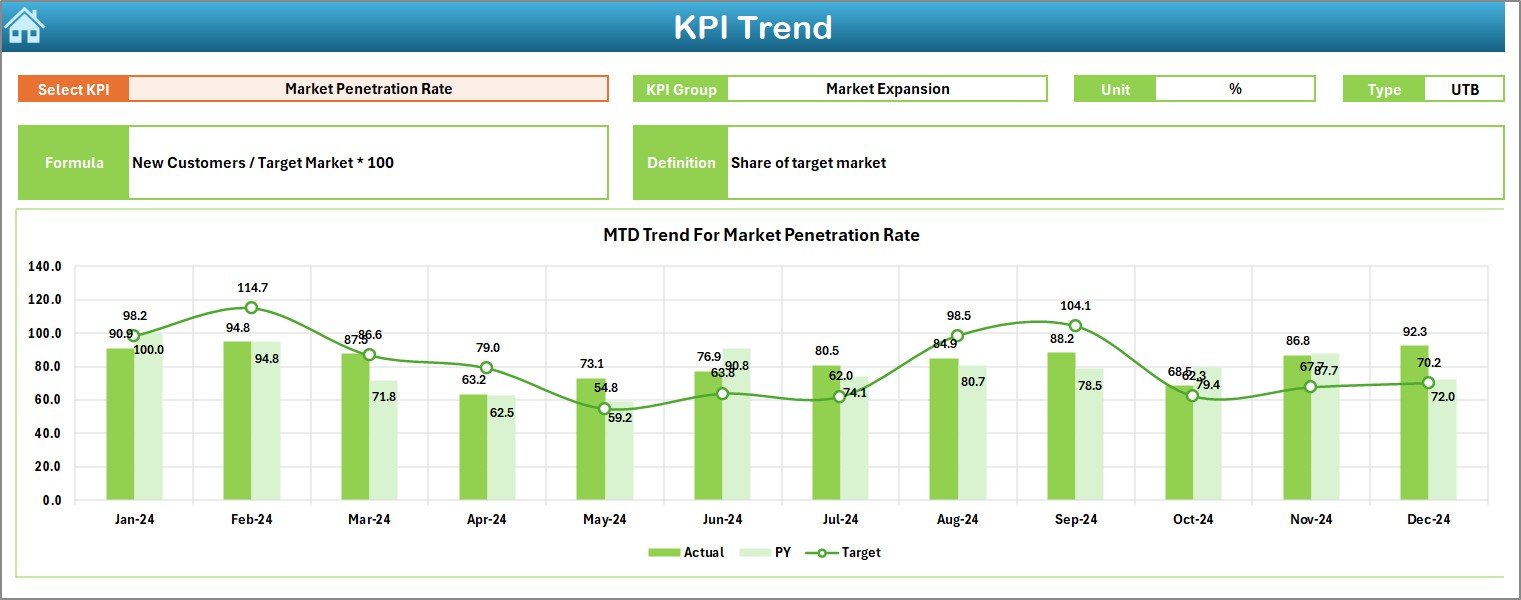
This sheet gives deeper insight into each KPI’s behavior over time. Features include:
-
Dropdown to select any KPI (cell C3)
-
Auto-display of KPI Group, Unit, Type (UTB or LTB), Formula, and Definition
-
Line charts showing monthly trends for Actual, Target, and Previous Year values (both MTD and YTD)
This tab is great for identifying patterns and forecasting future performance.
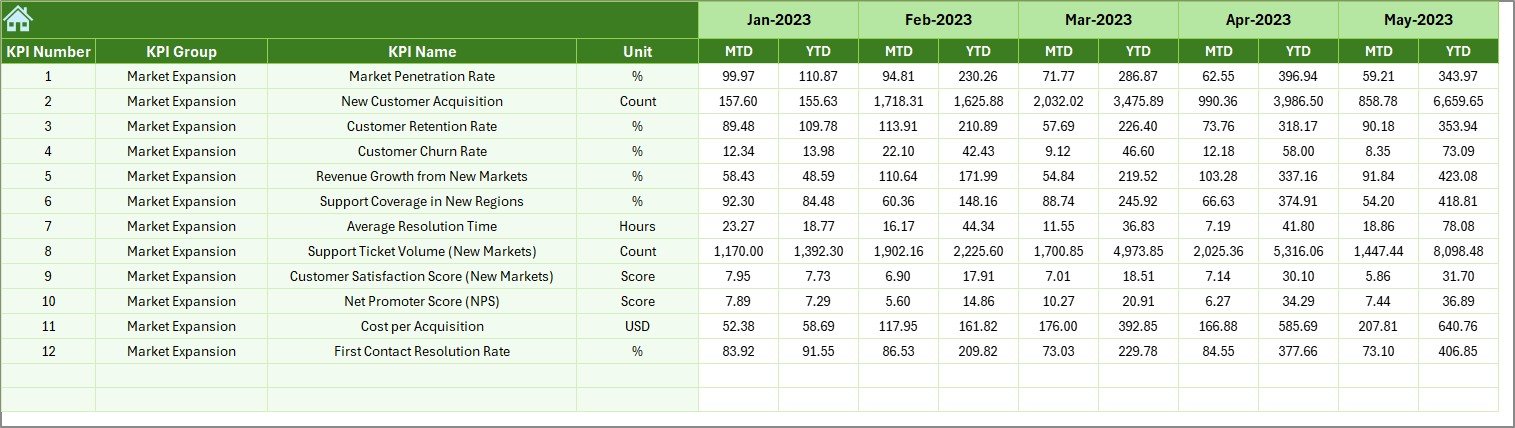
Actual Numbers Input Sheet
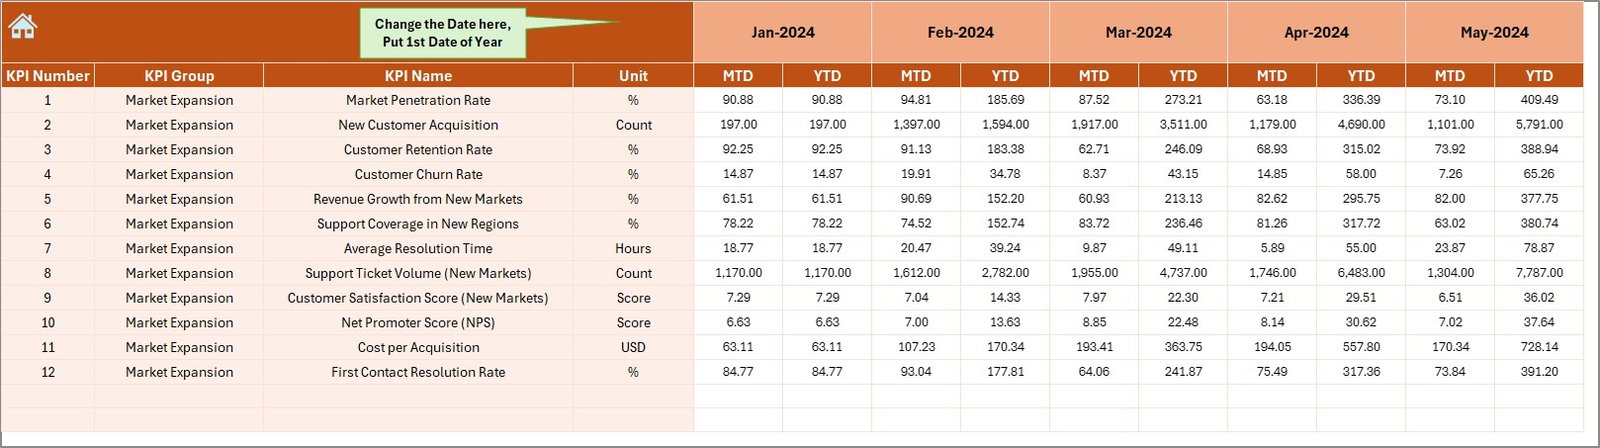
Your dashboard is only as accurate as your data. This sheet is where you:
-
Input monthly Actual figures
-
Define the start of the fiscal year in cell E1
-
Add data for both MTD and YTD KPIs
The sheet drives the backend engine of your dashboard.
Target Sheet
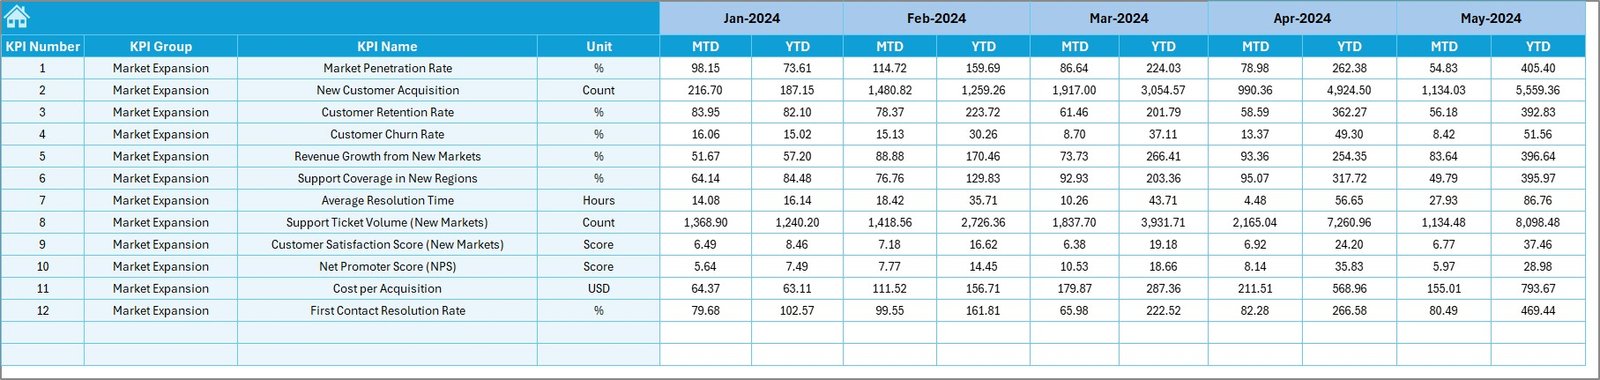
Set your performance goals here. Enter both MTD and YTD targets for every KPI and month. These targets feed directly into the Dashboard and KPI Trend sheets for real-time gap analysis.
Click to Purchases Customer Service and Support Market Expansion KPI Dashboard in Excel
Previous Year Numbers Sheet
Input previous year values for the same KPIs, allowing you to analyze year-over-year growth or decline. These numbers appear alongside Actuals and Targets for comparison.
KPI Definition Sheet
This documentation tab defines:
-
KPI Name
-
KPI Group
-
Unit of measurement
-
Formula
-
Short definition
-
Type: UTB (Upper the Better) or LTB (Lower the Better)
This ensures consistent understanding across teams.
Why You Need This Dashboard
Market expansion doesn’t just depend on marketing or sales—it relies heavily on customer service quality. When you enter new territories or segments, your support structure must scale accordingly.
This dashboard helps you:
-
Monitor customer service effectiveness
-
Track support KPIs aligned with business growth
-
Pinpoint strengths and weaknesses in service delivery
-
Align customer expectations with company goals
-
Identify new market opportunities through performance insights
Advantages of Using This KPI Dashboard
Let’s break down the top benefits:
📌 All-in-One View
Get a unified snapshot of customer support performance and market growth KPIs in one place.
📌 Time-Saving Automation
Dropdowns, formulas, and dynamic charts make analysis quick and simple.
📌 Performance Comparison
Compare Actuals against Targets and Previous Year metrics to identify gaps and opportunities.
📌 Customization-Friendly
Easily update KPIs, formulas, and visuals to align with your specific business goals.
📌 Professional Visuals
Impressive layout, easy navigation, and visually rich charts make this template ideal for boardroom presentations.
Best Practices for Using the Dashboard
Follow these best practices to maximize your results:
✅ Keep data consistent: Update actuals and targets at the same time each month.
✅ Use realistic KPIs: Set achievable targets to avoid false positives or negatives.
✅ Track trends, not just numbers: Use the KPI Trend tab to observe patterns.
✅ Review definitions: Regularly validate KPI definitions with stakeholders to ensure alignment.
✅ Set alerts: Use conditional formatting (up/down arrows) to quickly flag red zones.
✅ Backup regularly: Maintain version control to avoid data loss or overwrites.
Key KPIs to Track for Market Expansion
Here are some critical KPIs that you can include in your dashboard:
-
Customer Retention Rate
-
Customer Satisfaction Score (CSAT)
-
First Response Time
-
Average Resolution Time
-
New Customers Acquired
-
Support Tickets by Region
-
Ticket Escalation Rate
-
Revenue per Customer
-
Support Coverage Hours
-
Net Promoter Score (NPS)
-
Support Cost per Ticket
-
Repeat Contact Rate
Each of these metrics ties directly into both service quality and business growth.
How to Customize the Dashboard for Your Business
Click to Purchases Customer Service and Support Market Expansion KPI Dashboard in Excel
Even though the dashboard is pre-built, you can personalize it based on your industry or expansion plan. Here’s how:
-
Modify KPIs to reflect service goals relevant to your company
-
Change timeframes to match quarterly or weekly reporting
-
Add filters by region, product, or customer type
-
Incorporate segmentation to track enterprise vs. individual accounts
-
Integrate with CRM systems using Excel’s Power Query or third-party tools
Tools and Formulas Used
This Excel dashboard uses a combination of:
-
Data validation lists (for dropdowns)
-
IF and VLOOKUP formulas
-
Conditional formatting (icons and colors)
-
Line and bar charts (for trends)
-
Dynamic named ranges (for scalable inputs)
-
INDEX-MATCH functions
-
Pivot Tables (for KPI grouping)
No VBA is required, so the dashboard remains lightweight and secure.
Use Case Scenarios
Let’s explore how different teams might use this:
💼 For Customer Support Managers
-
Track and reduce resolution times
-
Improve SLA adherence
-
Enhance agent performance
🌍 For Expansion Teams
-
Measure support success in new markets
-
Compare regional performance
-
Justify budget and headcount changes
📊 For Executives
-
Get monthly performance snapshots
-
Forecast growth opportunities
-
Drive decisions based on data
🧭 How to Get Started
-
Download the template
-
Enter KPI definitions
-
Set monthly targets
-
Input previous year data
-
Add actual MTD/YTD numbers
-
Start tracking and reviewing regularly
The dashboard will automatically update all visuals and performance indicators.
Final Thoughts
Customer service plays a powerful role in expanding markets. As companies grow, they must ensure that their support systems grow with them. The Customer Service and Support Market Expansion KPI Dashboard in Excel empowers you with the data and insights you need to succeed.
By consistently monitoring and analyzing KPIs, you can boost satisfaction, improve service, and scale efficiently into new markets—all while staying aligned with strategic business goals.
❓Frequently Asked Questions (FAQs)
1. What is a Market Expansion KPI Dashboard?
A Market Expansion KPI Dashboard is a tool used to track performance metrics related to growing your business into new markets, regions, or customer segments, with a strong focus on service and support.
2. Can I customize the KPIs in this dashboard?
Yes. You can add, remove, or modify KPIs based on your company’s goals. Just update the KPI Definition and relevant data input sheets.
3. Is this dashboard suitable for small businesses?
Absolutely. It’s designed to work for companies of any size. Small businesses can especially benefit by using this tool to set structured service goals and measure progress over time.
4. How often should I update the dashboard?
You should update it monthly, especially after closing your books for the previous month. This ensures accuracy and trend consistency.
5. Do I need Excel expertise to use it?
Basic Excel skills are enough. The dashboard uses user-friendly formulas and charts. No advanced coding or macros are needed.
6. Can I link this dashboard to my CRM?
Yes. You can connect Excel with CRM tools using Power Query or data exports. This way, you can automate data entry for actual KPIs.
7. What if my fiscal year doesn’t start in January?
No problem. Just enter the start month in the Actual Numbers Input sheet (cell E1), and the dashboard will adjust accordingly.
Visit our YouTube channel to learn step-by-step video tutorials