Energy consumption is a critical factor in managing the operational costs of any office. With increasing global concerns over environmental sustainability and cost management, companies are focusing more on monitoring their energy usage. Power BI, one of the leading business analytics tools, offers robust solutions to track energy consumption effectively. In this article, we’ll dive deep into the Office Energy Consumption Dashboard in Power BI, a powerful tool designed to help organizations track, manage, and reduce energy consumption across their offices.
Click to Purchases Office Energy Consumption Dashboard in Power BI
What is the Office Energy Consumption Dashboard in Power BI?
The Office Energy Consumption Dashboard in Power BI is a data-driven tool that integrates seamlessly with Excel data. It provides a comprehensive overview of the energy consumption patterns within an office environment. This dashboard is designed to give businesses a clear and concise view of their energy usage across various departments, locations, energy sources, and time periods, making it easier to analyze and optimize energy consumption.
The dashboard comes with five distinct pages, each offering specific insights into different aspects of office energy management. Whether you want to track energy consumption by department, location, or energy source, this dashboard has you covered.
Key Features of the Office Energy Consumption Dashboard in Power BI
The Office Energy Consumption Dashboard in Power BI is packed with features that make tracking and managing energy usage simple and insightful. Let’s explore the key features that make this dashboard a valuable tool for office managers and business analysts.
Overview Page
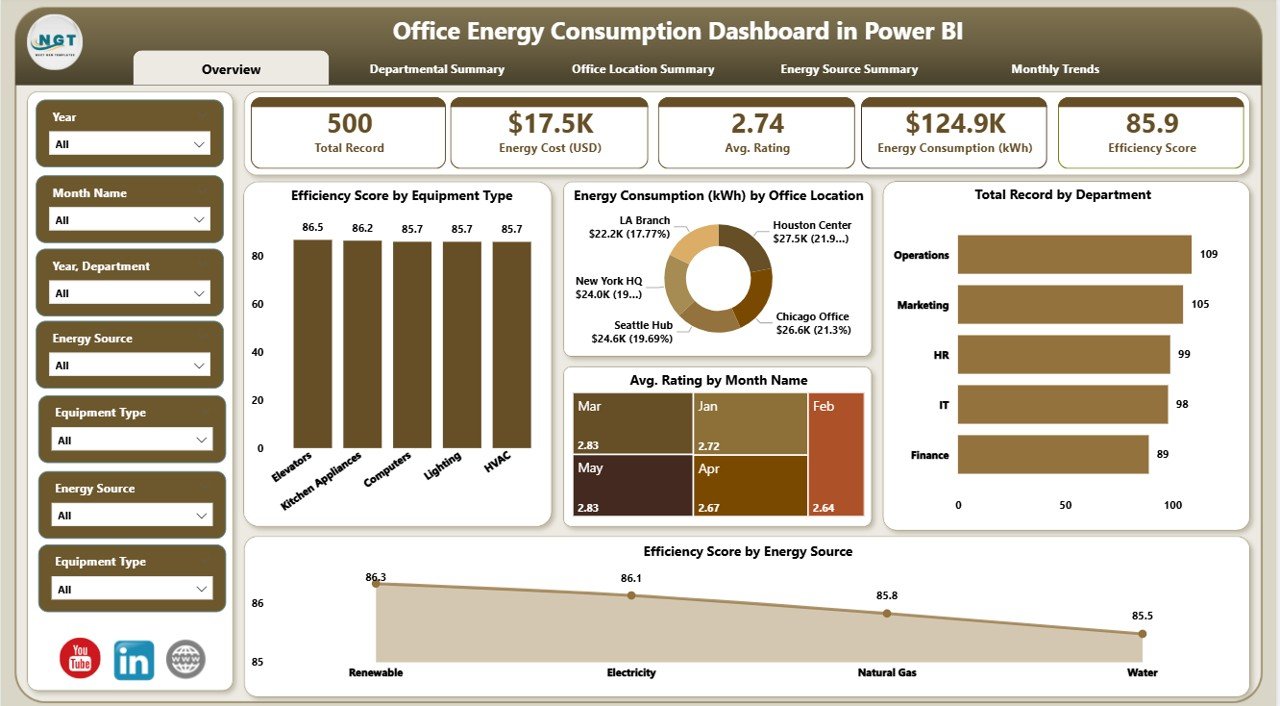
The Overview Page serves as the main dashboard where users can get a quick snapshot of the overall energy usage within the office. Here, you will find:
-
Seven Slicers: These allow users to filter the data by various parameters.
Five Key Cards: These cards display crucial metrics such as:
- Number of Requests by Requestor
- Number of Requests by Category
- Number of Requests by Status
The Overview Page is designed to give you an instant, high-level view of your energy consumption data and status.
Departmental Summary
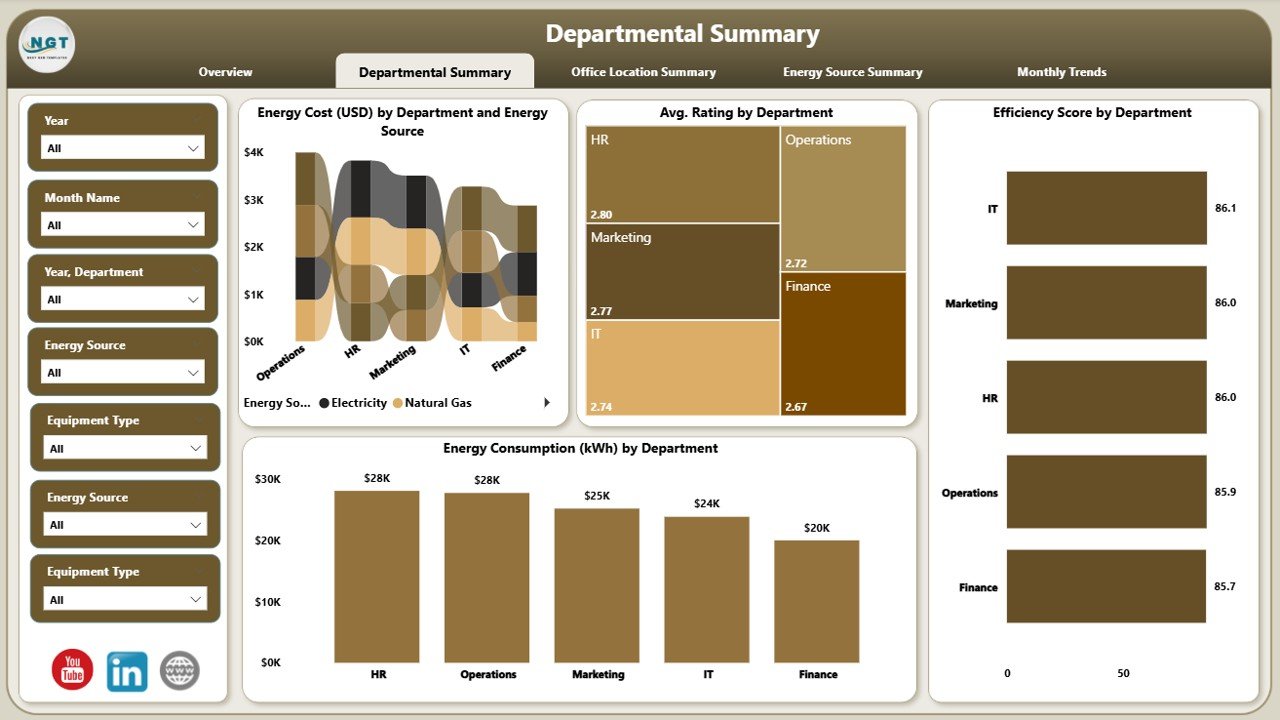
The Departmental Summary page provides detailed insights into energy usage across different departments. Key elements include:
-
Seven Slicers: For easy filtering and customization.
Four Charts:
- Energy Cost (USD) by Department
- Energy Source by Department
- Average Rating by Department
- Energy Consumption (kWh) by Department
- Efficiency Score by Department
This page allows you to understand which departments are consuming the most energy and provides an efficiency score for each department, enabling targeted energy-saving strategies.
Office Location Summary
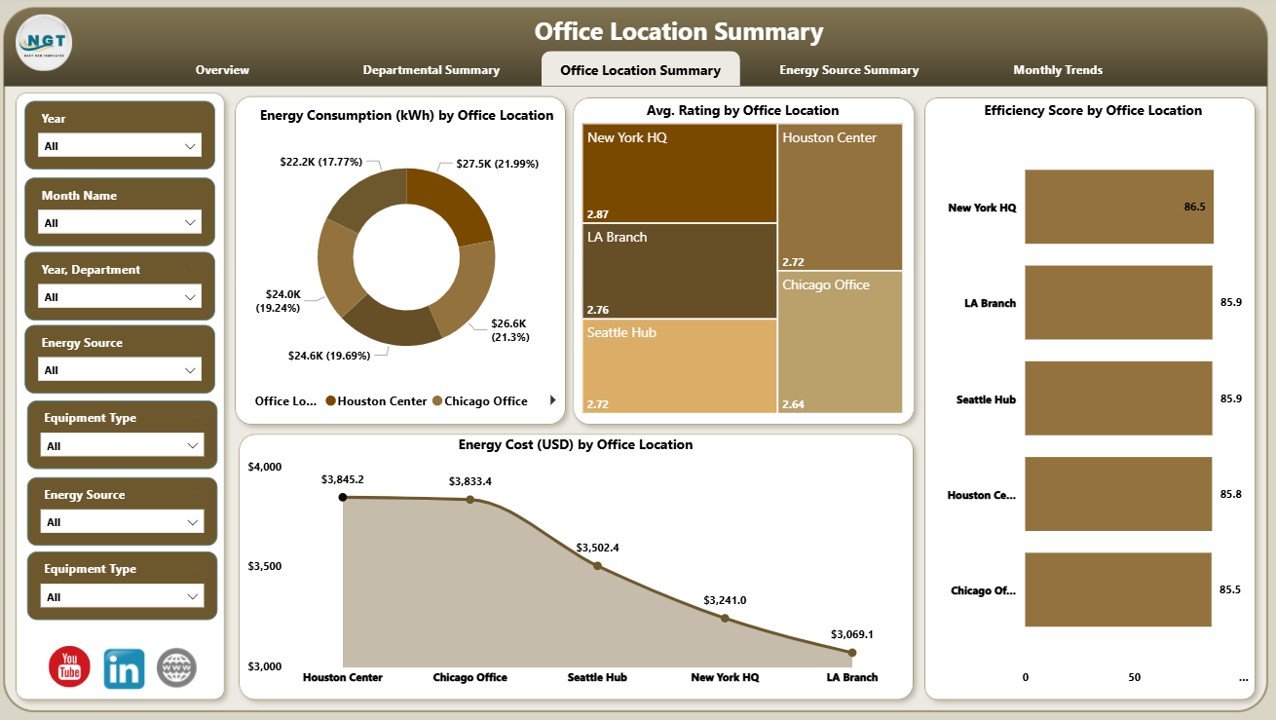
The Office Location Summary page focuses on energy consumption across various office locations. Key features include:
-
Seven Slicers: These make it easy to filter by different locations.
Click to Purchases Office Energy Consumption Dashboard in Power BI
Four Charts:
- Energy Consumption (kWh) by Office Location
- Average Rating by Office Location
- Efficiency Score by Office Location
- Energy Cost (USD) by Office Location
This page is invaluable for companies with multiple office locations, as it provides insights into which locations are more energy-efficient and which may require more attention.
Energy Source Summary
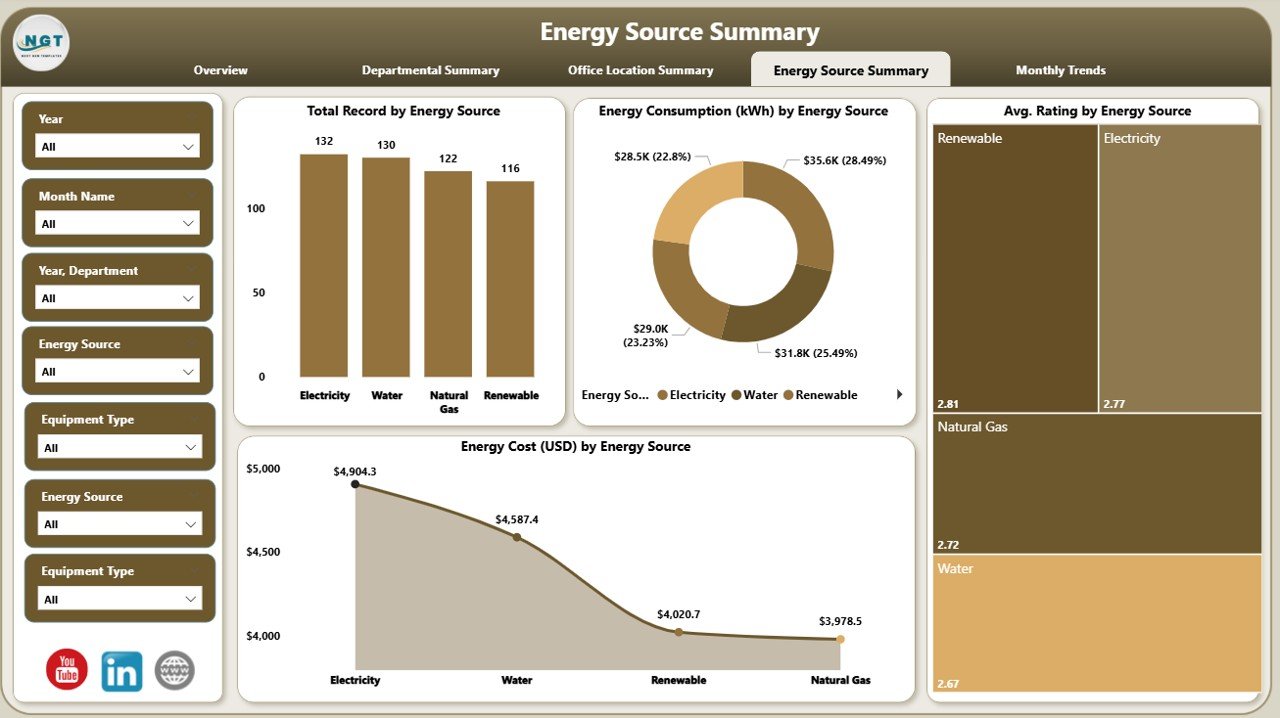
The Energy Source Summary page offers detailed information about the energy sources used within the office. The page includes:
-
Seven Slicers: For filtering the data based on different energy sources.
Four Charts:
- Total Record by Energy Source
- Energy Consumption (kWh) by Energy Source
- Average Rating by Energy Source
- Energy Cost (USD) by Energy Source
This page helps businesses identify their primary energy sources and optimize their energy strategies based on usage patterns and cost.
Monthly Trends
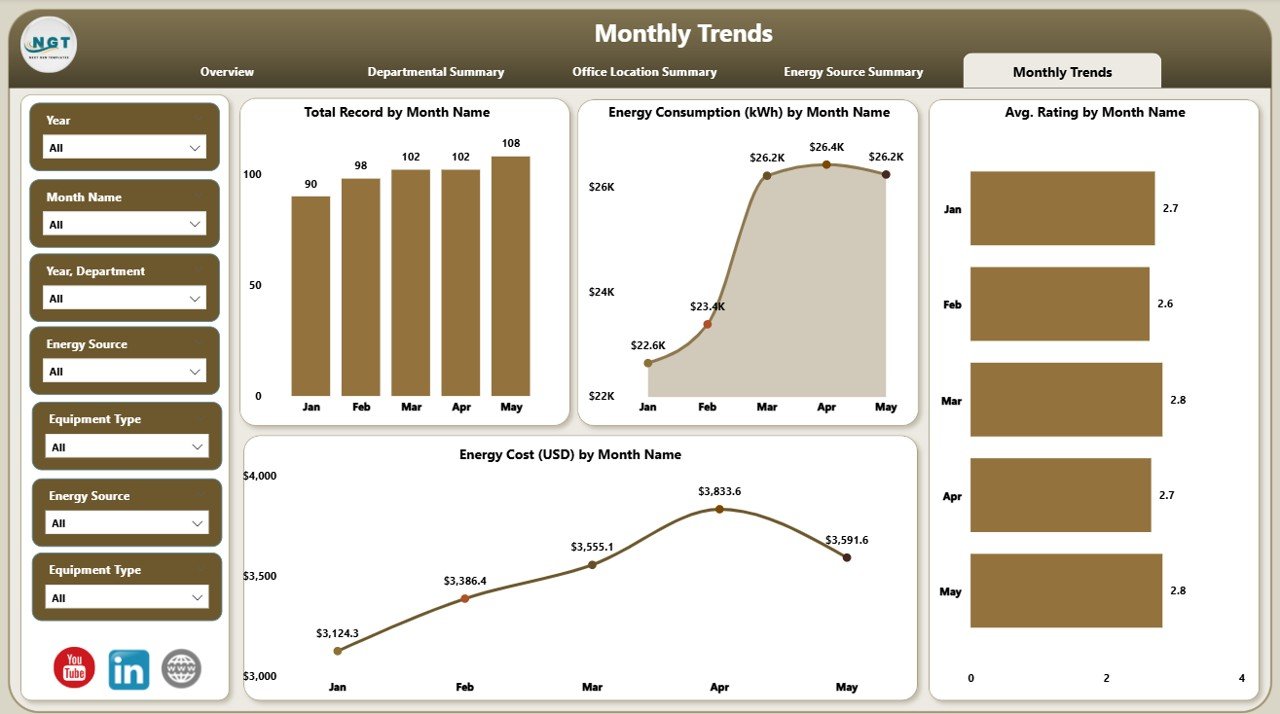
The Monthly Trends page is designed to track the office’s energy consumption over time. Key features include:
-
Seven Slicers: These allow for detailed filtering by month.
Two Key Charts:
- Total Record by Month Name
- Energy Consumption (kWh) by Month Name
- Average Rating by Month Name
- Energy Cost (USD) by Month Name
This page is ideal for tracking energy trends throughout the year and helps businesses predict future energy consumption patterns.
Advantages of Using the Office Energy Consumption Dashboard in Power BI
1. Enhanced Decision-Making
With real-time data visualization, this dashboard helps business leaders and office managers make informed decisions. By analyzing trends, locations, departments, and energy sources, they can identify areas where energy consumption can be reduced, leading to better decision-making.
2. Cost Savings
One of the most significant benefits of using the Office Energy Consumption Dashboard is its ability to pinpoint areas where energy is being wasted. By recognizing patterns and inefficiencies, businesses can implement cost-saving strategies, such as adjusting heating and cooling settings, optimizing lighting, or choosing more efficient equipment.
3. Sustainability
This dashboard helps businesses take steps toward reducing their carbon footprint. By tracking energy consumption patterns and identifying areas for improvement, companies can implement greener practices and contribute to environmental sustainability.
4. Increased Efficiency
The dashboard provides an efficiency score, allowing businesses to track which departments, locations, or energy sources are performing better in terms of energy usage. This can help promote energy-saving practices across the organization.
5. Centralized Reporting
Power BI allows you to consolidate all your energy-related data into one centralized location. This makes reporting and monitoring much easier compared to traditional methods of tracking energy consumption.
Best Practices for Using the Office Energy Consumption Dashboard in Power BI
To get the most out of your Office Energy Consumption Dashboard in Power BI, follow these best practices:
1. Regular Data Updates
Ensure that your energy data is updated regularly to get the most accurate insights. Power BI allows easy integration with Excel, so make sure your data is synced to reflect real-time changes.
2. Set Energy Targets
Use the dashboard to set monthly or quarterly energy consumption targets for different departments or office locations. This can help motivate teams to reduce energy consumption and achieve sustainability goals.
3. Analyze Trends Over Time
By using the Monthly Trends page, you can monitor long-term trends in energy consumption. Identifying seasonal patterns allows you to forecast energy usage and plan for potential energy-saving actions in advance.
4. Leverage Slicers for Customization
The slicers in the dashboard allow for easy filtering by different criteria (such as department, location, or energy source). Use them to drill down into the data and gain more specific insights.
5. Train Employees on Energy Efficiency
Along with using the dashboard, ensure your employees understand the importance of energy efficiency. Conduct training sessions and encourage them to follow best practices in reducing energy consumption.
Frequently Asked Questions (FAQs)
What is the Office Energy Consumption Dashboard in Power BI?
The Office Energy Consumption Dashboard in Power BI is a tool that helps businesses track, analyze, and optimize energy consumption across different departments, locations, and energy sources.
How does the dashboard help reduce energy costs?
By providing detailed insights into energy usage, the dashboard helps businesses identify areas where energy is being wasted and take corrective actions to reduce costs.
Can I customize the dashboard to fit my company’s needs?
Yes, the dashboard can be customized using Power BI’s slicers and other features, allowing you to filter and visualize data based on your specific business requirements.
What kind of data do I need to use this dashboard?
The dashboard works with energy consumption data captured in Excel. You can import this data into Power BI and use it to populate the various pages of the dashboard.
Is the dashboard suitable for multi-location businesses?
Yes, the dashboard is perfect for businesses with multiple locations, as it provides detailed insights into energy usage at each office location.
Conclusion
The Office Energy Consumption Dashboard in Power BI is a comprehensive and user-friendly tool designed to help businesses monitor and optimize their energy usage. By leveraging the insights provided by this dashboard, companies can reduce energy costs, improve efficiency, and contribute to environmental sustainability. Whether you’re managing a single office or multiple locations, this dashboard gives you the power to make data-driven decisions that have a lasting impact on your bottom line
Visit our YouTube channel to learn step-by-step video tutorials