In today’s competitive business environment, having an efficient way to track sales performance is crucial. With sales targets being a primary measure of success, organizations need to ensure that they have the right tools to monitor their sales progress. One of the best solutions is using a Sales Target Report in Excel. This guide will explore the features, advantages, and best practices for creating and using a Sales Target Report in Excel.
What is a Sales Target Report in Excel?
A Sales Target Report in Excel is a dynamic tool designed to help businesses track and manage their sales performance. It offers a visual representation of sales data, helping sales teams and managers evaluate progress toward meeting sales goals. The report is typically broken down by regions, products, and time periods, allowing for detailed analysis.
Why is a Sales Target Report Important?
Click to Purchases Sales Target Report in Excel
Tracking sales targets is critical for:
-
Measuring Performance: The report helps businesses track how well they are meeting their set targets.
-
Decision Making: Accurate sales data allows decision-makers to adjust strategies.
-
Identifying Trends: It provides insights into performance trends across products and regions.
-
Motivating Sales Teams: Clear visualization of target achievements can motivate teams to perform better.
Key Features of the Sales Target Report in Excel
The Sales Target Report in Excel is packed with features that enhance its utility and provide a clear overview of sales performance. Here are some of the key features that make it effective:
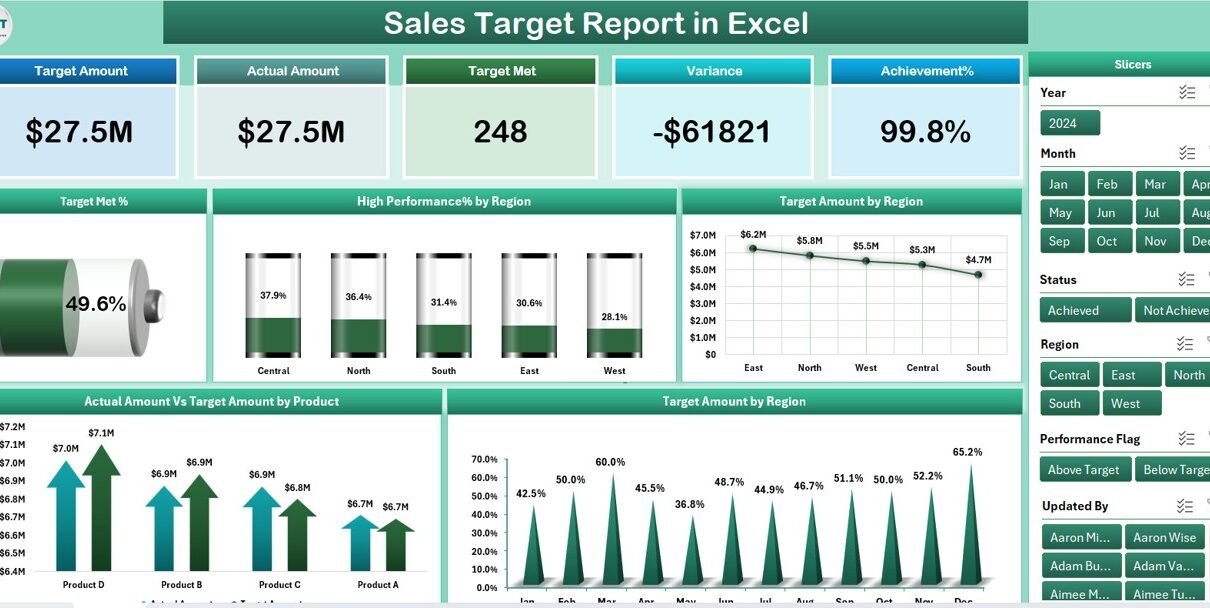
Summary Page
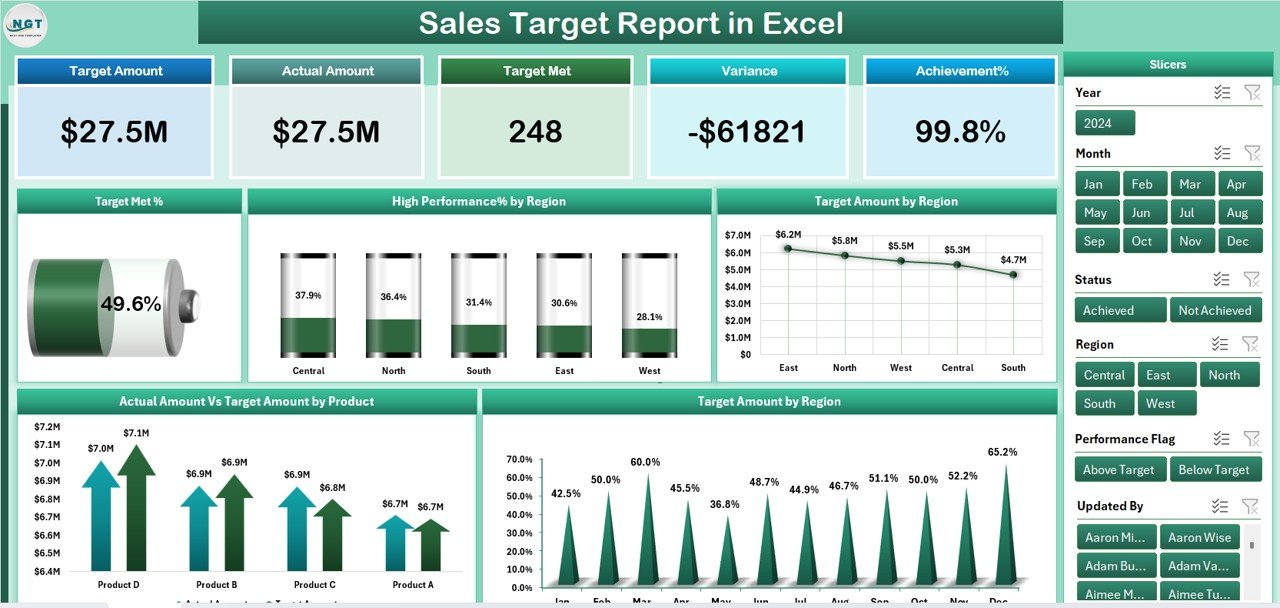
The Summary Page serves as the main page of the report, offering a high-level overview of key sales metrics. Key components include:
-
Top 5 Cards: These cards display critical sales figures, such as total sales, target achievement percentage, high-performance percentage, and more.
-
Slicers on the Right: These slicers allow users to filter the report based on various criteria such as region, product, and date range.
Charts: There are 5 charts that provide a visual representation of the following data:
- Target Met %: Displays the percentage of sales target achieved.
- High-Performance % by Region: Highlights high-performance regions.
- Target Amount by Region: Visualizes the sales target by region.
- Actual Amount vs Target Amount by Product: Shows how actual sales compare to targets for each product.
- Target Amount by Region: A detailed breakdown of target amounts across regions.
Report Page
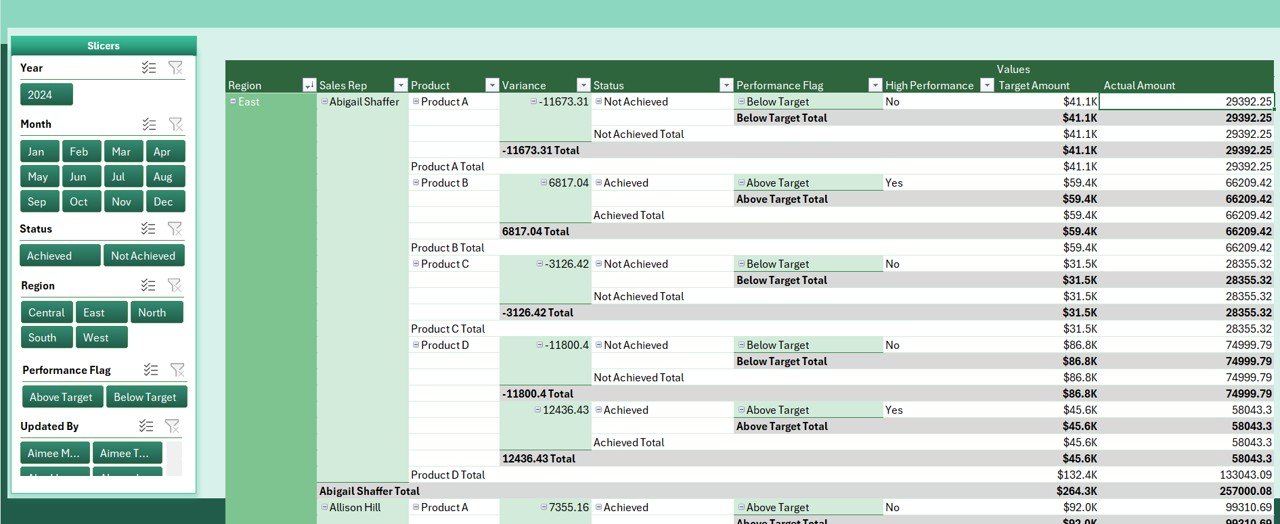
The Report Page offers more detailed data:
-
Slicer on the Lift Side: Allows further filtering of data.
-
Information Table: Displays detailed sales data, including sales numbers, targets, and progress metrics.
Data Sheet
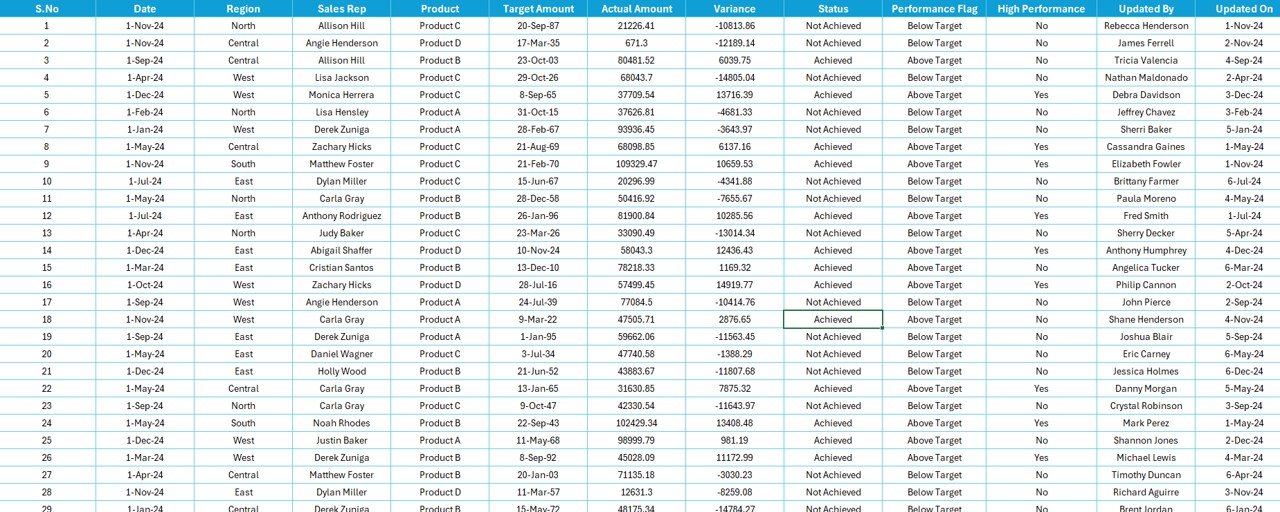
The Data Sheet contains all the raw data used to generate the reports. It includes:
-
Sales Data: Records of actual sales made within a given period.
-
Target Data: The goals set for each product, region, and timeframe.
-
Product Information: A breakdown of each product’s sales performance.
Support Sheet

The Support Sheet provides additional data and references to help with calculations and analysis. This sheet is used for:
-
Reference Data: Such as currency exchange rates, product categories, or other information that supports the sales analysis.
-
Validation: Ensures that all the data entered into the report is accurate and up-to-date.
Advantages of Using a Sales Target Report in Excel
There are several key advantages to using a Sales Target Report in Excel:
1. Easy to Customize
Excel is highly flexible, allowing businesses to tailor their Sales Target Report according to their specific needs. Users can modify the layout, add new data fields, and adjust formulas to better match their sales processes.
2. Visual Insights
With its charts and graphs, the Sales Target Report in Excel provides clear visual insights into how sales are tracking against targets. Visuals help managers and sales teams quickly understand performance trends, which aids in faster decision-making.
3. Data-Driven Decisions
A well-structured report in Excel enables businesses to make data-driven decisions. By analyzing sales performance regularly, teams can identify areas of improvement, track high-performing regions/products, and take proactive steps to achieve sales targets.
4. Cost-Effective
Excel is an affordable solution compared to many other business intelligence tools. Most organizations already have access to it through Microsoft Office, making it an economical choice for small and medium-sized businesses.
5. Track Multiple Metrics
The report can track multiple sales metrics simultaneously, including target achievement, regional performance, and product-specific sales. This multi-dimensional approach ensures that businesses get a comprehensive view of their sales performance.
Click to Purchases Sales Target Report in Excel
Best Practices for Using a Sales Target Report in Excel
To maximize the effectiveness of your Sales Target Report in Excel, consider these best practices:
1. Keep Data Updated
Ensure that all sales and target data is regularly updated to maintain the accuracy of your report. Set up a routine for updating the Data Sheet so that the report always reflects the most current figures.
2. Use Dynamic Filters
Take full advantage of Excel’s slicers and filters. By dynamically adjusting the view, you can analyze the data from different perspectives, such as by region, product, or time period. This flexibility allows for more detailed insights.
3. Automate Calculations
Excel offers powerful formulas and functions to automate calculations. Use formulas like SUMIFS, COUNTIFS, and IF statements to calculate metrics like Target Met % and High-Performance %. Automating these calculations reduces manual effort and ensures accuracy.
4. Include Conditional Formatting
Use conditional formatting to highlight important data points, such as:
-
Sales Above Target: Highlight cells where sales have exceeded the target.
-
Underperforming Products: Use red formatting for products that are underperforming.
This visual aid helps draw attention to critical information at a glance.
5. Regularly Review and Analyze
Schedule regular reviews of the Sales Target Report with your team. Use the insights gained from the report to adjust sales strategies, optimize performance, and ensure alignment with business goals.
Frequently Asked Questions (FAQ) about Sales Target Reports in Excel
1. What is the purpose of a Sales Target Report in Excel?
A Sales Target Report in Excel is used to track and measure sales performance against set targets. It provides valuable insights into how well a business is meeting its sales goals, broken down by region, product, and time period.
2. How can I customize the Sales Target Report in Excel?
Excel allows you to customize your report by modifying the layout, adding new data fields, and adjusting formulas. You can also create custom charts, tables, and filters to match your sales tracking needs.
3. Can the Sales Target Report in Excel be used by small businesses?
Yes, the Sales Target Report in Excel is ideal for small and medium-sized businesses due to its affordability and ease of customization. Excel is a cost-effective tool, and many businesses already have access to it.
Conclusion
A Sales Target Report in Excel is an indispensable tool for businesses looking to track and analyze their sales performance. With its customizable features, visual insights, and cost-effectiveness, it provides a comprehensive view of how well an organization is meeting its sales goals. By following the best practices outlined in this guide, businesses can optimize their sales tracking and make informed decisions that drive success.
Visit our YouTube channel to learn step-by-step video tutorials