In today’s competitive sports world, running an athletic training facility is not just about having skilled coaches or advanced equipment. It’s also about data-driven decision-making. Monitoring the right Key Performance Indicators (KPIs) can boost athletic results, streamline operations, and ensure resources are used effectively.
The Athletic Training Facility KPI Dashboard in Power BI provides a modern solution to track and visualize all essential metrics. Whether you’re managing player performance, equipment usage, or rehab success rates, this Power BI dashboard lets you analyze trends, evaluate goals, and spot gaps—all in one place.
Let’s explore how this ready-to-use dashboard transforms athletic training management and how you can use it to elevate your facility’s operations.
Click to Purchases Athletic Training Facility KPI Dashboard in Power BI
What Is the Athletic Training Facility KPI Dashboard in Power BI?
The Athletic Training Facility KPI Dashboard is a powerful, interactive reporting tool built in Power BI and driven by Excel data. It allows athletic facility managers, coaches, and sports analysts to track KPIs over time using Monthly-To-Date (MTD), Year-To-Date (YTD), and historical comparisons.
This dashboard provides:
-
📊 Dynamic KPI comparisons
-
📈 Trend visualization across months/years
-
🎯 Target vs Actual performance tracking
-
🔍 Drill-through details for KPI definitions and calculations
Key Features of the Dashboard
Let’s break down the key pages and their functionalities:
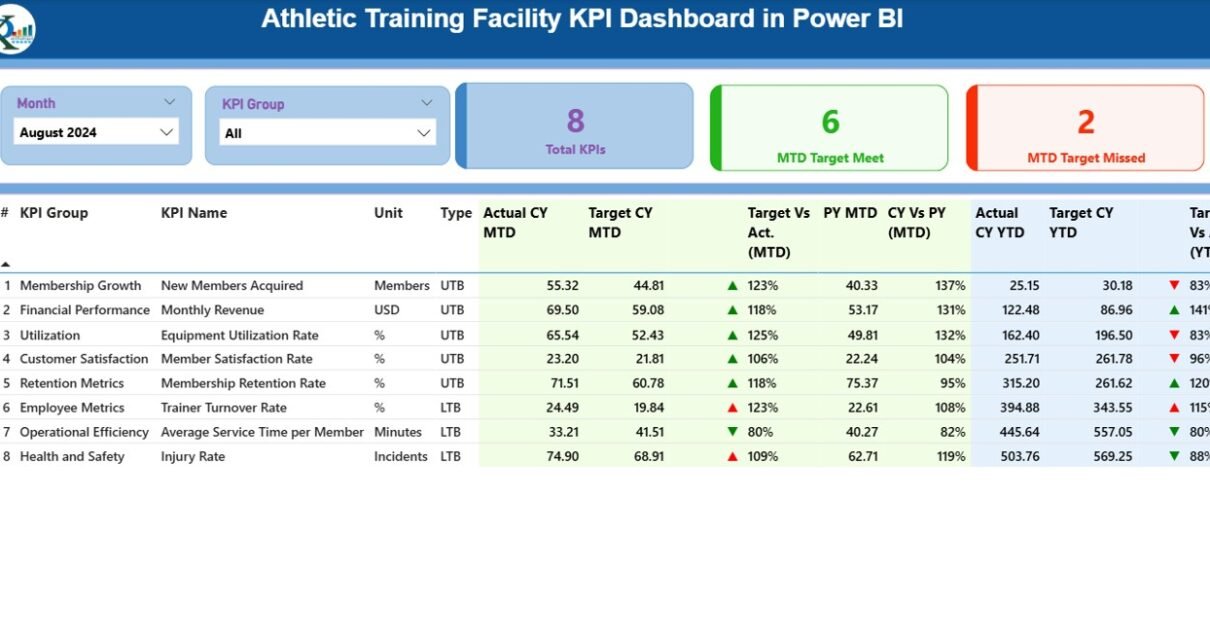
Summary Page – The Central Control Room
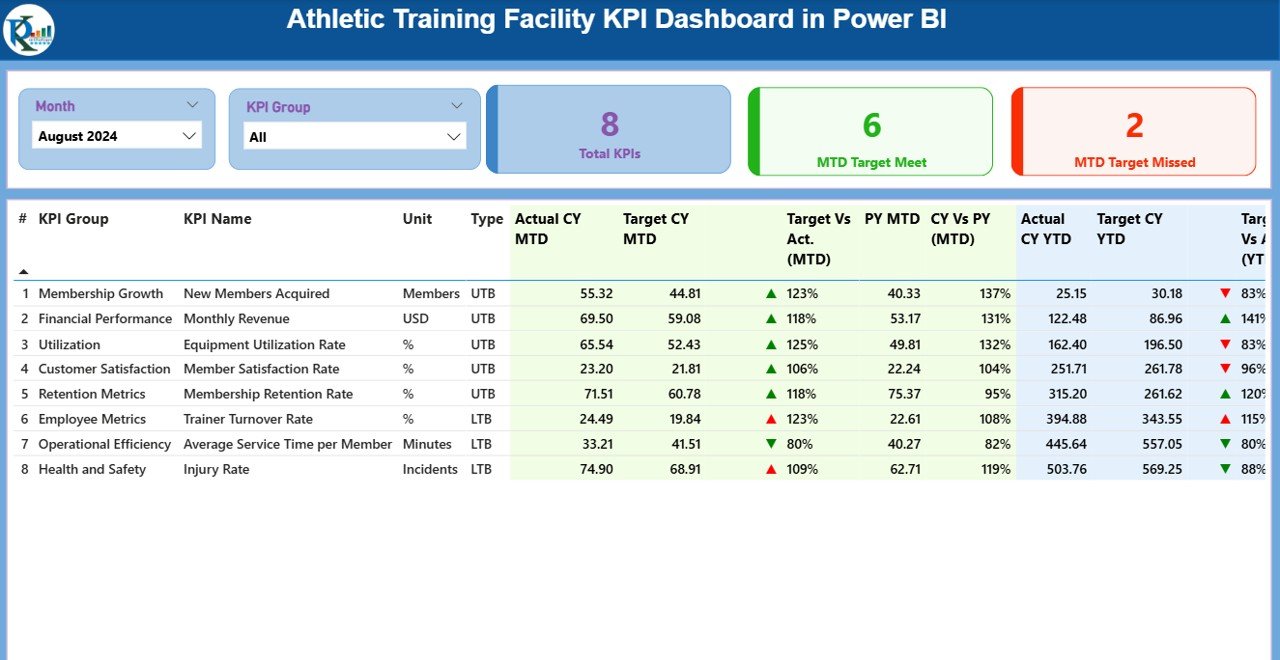
The Summary Page is the dashboard’s landing area, packed with high-level performance insights.
At the top, two slicers allow users to filter data by:
-
Month
-
KPI Group (e.g., Physical Therapy, Strength Training, Nutrition)
Just below, three vital performance cards display:
-
✅ Total KPIs Tracked
-
🟢 MTD Target Met Count
-
🔴 MTD Target Missed Count
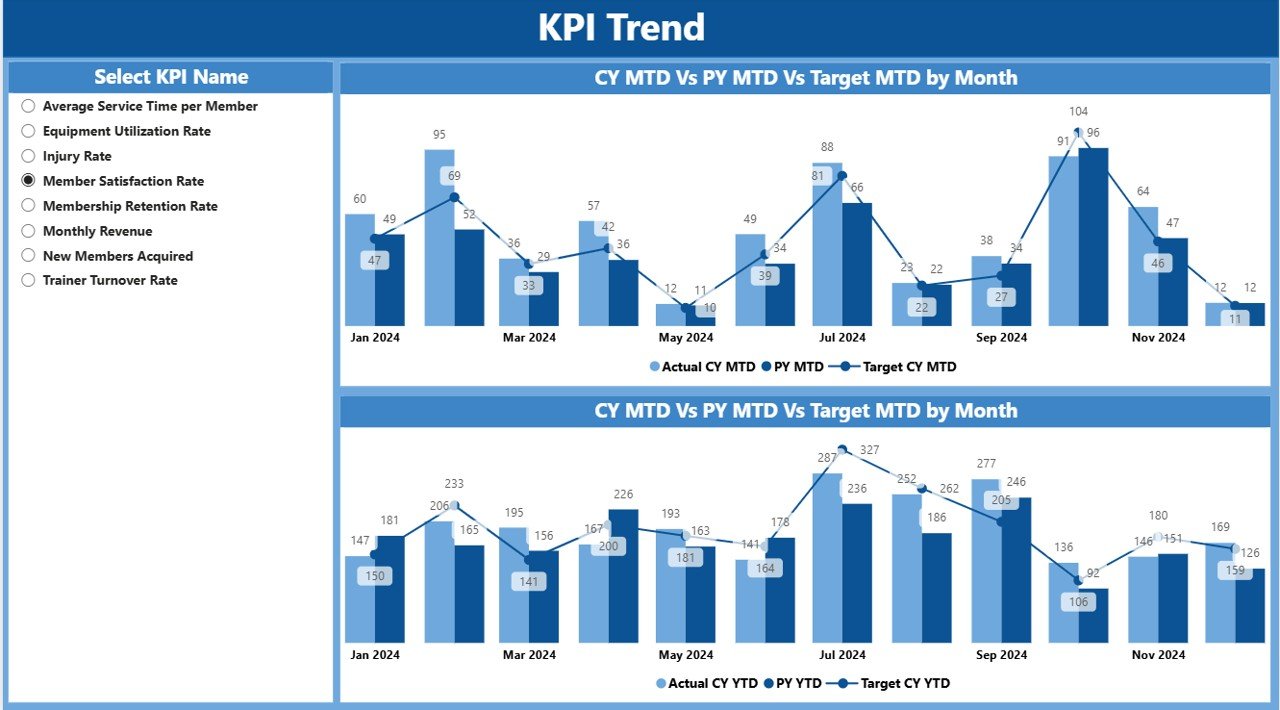
KPI Trend Page – Visualize Performance Over Time
Click to Purchases Athletic Training Facility KPI Dashboard in Power BI
This section shows two combo charts:
-
📈 MTD Trend Chart: Actual vs Target vs PY for each month
-
📉 YTD Trend Chart: Cumulative trend line comparisons
A slicer on the left lets you choose any KPI for trend analysis. For example:
-
Track the injury recurrence rate over the last 12 months
-
Compare nutrition compliance with targets across seasons
These visuals help spot patterns, understand fluctuations, and align strategy accordingly.
KPI Definition Page – Drill Through for Deeper Clarity
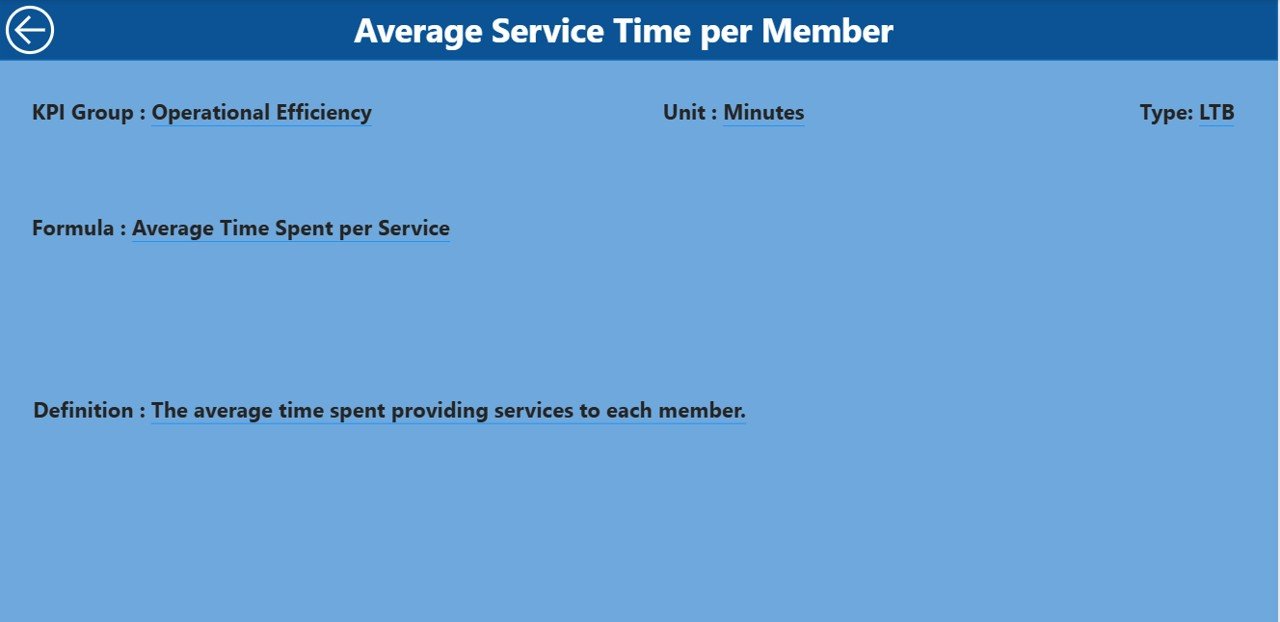
This hidden page is accessible via a drill-through action from the Summary Page. When you right-click any KPI, you can view:
-
🧾 KPI Formula (e.g., Injuries this month ÷ total players)
-
📘 Definition
-
📌 Group
-
🔢 Unit & KPI Type
This ensures everyone understands how metrics are calculated—eliminating ambiguity and promoting accountability.
Excel Integration: Easy Data Input for Non-Technical Users
The dashboard uses Excel as a data source—making it accessible to teams who are not tech-savvy.
You’ll manage data using 3 structured worksheets:
📂 1. Input_Actual
-
Columns: KPI Name, Month, MTD Actual, YTD Actual
-
Example:
Strength Gain,01-01-2025,7%,35%
📂 2. Input_Target
-
Columns: KPI Name, Month, MTD Target, YTD Target
-
Example:
Strength Gain,01-01-2025,8%,40%
📂 3. KPI_Definition
-
Fields: KPI Number, Group, Name, Unit, Formula, Definition, Type
-
Example:
KPI001,Strength,Muscle Mass Gain,%,Actual Weight Gain ÷ Target,Increase in average muscle mass,UTB
Simply update these sheets monthly, and the dashboard automatically refreshes the insights in Power BI.
Advantages of Athletic Training Facility KPI Dashboard
Here are the key benefits of using this Power BI-based solution:
✅ Clear Visualization of Performance
-
Visual cards, charts, and colored icons make it easy to read performance at a glance.
✅ Improved Athlete Monitoring
-
Coaches can track each athlete’s KPIs against expected targets and past performance.
✅ Data-Driven Decisions
-
Identify which training areas are lagging and where adjustments are needed.
✅ Saves Time on Reporting
-
No manual calculations—just update Excel and view insights.
✅ Enhanced Team Collaboration
-
Different teams (nutrition, strength, therapy) can filter and view KPIs relevant to their domain.
Best Practices for Using the KPI Dashboard
To get the best results from this dashboard, follow these practices:
-
📅 Update Data Monthly
Ensure you fill in the Actuals and Targets at the start of every month. -
🔍 Define KPIs Clearly
Use meaningful names and consistent units in the KPI Definition sheet. -
📊 Use Trend Analysis Regularly
Don’t rely on a single month’s data—observe long-term patterns. -
🧩 Customize KPI Groups
Group your KPIs smartly: rehab, strength, agility, etc., for better filtering. -
🔒 Set Access Controls
Ensure sensitive performance metrics are accessible only to authorized users. -
📈 Review Target Settings Quarterly
Adjust targets based on new goals, off-season conditions, or injuries.
How to Use the Dashboard in Real Life?
Let’s say you manage a multi-sport training center. Here’s how different teams can benefit:
🏋️ Strength Coaches:
-
Monitor % increase in muscle gain
-
Track 1RM lift improvements over months
🧠 Rehab Specialists:
-
View injury recurrence rates
-
Track rehabilitation session attendance
🥗 Nutritionists:
-
Monitor meal plan compliance
-
Compare current body composition trends vs previous years
🧪 Sports Scientists:
-
Analyze VO2 max improvements
-
Track athlete fatigue scores
The dashboard turns complex performance data into a clear and actionable story.
Conclusion
The Athletic Training Facility KPI Dashboard in Power BI is more than just a reporting tool—it’s a strategic asset. With its interactive features, Excel-powered backend, and intuitive layout, it empowers coaches and facility managers to take smarter, quicker actions.
You no longer need to rely on manual Excel sheets or guesswork. Instead, leverage real-time insights to boost athletic performance, reduce injuries, and improve operational efficiency.
Frequently Asked Questions (FAQs)
1. Do I need to know Power BI to use this dashboard?
No! You only need to update the Excel sheets. Power BI automatically syncs the visuals once data is refreshed.
2. Can I add or remove KPIs from the dashboard?
Yes, the dashboard is fully customizable. Just add or delete KPIs from the Excel files.
3. What is the meaning of UTB and LTB?
-
UTB (Upper The Better): Higher values indicate better performance (e.g., strength gain).
-
LTB (Lower The Better): Lower values are preferable (e.g., injury count).
4. Is this dashboard suitable for all sports?
Absolutely. Whether you manage football, basketball, cricket, or multi-sport centers, this dashboard fits all.
5. Can I share the dashboard with my team?
Yes. You can publish the Power BI dashboard to your workspace and share it securely with your staff.
6. How often should I update the data?
Ideally, update it monthly. For intensive tracking programs, a bi-weekly update is also recommended.
7. Can I track athlete-specific data?
This version is focused on KPI-level analysis, but with slight modifications, you can add athlete-level filtering.
Visit our YouTube channel to learn step-by-step video tutorials
Click to Purchases Athletic Training Facility KPI Dashboard in Power BI