In the digital era, organizations heavily rely on IT assets to keep business operations running smoothly. From laptops and servers to networking equipment and software licenses, managing these assets effectively is crucial for cost control, compliance, and efficiency. This is where the IT Asset Management Dashboard in Power BI plays a key role.
In this guide, we will explore everything about the IT Asset Management Dashboard in Power BI — from its features to advantages, best practices, and FAQs. We will also see how this dashboard helps businesses track, analyze, and optimize their IT asset lifecycle.
Click to Purchases IT Asset Management Dashboard in Power BI
What is an IT Asset Management Dashboard in Power BI?
An IT Asset Management Dashboard in Power BI is a visual, interactive reporting tool that helps organizations monitor and manage their IT assets in real time.
It pulls data from a centralized source — such as an Excel file, database, or asset management system — and presents it in easy-to-read charts, graphs, and KPIs.
With this dashboard, you can:
-
Track active and inactive assets.
-
Monitor net book value across locations.
-
Identify assets under warranty.
-
View asset counts by department, vendor, or type.
-
Analyze trends over time.
Key Features of the IT Asset Management Dashboard in Power BI
The dashboard is structured into five main pages, each focusing on a specific analytical area. Here’s a detailed breakdown:
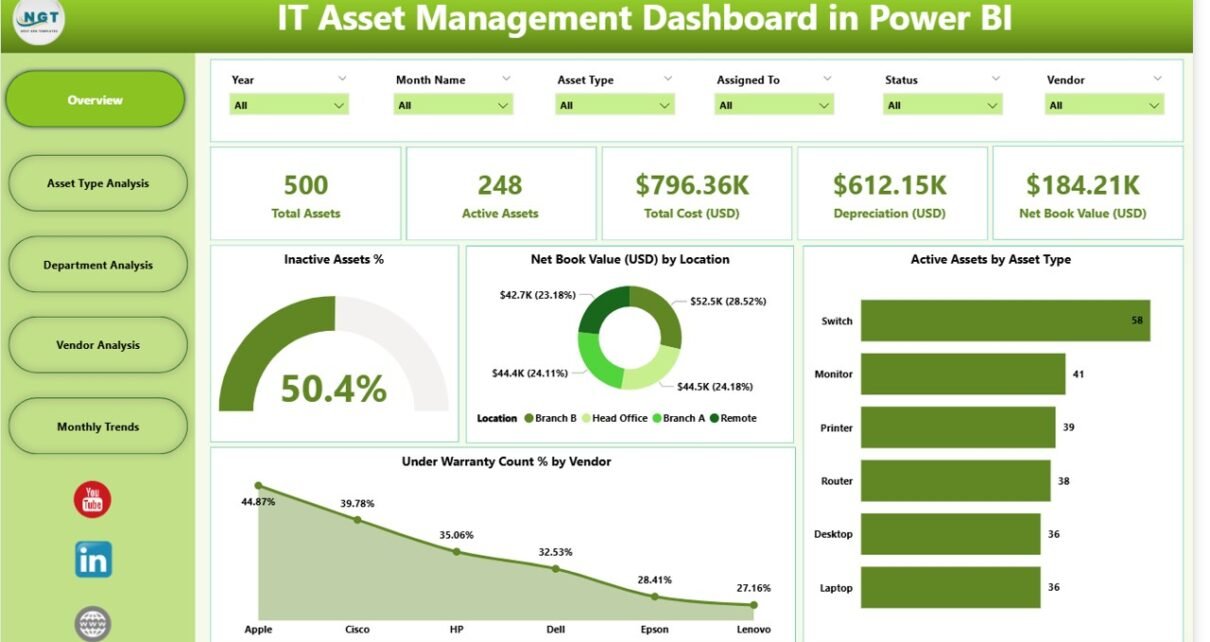
Overview Page – A Snapshot of Your IT Assets
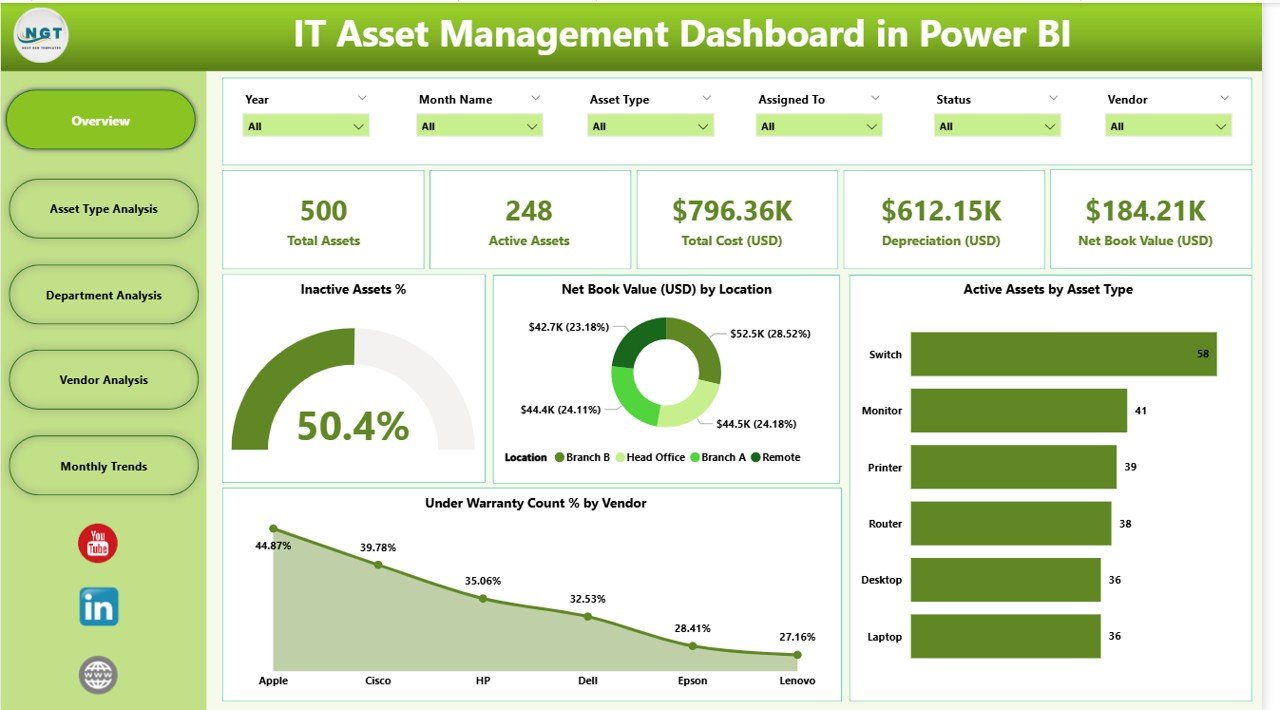
The Overview Page is your go-to summary for all asset-related insights.
Highlights:
-
6 Slicers to filter data by asset type, department, vendor, location, warranty status, and date range.
5 KPI Cards displaying:
- Inactive Assets %
- Net Book Value (USD)
- Active Assets
- Assets Under Warranty %
- Total Asset Count
4 Charts:
- Inactive Assets %
- Net Book Value (USD) by Location
- Active Assets by Asset Type
- Under Warranty Count % by Vendor
Asset Type Analysis – Understanding Asset Distribution
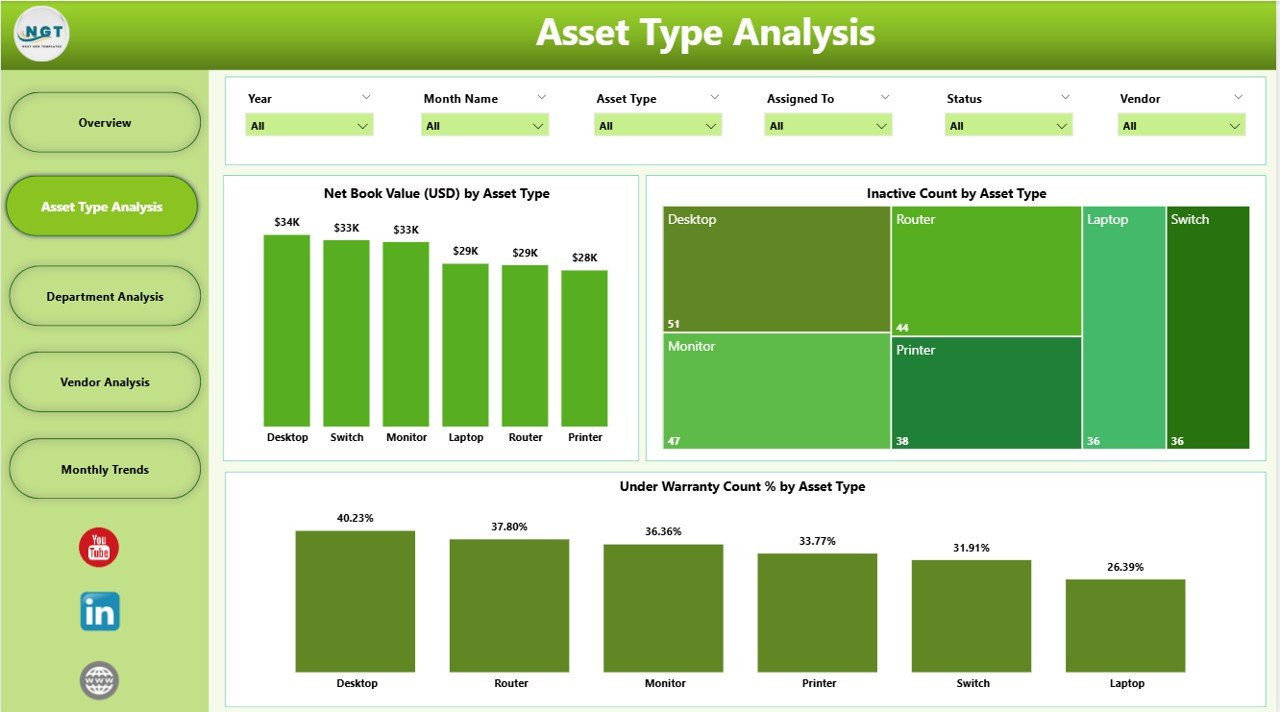
This page focuses on performance and cost analysis based on asset types.
Click to Purchases IT Asset Management Dashboard in Power BI
Includes:
-
6 Slicers for deep filtering.
3 Charts:
- Net Book Value (USD) by Asset Type
- Inactive Count by Asset Type
- Under Warranty Count % by Asset Type
This helps in identifying high-cost asset types and monitoring warranty coverage.
Department Analysis – Evaluating Department-Wise Asset Utilization
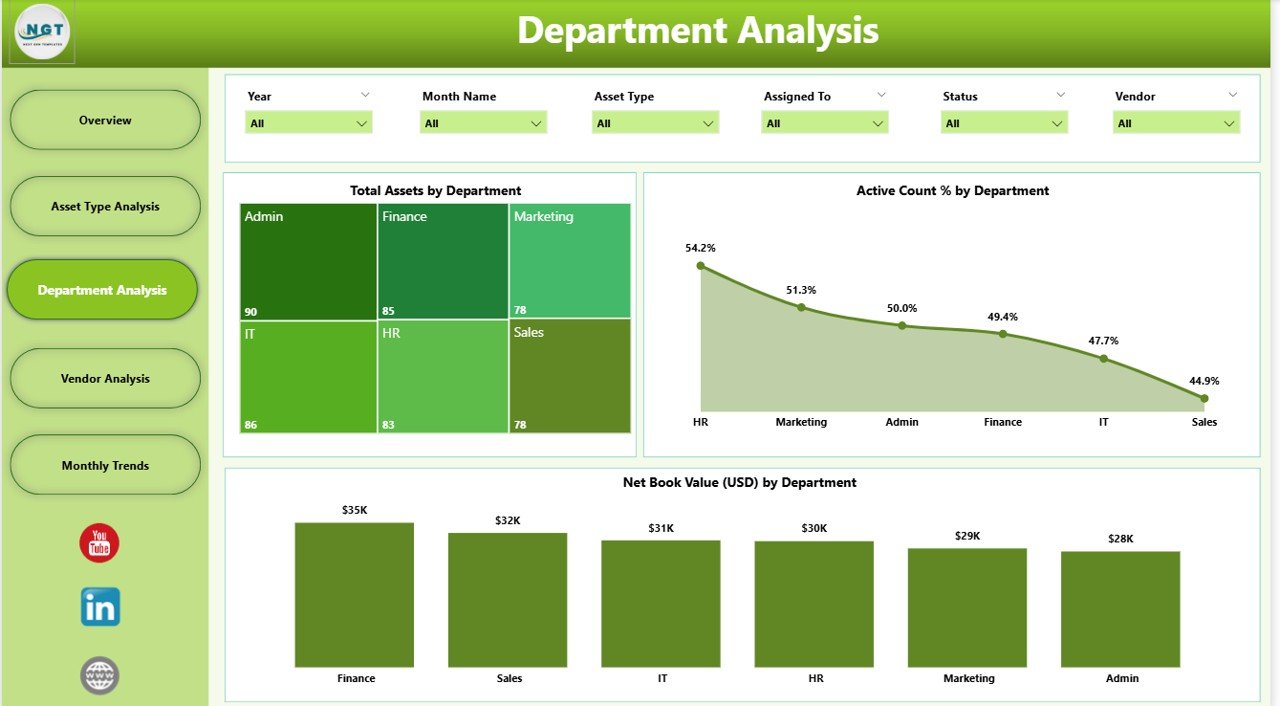
Department-level insights help management make informed decisions.
Features:
-
6 Slicers for filtering by department, location, vendor, and more.
3 Charts:
- Total Assets by Department
- Active Count % by Department
- Net Book Value (USD) by Department
With these insights, you can allocate resources effectively and identify departments with underutilized assets.
Vendor Analysis – Tracking Vendor Performance
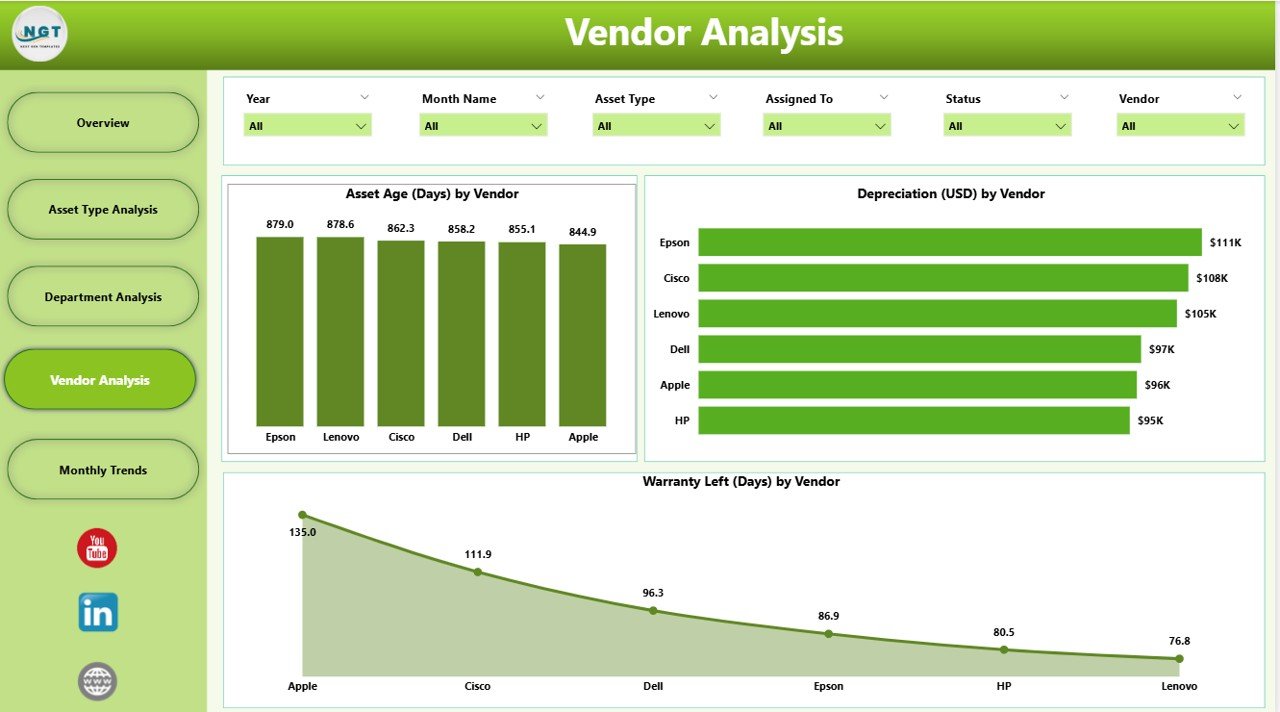
Vendor relationships directly impact asset procurement and maintenance.
This page shows:
-
6 Slicers for filtering vendor-related data.
3 Charts:
- Asset Age (Days) by Vendor
- Department Spend (USD) by Vendor
- Warranty Left (Days) by Vendor
It helps in identifying reliable vendors and managing vendor contracts effectively.
Monthly Trends – Tracking Asset Changes Over Time
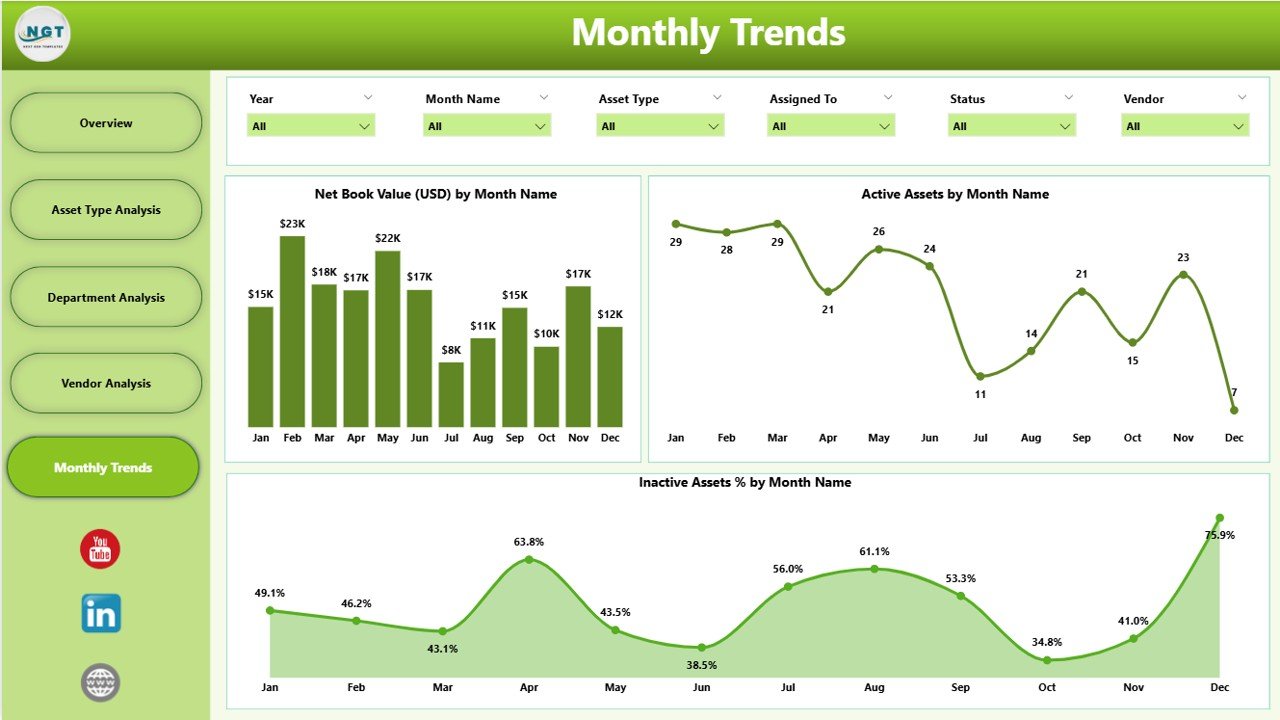
The Monthly Trends page helps in identifying usage patterns and cost variations.
Includes:
-
6 Slicers for monthly or custom date analysis.
3 Charts:
- Net Book Value (USD) by Month Name
- Active Assets by Month Name
- Inactive Assets % by Month Name
This view supports trend analysis and forecasting for future asset planning.
Why Use Power BI for IT Asset Management?
Power BI offers a flexible, visually appealing, and interactive platform for managing IT assets. Some reasons why it stands out include:
-
Integration with multiple data sources like Excel, SQL, and cloud apps.
-
Real-time updates for accurate decision-making.
-
Interactive visuals for better understanding.
-
Scalability for small to enterprise-level organizations.
Advantages of the IT Asset Management Dashboard in Power BI
Here are the top benefits businesses experience when using this dashboard:
-
Centralized Asset Tracking – View all IT assets in one place.
-
Cost Optimization – Identify high-cost assets and reduce unnecessary spending.
-
Better Warranty Management – Keep track of warranties to avoid repair costs.
-
Improved Vendor Relationships – Evaluate vendors based on performance.
-
Enhanced Decision-Making – Get real-time insights for quick action.
-
Trend Analysis – Understand historical data to plan future investments.
Opportunities for Improvement in the Dashboard
While the dashboard is already feature-rich, businesses can enhance it further by:
-
Adding predictive analytics to forecast asset needs.
-
Integrating maintenance schedules.
-
Including QR code or RFID integration for asset tracking.
-
Automating email alerts for warranty expirations.
Best Practices for the IT Asset Management Dashboard in Power BI
To get the most value from your IT Asset Management Dashboard, follow these tips:
-
Keep Data Clean and Updated – Regularly update the asset database.
-
Use Consistent Naming Conventions – For asset types, vendors, and departments.
-
Set Access Permissions – Limit data visibility based on user roles.
-
Schedule Refreshes – Automate data refresh in Power BI for real-time reporting.
-
Use Drill-Through Features – Allow users to click on visuals for more details.
-
Monitor KPIs Regularly – Review key metrics weekly or monthly.
How to Build an IT Asset Management Dashboard in Power BI?
If you want to create your own version, follow these steps:
-
Prepare Your Data – Store asset details in Excel, SQL, or your asset management tool.
-
Load Data into Power BI – Connect Power BI to your data source.
-
Clean and Transform Data – Use Power Query to format your data.
-
Design the Layout – Create KPI cards, slicers, and charts.
-
Add Filters and Interactivity – Use slicers for better user control.
-
Publish and Share – Share the dashboard with stakeholders.
Conclusion
The IT Asset Management Dashboard in Power BI is more than just a reporting tool — it’s a complete solution for asset tracking, cost control, and performance monitoring.
By implementing this dashboard, businesses can make smarter investment decisions, reduce operational costs, and improve asset utilization.
Frequently Asked Questions (FAQs)
Q1: What is the main purpose of the IT Asset Management Dashboard in Power BI?
The main purpose is to provide a centralized, visual platform to track and analyze IT assets, costs, warranties, and vendor performance.
Q2: Can this dashboard work with live data?
Yes. Power BI can connect to live data sources, ensuring real-time insights.
Q3: How often should I update the asset data?
It’s best to update it weekly or set up an automated refresh for real-time accuracy.
Q4: Can I customize the dashboard for my organization?
Absolutely. You can add or remove KPIs, change visuals, and connect different data sources.
Q5: Does Power BI require coding skills to build this dashboard?
No. While advanced features can benefit from DAX formulas, basic dashboards can be created without coding.
Visit our YouTube channel to learn step-by-step video tutorials