Managing the financial health of construction and real estate projects is not an easy task. With multiple projects running at the same time, contractors, developers, and project managers need to monitor costs, budgets, revenues, and profitability with accuracy. Without proper tracking, it becomes difficult to identify overruns, manage risks, and plan future investments.
This is where a Construction and Real Estate Financial Health KPI Dashboard in Excel comes in. It provides a centralized platform to track key financial performance indicators (KPIs), compare targets with actuals, and make data-driven decisions. In this article, we will explore everything you need to know about this dashboard, its structure, benefits, and how you can implement it effectively.
Click to Purchases Construction and Real Estate Financial Health KPI Dashboard in Excel
What is a Construction and Real Estate Financial Health KPI Dashboard?
A Construction and Real Estate Financial Health KPI Dashboard is an interactive Excel-based tool that helps businesses measure and analyze their financial performance. It consolidates critical financial KPIs such as budget variance, project cost, profit margins, cash flow, and revenue growth into a single file.
Instead of maintaining scattered reports, this dashboard provides visual insights using charts, conditional formatting, and slicers. Managers can easily identify whether a project is within budget, meeting financial expectations, or facing risks.
Why is Financial Health Monitoring Important in Construction and Real Estate?
Construction and real estate industries involve large capital investments, long project lifecycles, and high financial risks. Monitoring financial health is essential because:
✅ Budgets can quickly spiral out of control.
✅ Cash flow management is critical for daily operations.
✅ Profit margins must be tracked to ensure business sustainability.
✅ Stakeholders need clear insights into project costs and returns.
✅ Comparing actuals with targets highlights deviations early.
By using a KPI dashboard, companies can avoid guesswork and rely on data-driven strategies to manage financial health.
Key Features of the Financial Health KPI Dashboard
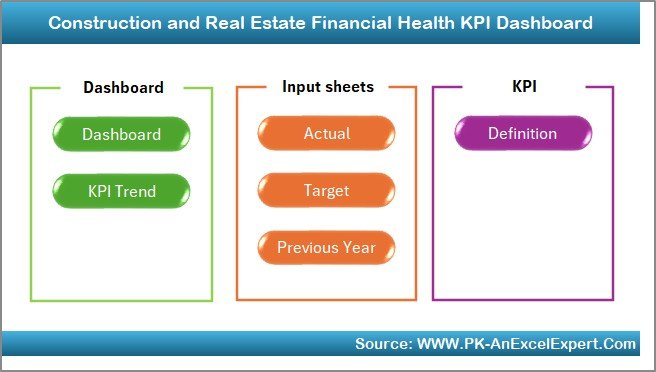
The Construction and Real Estate Financial Health KPI Dashboard comes with seven structured worksheet tabs that make tracking easy and effective.
Home Sheet
-
Acts as an index page.
-
Contains buttons for quick navigation to other sheets.
-
Saves time by avoiding manual scrolling across multiple tabs.
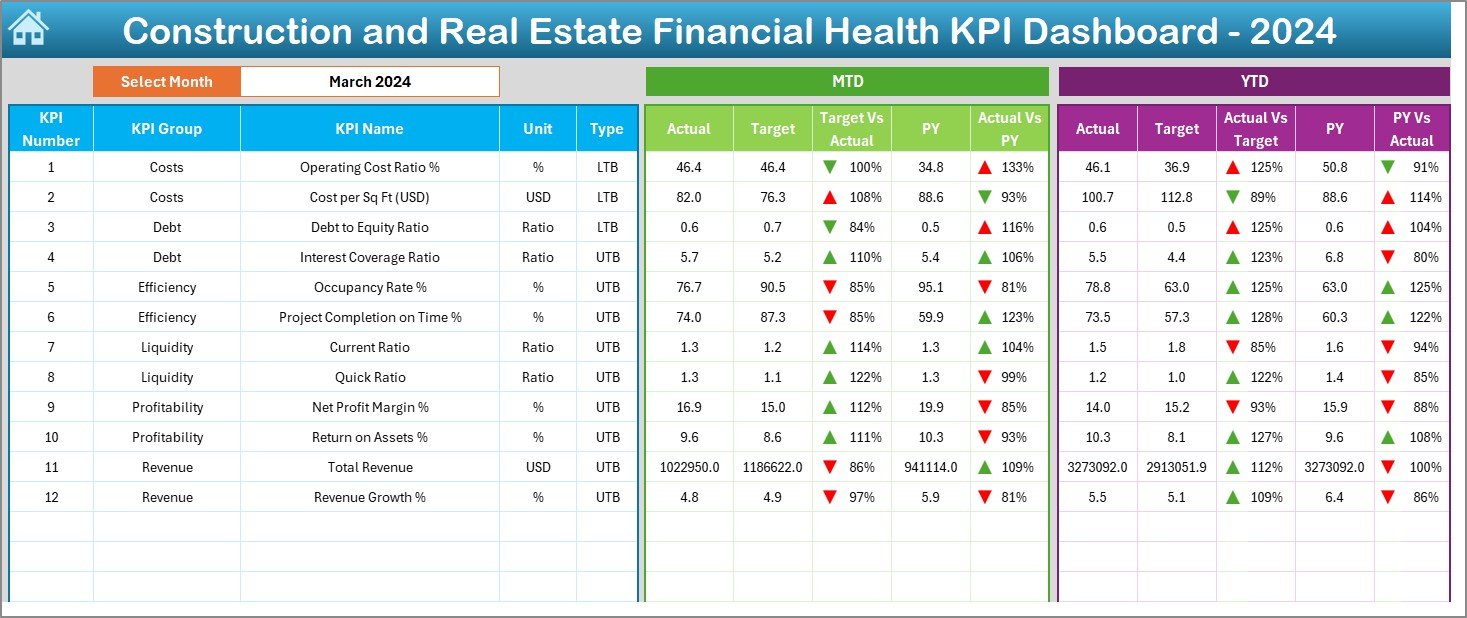
Dashboard Sheet
-
The main sheet where all KPI data is displayed.
-
Users can select a month from a drop-down in cell D3.
-
Displays Month-to-Date (MTD) and Year-to-Date (YTD) actuals, targets, and previous year comparisons.
-
Uses conditional formatting with arrows to indicate performance trends (up or down).
-
Provides a quick financial overview for managers.
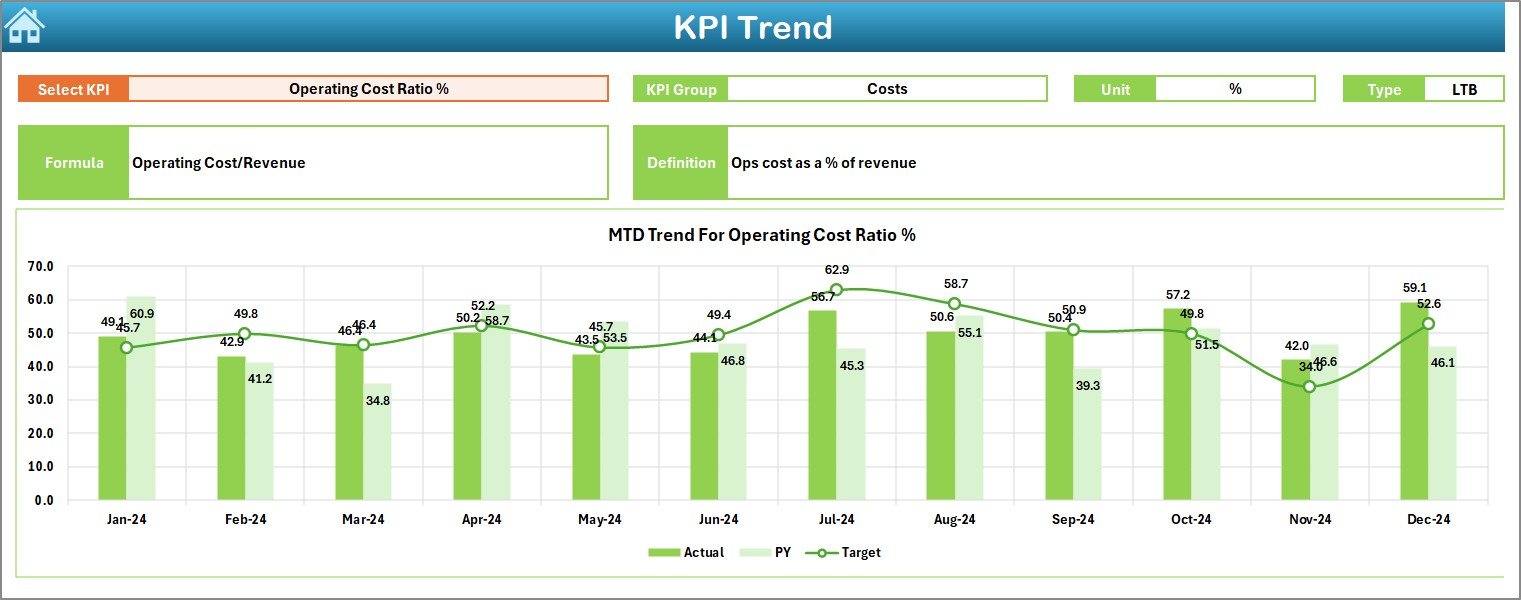
KPI Trend Sheet
-
Allows selection of a specific KPI from a drop-down in cell C3.
-
Shows KPI group, unit, type (UTB/LTB), formula, and definition.
-
Displays trend charts for MTD and YTD across Actual, Target, and Previous Year.
-
Helps in analyzing how a KPI is moving over time.
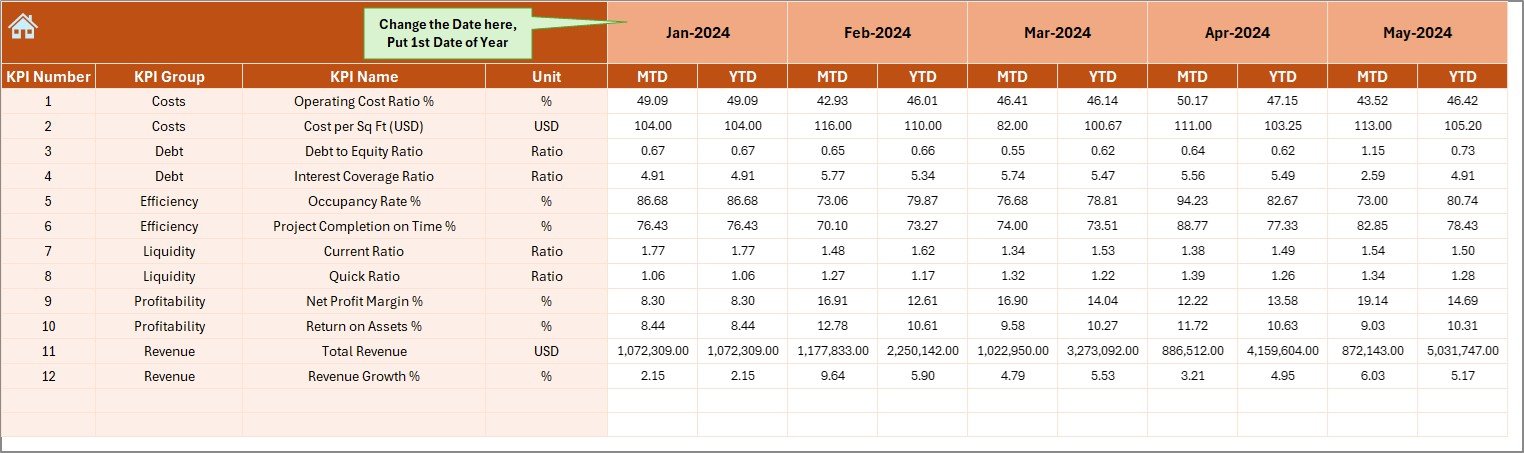
Actual Numbers Input Sheet
-
Dedicated for entering real financial figures for each KPI.
-
MTD and YTD actuals are entered manually.
-
A drop-down (E1) allows you to set the first month of the financial year.
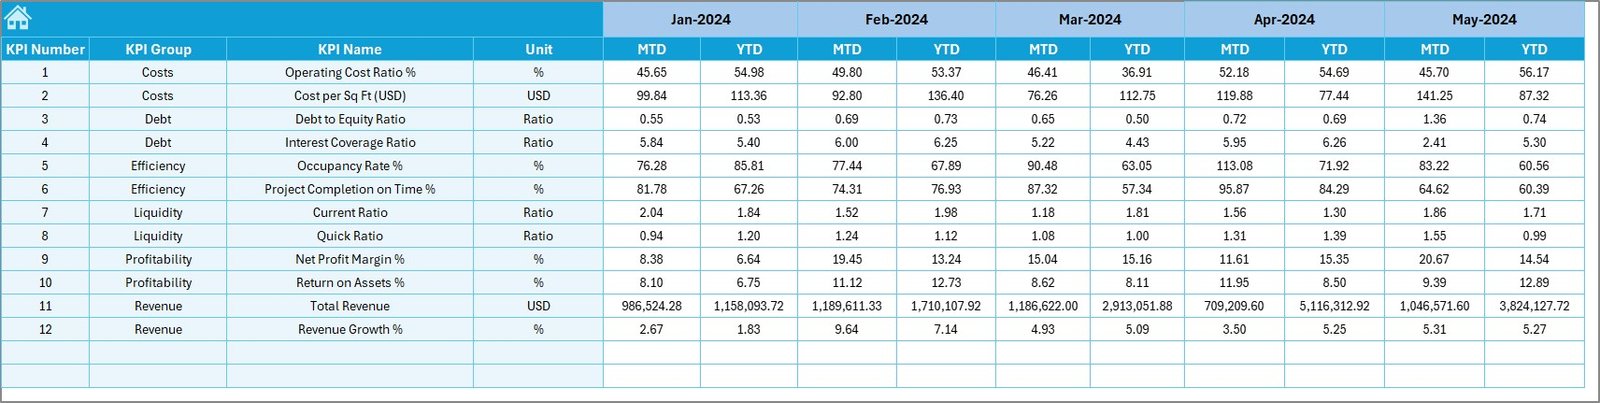
Target Sheet
-
Used to set financial targets for each KPI.
-
Contains both MTD and YTD targets.
-
Provides the benchmark against which performance is compared.
Click to Purchases Construction and Real Estate Financial Health KPI Dashboard in Excel
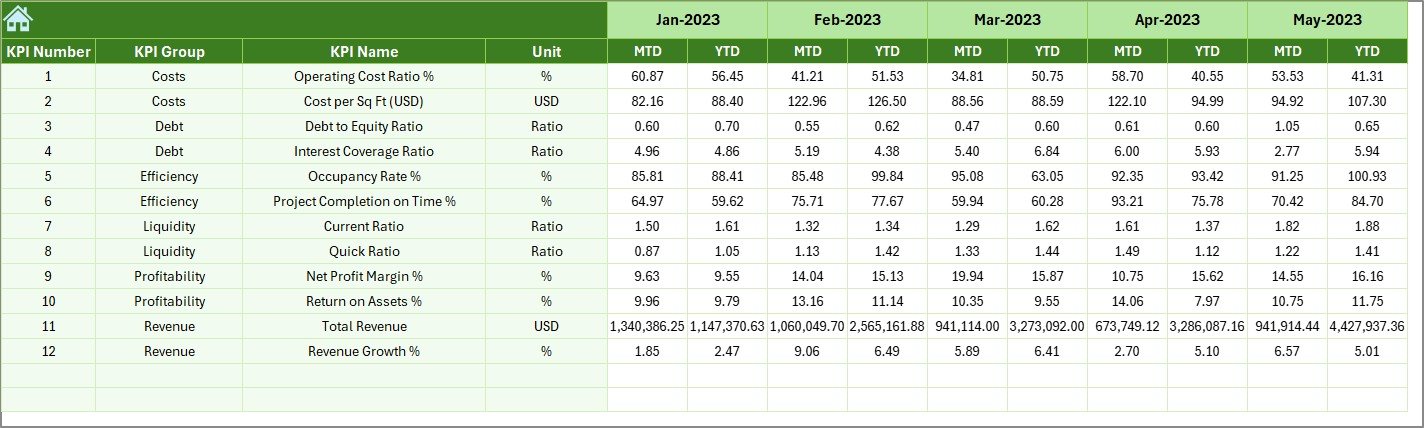
Previous Year Numbers Sheet
-
Stores historical KPI data.
-
Allows comparisons with previous year’s performance.
-
Useful for spotting long-term financial trends.
KPI Definition Sheet
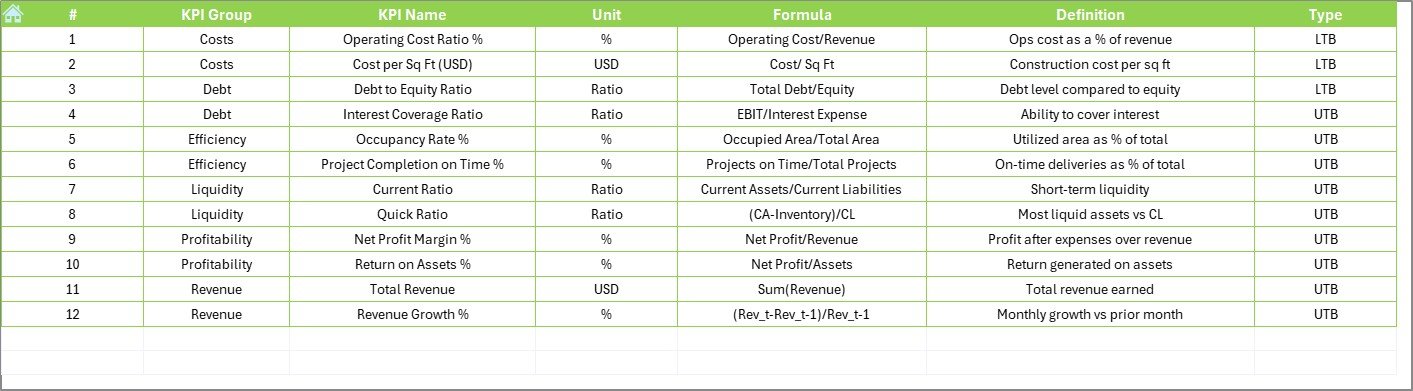
-
Stores detailed information about each KPI.
-
Columns include KPI Name, Group, Unit, Formula, and Definition.
-
Ensures clarity and consistency across the dashboard.
Examples of KPIs Tracked in the Dashboard
The dashboard can track various KPIs such as:
-
Budget Variance (%) – Formula: (Budget – Cost) ÷ Budget × 100
-
Revenue Growth (%) – Formula: (Current Revenue – Previous Revenue) ÷ Previous Revenue × 100
-
Profit Margin (%) – Formula: Net Profit ÷ Revenue × 100
-
Cash Flow (USD) – Net inflows vs. outflows
-
Project Cost per Sq. Ft. – Formula: Total Project Cost ÷ Total Area
-
Return on Investment (ROI %) – Formula: (Net Profit ÷ Investment) × 100
-
Debt to Equity Ratio – Formula: Total Debt ÷ Shareholder Equity
These KPIs ensure a holistic view of the financial status of construction and real estate projects.
Advantages of Using the Financial Health KPI Dashboard
Implementing this dashboard provides several benefits:
📊 Centralized View – All financial KPIs in one place.
📈 Trend Analysis – Compare MTD, YTD, and Previous Year data.
🧾 Better Decision-Making – Identify underperforming areas quickly.
⏳ Time-Saving – Automated calculations reduce manual effort.
✅ Accuracy – Reduces chances of financial errors.
📉 Risk Management – Early warnings for budget overruns.
📊 Visual Insights – Charts and arrows make complex data easy to understand.
Opportunities for Improvement
Even though the Excel-based KPI dashboard is powerful, there are some areas for improvement:
🔄 Automation – Integrating with real-time ERP or accounting software would eliminate manual data entry.
📱 Accessibility – Creating a cloud version (Google Sheets or Power BI) can improve collaboration.
🔔 Alerts & Notifications – Adding automated alerts for financial deviations.
🌍 Scalability – For large real estate firms, integrating with databases would enhance performance.
🔒 Security – Password protection and restricted access can improve data security.
Best Practices for Using the Dashboard
To get maximum benefit from this dashboard, follow these best practices:
✔️ Keep KPI definitions clear and consistent.
✔️ Update actual numbers regularly (monthly or weekly).
✔️ Use conditional formatting to highlight risks.
✔️ Involve finance and project managers in target setting.
✔️ Compare targets with previous years for realistic benchmarks.
✔️ Review trend charts frequently to spot patterns.
✔️ Backup the file to avoid data loss.
How to Implement the Dashboard in Your Organization?
-
Download or Create the Template – Use a prebuilt template or design from scratch.
-
Customize KPIs – Select financial KPIs that are relevant to your business.
-
Enter Definitions – Fill in KPI details (unit, type, formula).
-
Set Targets – Define MTD and YTD goals for each KPI.
-
Input Data – Regularly update actual numbers and previous year comparisons.
-
Review Dashboard – Analyze charts and cards to track financial health.
-
Take Action – Use insights to adjust budgets, reduce costs, or optimize revenue.
Real-World Applications of the Dashboard
The Construction and Real Estate Financial Health KPI Dashboard can be used by:
-
Contractors – To monitor multiple project budgets.
-
Developers – To track ROI across different properties.
-
Finance Teams – To manage cash flows and profitability.
-
Project Managers – To keep expenses aligned with targets.
-
Executives – To make high-level financial decisions based on reliable data.
Conclusion
The Construction and Real Estate Financial Health KPI Dashboard in Excel is an essential tool for monitoring the financial success of projects. With structured sheets, visual insights, and KPI tracking, it enables better financial control, reduces risks, and supports long-term planning.
By following best practices and continuously updating the dashboard, organizations can maximize efficiency, improve accuracy, and ensure sustainable profitability in construction and real estate projects.
Frequently Asked Questions (FAQs)
1. What is the purpose of a financial health KPI dashboard in construction and real estate?
It helps track critical financial indicators like budget variance, profit margins, and ROI, giving businesses a clear picture of financial performance.
2. Can this dashboard be customized for different projects?
Yes, you can add or remove KPIs, update formulas, and customize the design to suit your organization’s requirements.
3. How often should the dashboard be updated?
Ideally, it should be updated monthly. However, for large projects, weekly updates may provide more accurate monitoring.
4. Is Excel enough for managing financial KPIs in big companies?
Excel works well for small to medium businesses. For large enterprises, integration with ERP systems or Power BI provides more scalability.
5. What are the most important KPIs to track in construction and real estate financial health?
Budget Variance, Cash Flow, Profit Margin, ROI, Revenue Growth, and Project Cost per Sq. Ft. are some of the most important KPIs.
Visit our YouTube channel to learn step-by-step video tutorials