Managing an office budget effectively is one of the most important tasks for any organization. Without a proper system in place, companies often face overspending, poor resource allocation, and lack of visibility into financial performance. To address these challenges, an Office Budget Utilization Dashboard in Excel provides a structured way to track, monitor, and analyze how well the organization is using its approved budgets.
In this article, we will explore everything you need to know about creating and using an Office Budget Utilization Dashboard in Excel. We will cover its features, structure, benefits, best practices, and even answer some frequently asked questions at the end.
Click to Purchases Office Budget Utilization Dashboard in Excel
What is an Office Budget Utilization Dashboard?
An Office Budget Utilization Dashboard is a financial management tool built in Excel that helps businesses track their budget versus actual spending across departments, vendors, and categories. It combines data visualization, charts, and key performance indicators (KPIs) to provide decision-makers with real-time insights.
Unlike plain spreadsheets, a dashboard brings clarity by presenting financial data in an interactive, visual, and easy-to-understand format. This allows leaders to identify overspending, underutilization, and variances quickly, which leads to smarter financial decisions.
Why Use Excel for Budget Utilization Tracking?
You might wonder, why Excel and not a more complex ERP or accounting system? The answer is simple:
-
Flexibility – Excel dashboards can be customized to match the exact requirements of your business.
-
Cost-effective – No need for expensive software licenses or implementation costs.
-
Ease of use – Most finance teams are already familiar with Excel, so adoption is quick.
-
Scalability – Excel dashboards can be used for small offices as well as large organizations.
-
Integration – Data from different sources (accounting systems, procurement tools, or manual inputs) can be imported into Excel easily.
Key Features of the Office Budget Utilization Dashboard
This ready-to-use dashboard template comes with a page navigator on the left side for quick movement across multiple analytical views. Each page has its unique purpose, and together they give a complete overview of financial performance.
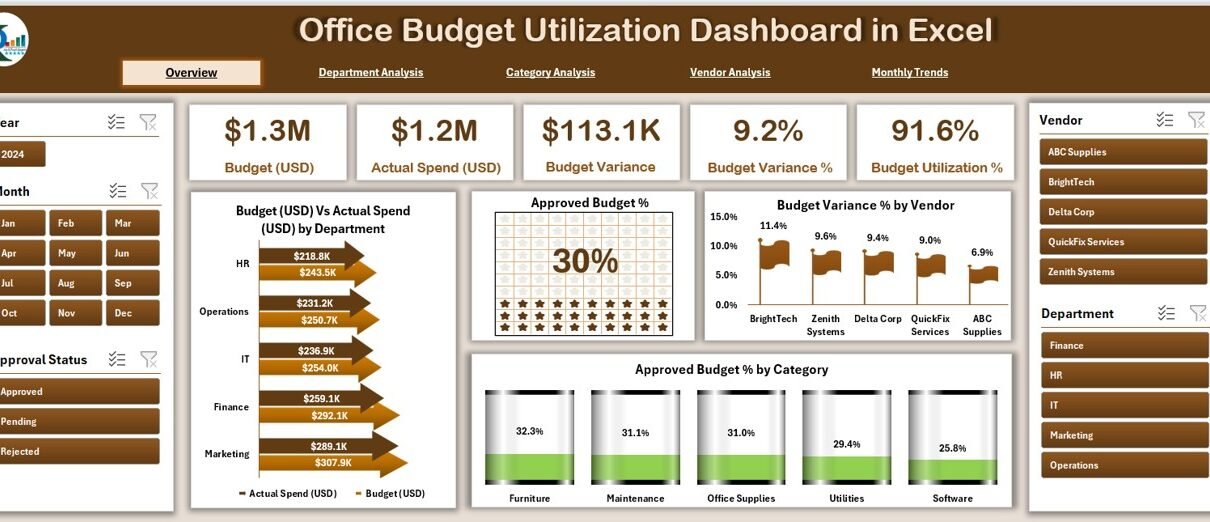
Overview Page
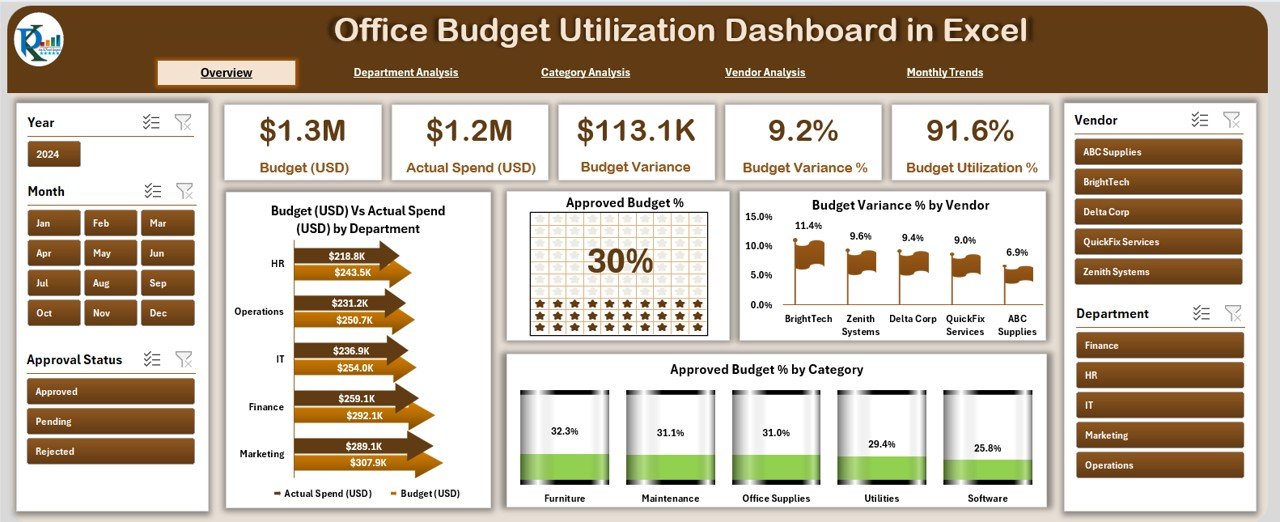
The Overview Page acts as the central hub of the dashboard.
-
Displays 5 summary cards for quick performance indicators.
Includes charts such as:
- Budget (USD) vs Actual Spend (USD) by Department
- Approved Budget %
- Budget Variance % by Vendor
- Approved Budget % by Category
This page helps decision-makers see the big picture at a glance.
Department Analysis
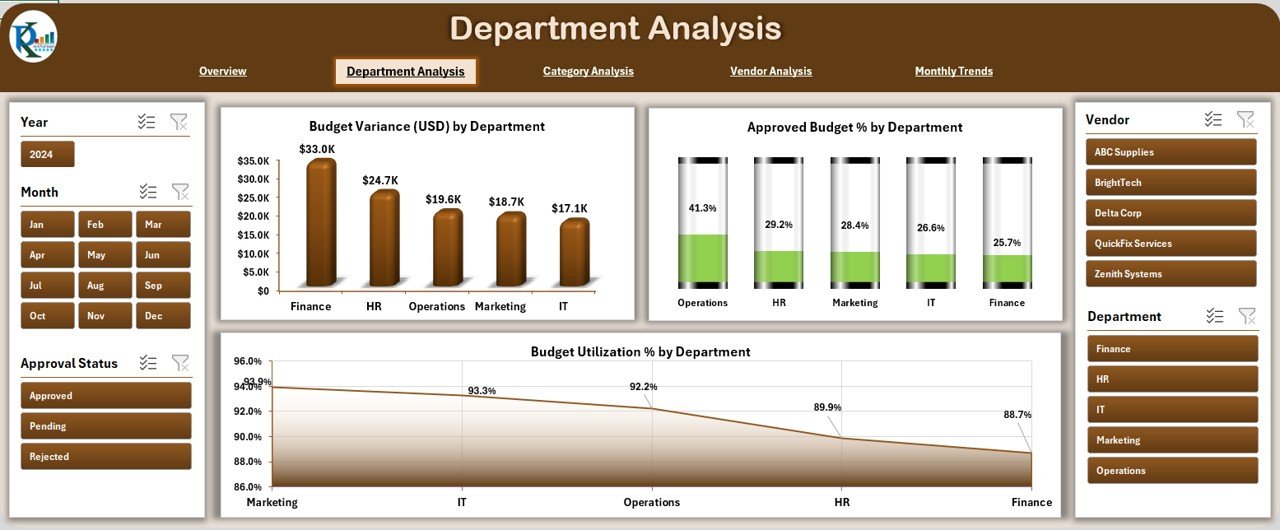
The Department Analysis Page focuses on departmental budget allocation and utilization.
Charts available:
- Budget Variance (USD) by Department
- Approved Budget % by Department
- Budget Utilization % by Department
This allows managers to identify departments that are overspending or underutilizing their resources.
Category Analysis
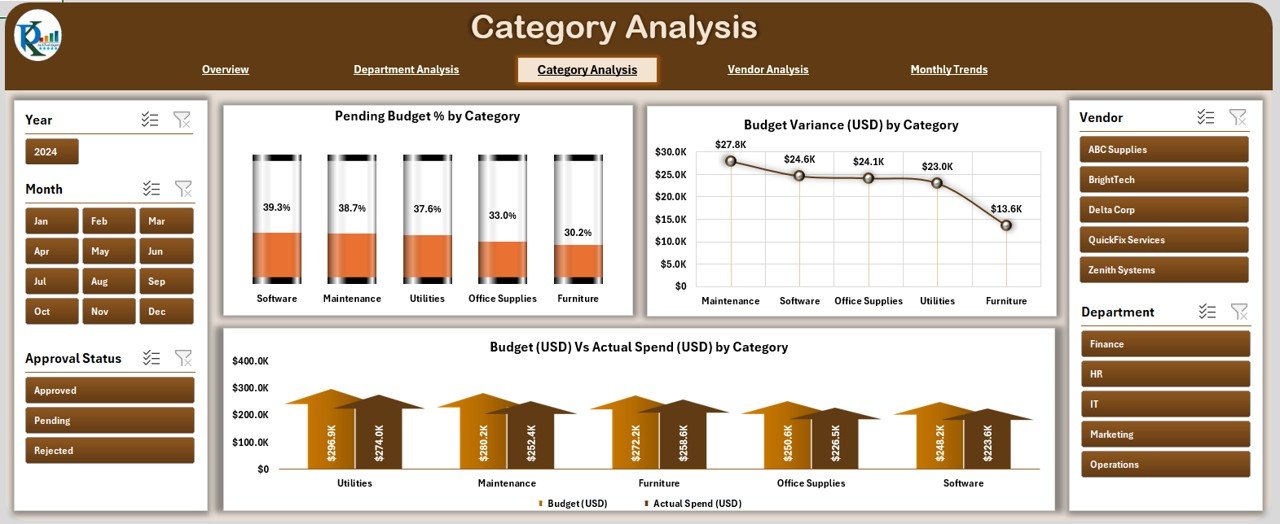
The Category Analysis Page provides insights into different spending categories.
Charts available:
- Pending Budget % by Category
- Budget Variance (USD) by Category
- Budget (USD) vs Actual Spend (USD) by Category
By looking at categories such as operations, marketing, HR, or IT, you can identify which cost areas are consuming more resources.
Click to Purchases Office Budget Utilization Dashboard in Excel
Vendor Analysis
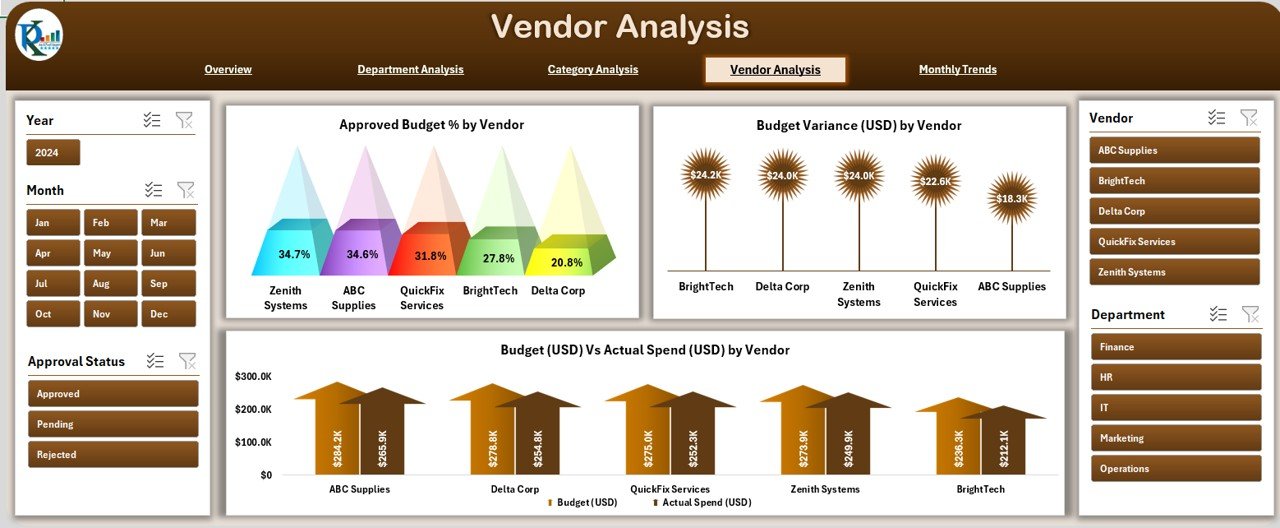
The Vendor Analysis Page tracks budget and spending related to external vendors.
Charts available:
- Approved Budget % by Vendor
- Budget Variance (USD) by Vendor
- Budget (USD) vs Actual Spend (USD) by Vendor
This helps procurement teams monitor vendor performance, compare costs, and ensure vendors stay within agreed budgets.
Monthly Trends
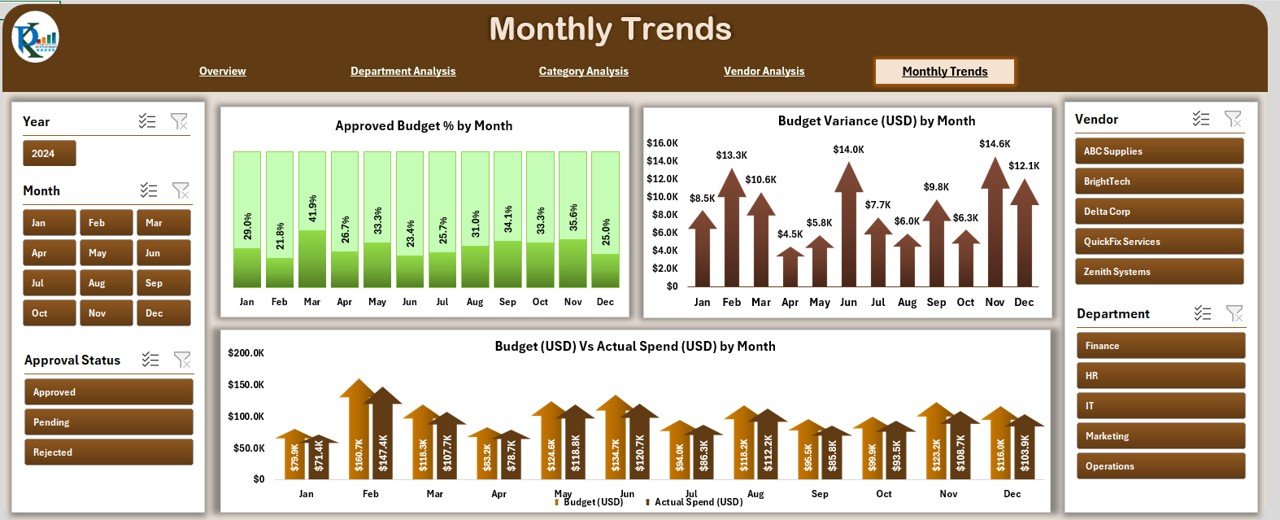
The Monthly Trends Page tracks financial performance over time.
Charts available:
- Approved Budget % by Month
- Budget Variance (USD) by Month
- Budget (USD) vs Actual Spend (USD) by Month
This page highlights seasonal spending patterns and ensures financial discipline throughout the year.
Support Sheet
The Support Sheet contains the raw data that powers the entire dashboard. By updating this sheet, the visuals and charts across all dashboard pages automatically refresh.
Advantages of Office Budget Utilization Dashboard in Excel
Using this dashboard provides several advantages:
✅ Improved financial visibility – Monitor actual spend versus approved budget in real time.
✅ Quick decision-making – Use visual charts to identify problem areas instantly.
✅ Accountability – Assign responsibility at department and vendor levels.
✅ Cost control – Detect overspending before it becomes a serious issue.
✅ Performance tracking – Compare spending trends across months and categories.
✅ Customization – Tailor the dashboard to your unique business requirements.
Opportunities for Improvement in Budget Utilization
Even with a powerful dashboard, organizations often face challenges. Here are areas where improvement is possible:
🔹 Data Accuracy – Ensure the raw data in the support sheet is regularly updated.
🔹 Consistency – Standardize expense categorization to avoid reporting errors.
🔹 Collaboration – Encourage departments to provide timely budget reports.
🔹 Automation – Integrate Excel with accounting systems to reduce manual entry.
🔹 Forecasting – Enhance the dashboard with predictive models for future spending.
Best Practices for the Office Budget Utilization Dashboard
To maximize the value of this dashboard, follow these best practices:
-
Update Data Frequently – Keep your support sheet updated weekly or monthly.
-
Use Clear Categories – Define spending categories in a consistent manner.
-
Apply Conditional Formatting – Highlight overspending with red indicators.
-
Add Slicers and Filters – Allow users to analyze data by department, vendor, or month.
-
Review Trends Regularly – Compare month-to-month performance to stay on track.
-
Train Staff – Provide training so managers understand how to read and use the dashboard.
-
Secure Access – Protect sensitive financial data with password restrictions.
How to Use the Office Budget Utilization Dashboard
Here’s a simple step-by-step process:
-
Input Data into the support sheet (budgets, actual spends, categories, vendors, months).
-
Navigate using the left-side panel to choose Overview, Department, Category, Vendor, or Monthly view.
-
Analyze Charts to detect variances and trends.
-
Take Action – Address overspending, reallocate budgets, or renegotiate with vendors.
-
Review Monthly – Ensure continuous monitoring and improvement.
Real-World Applications of the Dashboard
This dashboard is highly useful for:
-
Small businesses – Track office expenses without needing complex ERP systems.
-
Large organizations – Monitor department-wise performance.
-
Non-profits – Ensure funds are utilized effectively.
-
Educational institutions – Manage administrative and operational budgets.
-
Corporate offices – Align financial spending with company goals.
Conclusion
An Office Budget Utilization Dashboard in Excel is a practical and cost-effective tool that simplifies financial tracking. It not only improves visibility but also empowers managers to make data-driven decisions. By analyzing departments, categories, vendors, and trends, organizations can prevent budget leaks and achieve better cost efficiency.
With the right practices in place, this dashboard can transform the way your organization manages budgets. Whether you are a small office or a large enterprise, Excel remains one of the most powerful and flexible tools for budget management.
Click to Purchases Office Budget Utilization Dashboard in Excel
Frequently Asked Questions (FAQs)
1. What is the purpose of a Budget Utilization Dashboard?
It helps organizations compare their approved budget against actual spending, track variances, and identify areas of overspending or underutilization.
2. Can small businesses use this dashboard?
Yes, small businesses can use it effectively because it is built in Excel, which is affordable and easy to use.
3. How often should I update the support sheet?
Ideally, update it monthly or weekly depending on the volume of expenses and reporting requirements.
4. Can the dashboard handle multiple currencies?
Yes, you can modify the unit format in Excel to display multiple currencies if required.
5. How does this dashboard help in cost control?
By showing variances in real time, it allows managers to take corrective actions before overspending becomes a problem.
6. Is training required to use this dashboard?
Basic Excel knowledge is enough. However, a short training session can improve adoption and effectiveness.
7. Can I integrate this dashboard with other financial systems?
Yes, with the help of Excel’s import features, Power Query, or macros, you can pull data directly from accounting systems.
8. Does this dashboard work for non-profit organizations?
Absolutely. Non-profits can use it to ensure funds are allocated and utilized effectively.
Visit our YouTube channel to learn step-by-step video tutorials