Employee health and well-being have become top priorities for organizations worldwide. Companies now realize that healthier employees are more productive, motivated, and satisfied. However, tracking wellness initiatives, measuring participation, and evaluating health outcomes can be challenging if done manually.
This is where a Corporate Wellness Program Dashboard in Excel comes into play. It provides a structured, data-driven way to track, analyze, and improve corporate wellness programs. In this article, we will dive deep into how this dashboard works, its key features, benefits, best practices, and how it can transform workplace wellness strategies.
Click to Purchases Corporate Wellness Program Dashboard in Excel
What Is a Corporate Wellness Program Dashboard in Excel?
A Corporate Wellness Program Dashboard in Excel is a prebuilt, ready-to-use Excel template that helps businesses monitor wellness initiatives. It consolidates all health-related data, such as participation rates, budget vs. cost, health improvements, and demographic analysis, into a single view.
With Excel’s analytical and visualization capabilities, this dashboard makes it easy for HR teams, managers, and executives to measure the impact of wellness programs on employee health and organizational productivity.
Key Features of the Corporate Wellness Program Dashboard
This dashboard includes multiple analytical pages, each designed to address specific aspects of wellness data. It also comes with a page navigator for seamless movement between sections.
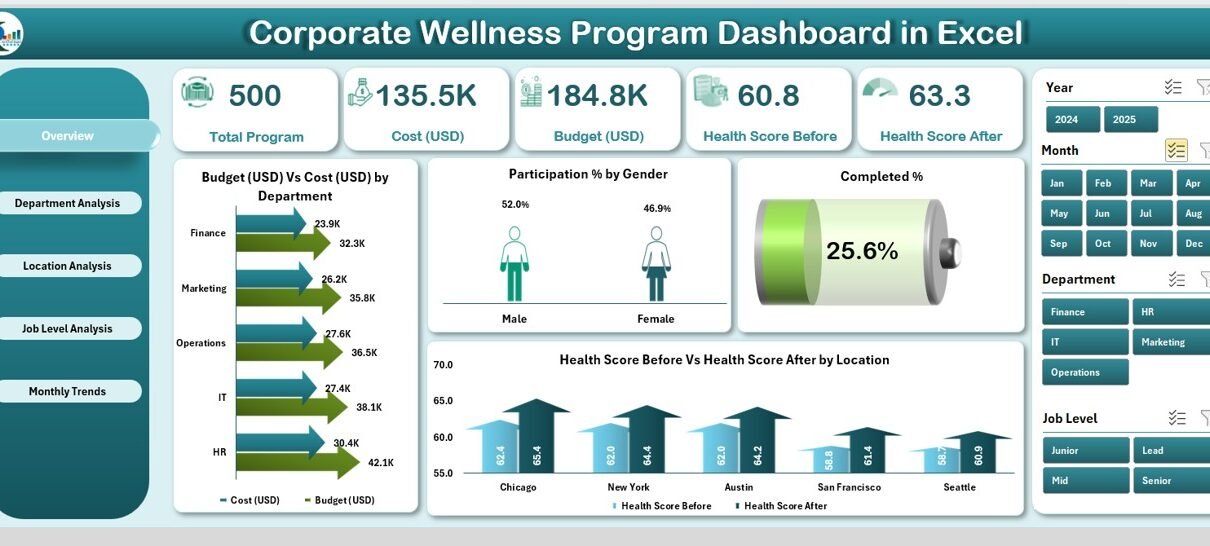
Overview Page
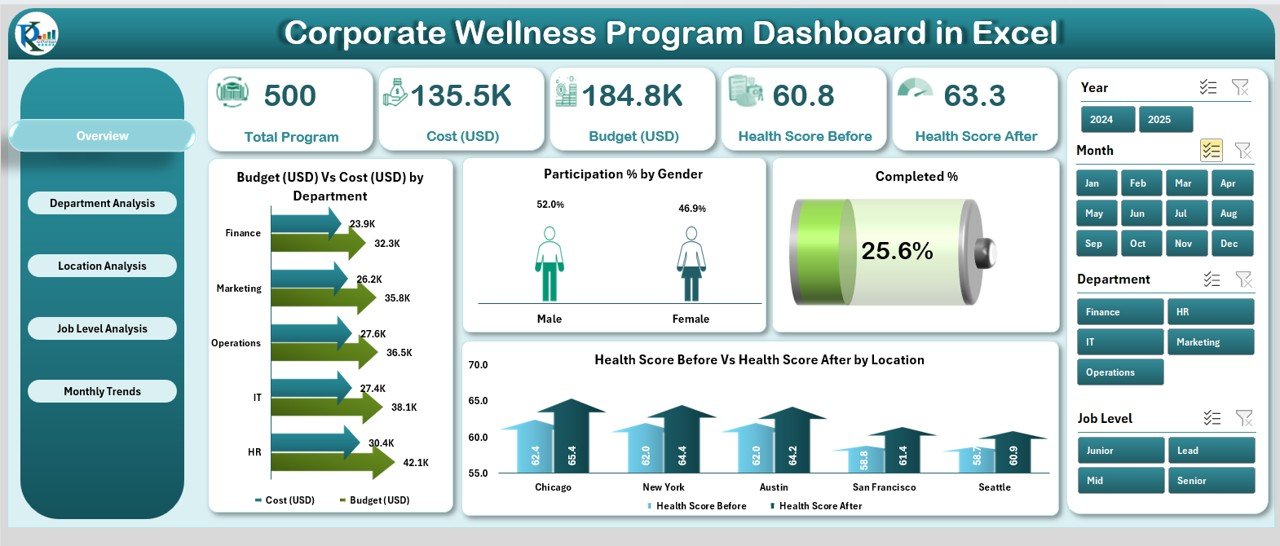
The Overview Page acts as the central hub of the dashboard. It provides a high-level summary of the wellness program’s performance, including:
-
Cards for Quick Stats: Instant figures like budget, cost, participation %, completion rate, and health scores.
Charts:
- Budget (USD) vs. Cost (USD) by Department
- Participation % by Gender
- Completion %
- Health Score Before vs. Health Score After by Location
This gives leadership an instant snapshot of progress and areas of focus.
Department Analysis
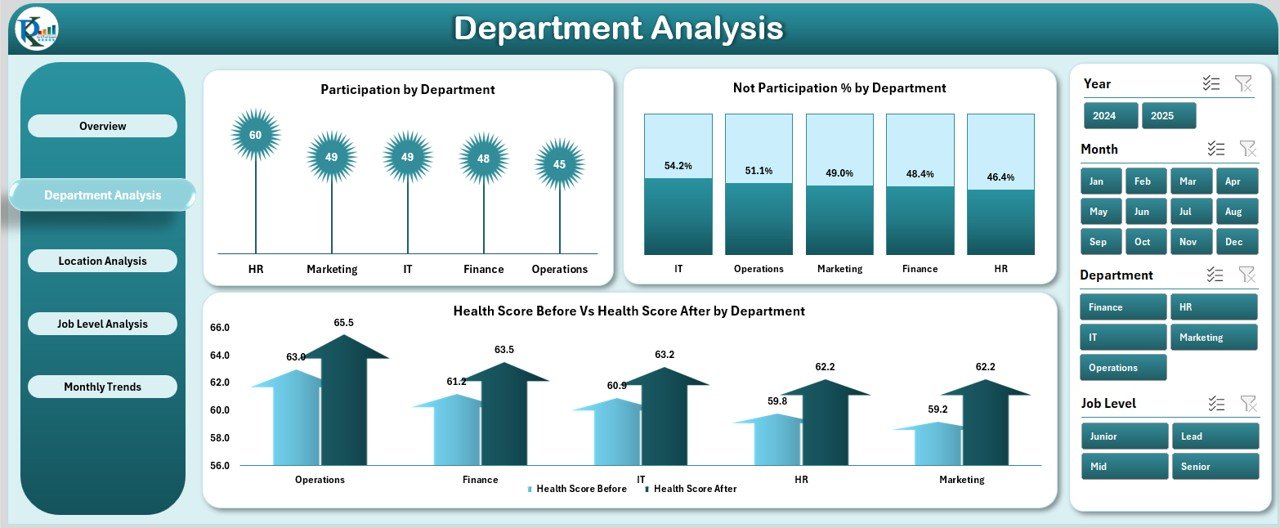
This section provides insights at the departmental level. HR managers can quickly identify which departments are actively participating and which need more encouragement.
Charts included:
- Participation by Department
- Non-Participation % by Department
- Health Score Before vs. Health Score After by Department
Such insights help allocate resources more effectively.
Location Analysis
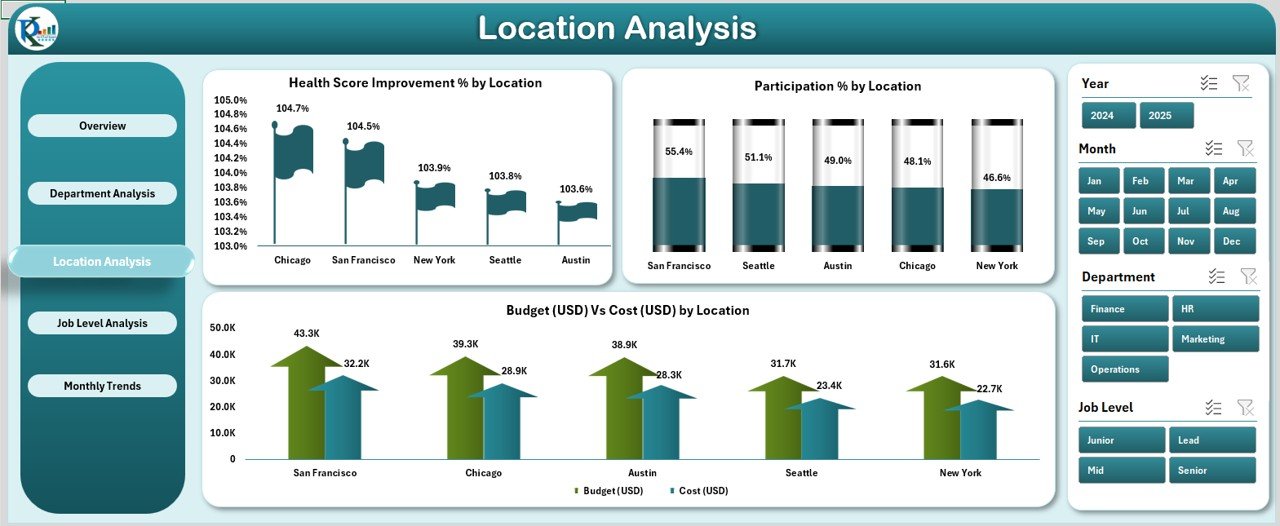
Large organizations with multiple branches or offices can benefit from this page.
Charts included:
- Health Score Improvement % by Location
- Participation % by Location
- Budget (USD) vs. Cost (USD) by Location
This allows HR teams to compare different branches and identify locations where engagement or wellness improvements are lagging.
Job Level Analysis
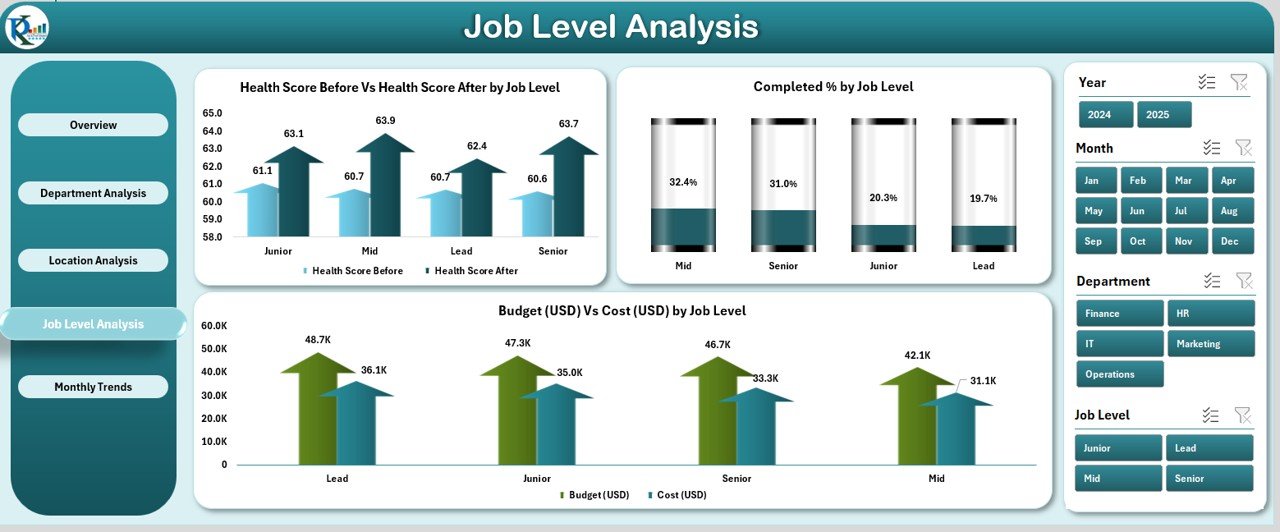
Employee engagement often varies by job role or seniority. This page highlights differences in participation and outcomes across job levels.
Charts included:
- Health Score Before vs. After by Job Level
- Completion % by Job Level
- Budget (USD) vs. Cost (USD) by Job Level
This information helps tailor programs to suit both executives and entry-level employees.
Monthly Trends
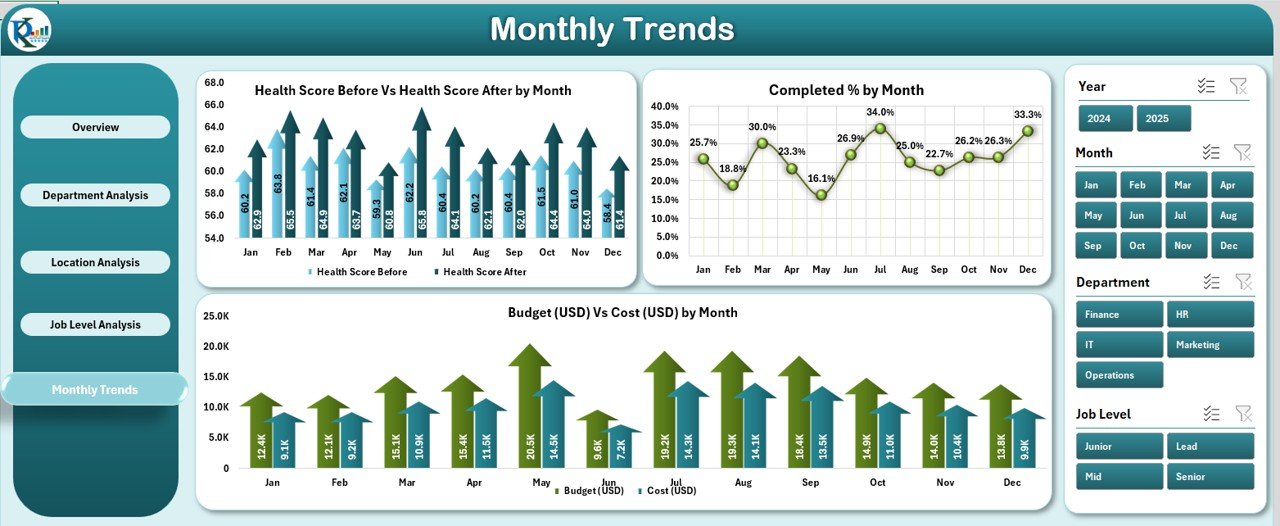
Consistency in participation and improvement over time is crucial. This page focuses on time-based analysis.
Charts included:
- Health Score Before vs. After by Month
- Completion % by Month
- Budget (USD) vs. Cost (USD) by Month
Tracking trends helps organizations assess whether their initiatives are producing sustainable results.
Click to Purchases Corporate Wellness Program Dashboard in Excel
Why Use Excel for a Corporate Wellness Program Dashboard?
While many companies use specialized HR tools, Excel remains a powerful choice because:
-
It is widely available and requires no extra investment.
-
It allows customization according to business needs.
-
It supports interactive charts, slicers, and conditional formatting for effective visualization.
-
It can handle large datasets and produce instant reports.
For organizations already comfortable with Excel, this solution offers flexibility without additional costs.
Advantages of Corporate Wellness Program Dashboard in Excel
Implementing this dashboard comes with several benefits:
✅ Centralized Tracking: Consolidates all wellness-related data into one place.
✅ Data-Driven Decisions: Provides insights for HR and leadership to make informed choices.
✅ Employee Engagement: Encourages higher participation by showing tangible results.
✅ Cost Management: Compares budgets vs. actual expenses to optimize spending.
✅ Performance Evaluation: Measures improvements in employee health scores.
✅ Customizable: Can be adjusted to fit organizational priorities and program structures.
Opportunities for Improvement in Wellness Programs
Even with a strong dashboard, businesses should always look for ways to improve. Some key opportunities include:
🔹 Adding survey feedback data from employees to measure satisfaction.
🔹 Integrating wearable devices or apps for real-time health data.
🔹 Including productivity metrics to connect wellness with business outcomes.
🔹 Expanding the analysis with predictive models for future participation and costs.
🔹 Automating data entry using Excel VBA or linking to external HR databases.
Best Practices for Using the Corporate Wellness Program Dashboard
To get maximum value from the dashboard, follow these best practices:
Ensure Regular Data Updates
- Keep participation and cost data up to date for accurate insights.
Involve Multiple Stakeholders
- HR, Finance, and Department Heads should collaborate to interpret results.
Set Clear KPIs
- Examples: Participation %, Completion %, Average Health Score Improvement, Budget vs. Cost variance.
Communicate Results to Employees
- Share dashboard highlights to motivate staff and build transparency.
Use Conditional Formatting
- Highlight areas needing attention with color codes for easy interpretation.
Review Monthly Trends
- Regular trend analysis ensures consistent progress and identifies seasonal challenges.
How the Dashboard Transforms Workplace Wellness
Organizations using this Excel dashboard can achieve significant improvements:
-
They increase participation by identifying low-engagement departments.
-
They reduce costs by analyzing budget overspending at specific locations.
-
They improve health outcomes by tracking pre- and post-program health scores.
-
They boost productivity by linking wellness improvements with job performance.
In short, this dashboard turns raw data into actionable strategies.
Conclusion
The Corporate Wellness Program Dashboard in Excel is more than just a reporting tool. It is a complete system for tracking, managing, and improving employee wellness initiatives. With features like department-level analysis, job-level comparisons, and monthly trends, it ensures organizations have a clear picture of both participation and outcomes.
By adopting best practices and continuously improving, companies can transform their wellness programs into strategic assets that benefit both employees and the organization as a whole.
Frequently Asked Questions (FAQs)
1. What is a Corporate Wellness Program Dashboard in Excel?
It is a prebuilt Excel template that tracks employee wellness initiatives, participation, budgets, and outcomes.
2. Who should use this dashboard?
HR teams, wellness program managers, and organizational leaders can use it to monitor and improve wellness efforts.
3. Can the dashboard be customized?
Yes. Excel allows full customization of charts, slicers, KPIs, and layouts.
4. What kind of data is needed for this dashboard?
Participation data, budget and cost figures, employee demographics, and health score improvements are typically included.
5. How often should the data be updated?
Ideally, data should be updated monthly to align with trend analysis and reporting cycles.
6. Is Excel better than specialized wellness software?
For small to medium organizations, Excel is cost-effective and flexible. Larger companies may prefer integrating it with HR systems.
7. Does the dashboard support automation?
Yes. VBA macros and linked databases can automate data entry and reporting.
8. What KPIs can be tracked with this dashboard?
Common KPIs include participation %, completion %, health score improvement, budget vs. cost variance, and demographic engagement.
Visit our YouTube channel to learn step-by-step video tutorials