The cannabis industry is growing at a rapid pace across the world. With legalization spreading and consumer demand increasing, businesses in this industry need reliable tools to track performance, improve efficiency, and meet regulatory requirements. One of the best ways to achieve this is by using a Cannabis Industry KPI Dashboard in Power BI.
This article will explain everything about this dashboard, including its features, benefits, advantages, best practices, and frequently asked questions. Whether you are a grower, distributor, or retailer in the cannabis sector, this guide will help you understand how a Power BI dashboard can transform your data into actionable insights.
Click to Purchases Cannabis Industry KPI Dashboard in Power BI
What Is a Cannabis Industry KPI Dashboard in Power BI?
A Cannabis Industry KPI Dashboard in Power BI is a ready-to-use reporting solution designed to monitor key performance indicators (KPIs) relevant to cannabis operations. Instead of working with scattered spreadsheets or manual reports, businesses can consolidate all critical metrics in one interactive Power BI dashboard.
The dashboard uses Excel-based data sources for inputs and presents results through Power BI visuals, slicers, and drill-through functionality. It not only saves time but also enhances accuracy, transparency, and decision-making across the cannabis value chain.
Key Features of the Cannabis Industry KPI Dashboard
This dashboard has three core pages, each serving a unique purpose:
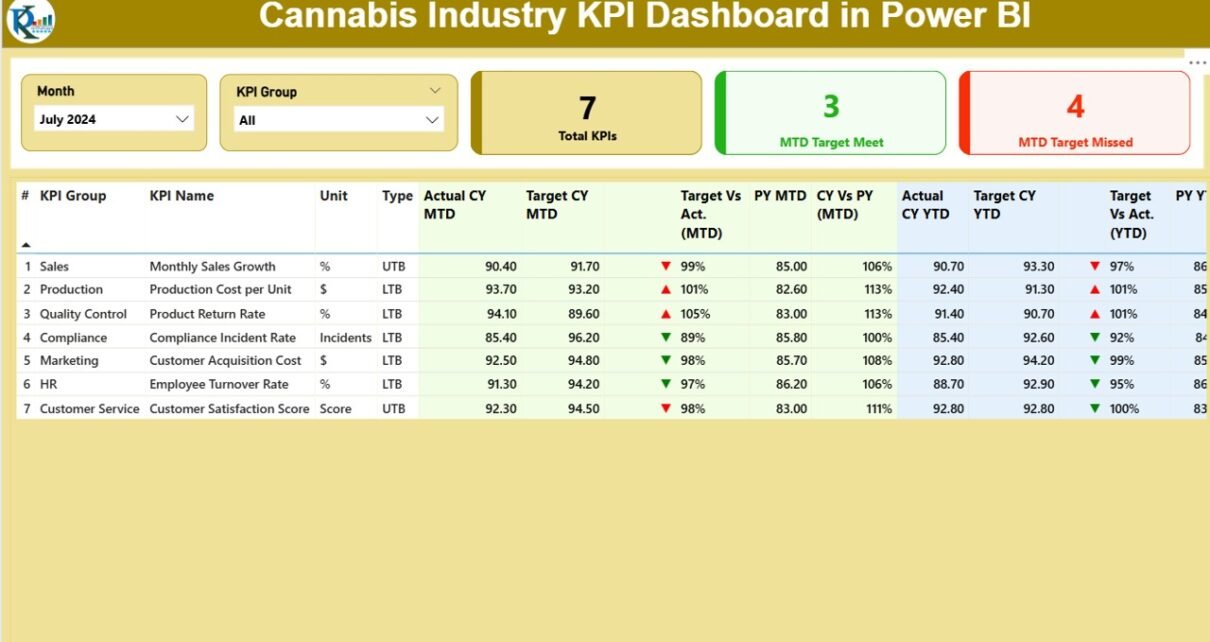
Summary Page
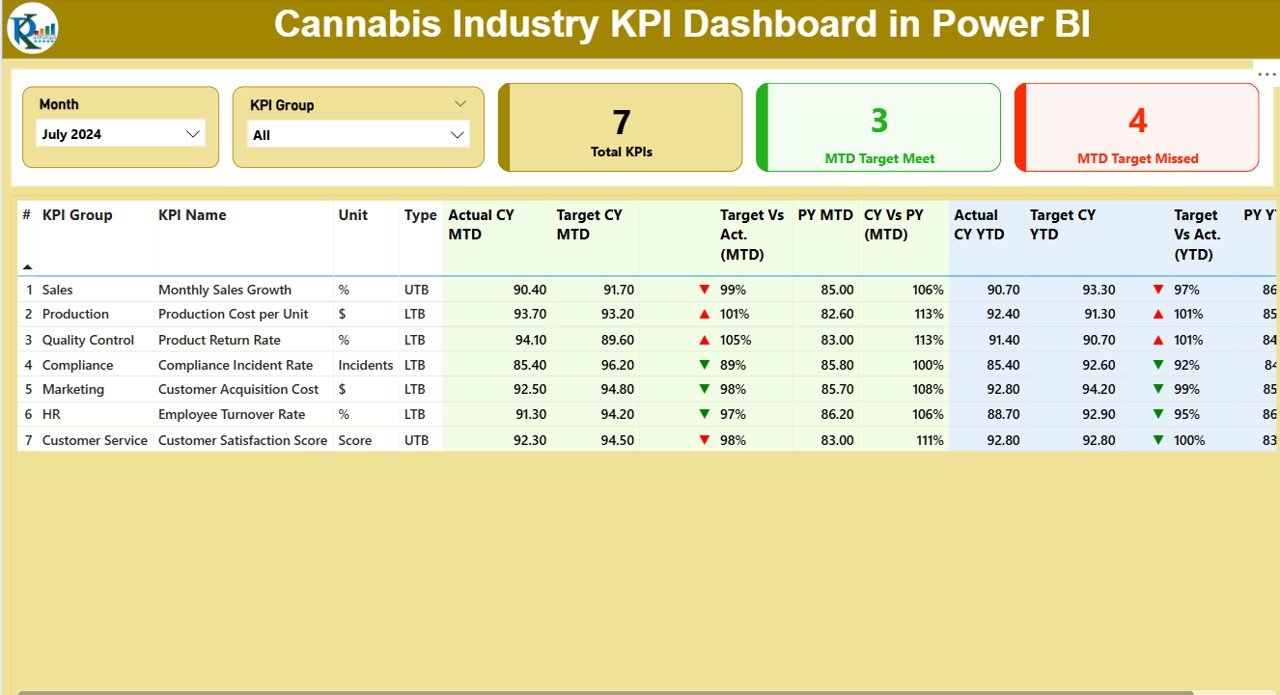
The summary page gives a high-level overview of all KPIs with slicers for Month and KPI Group.
It includes:
Cards displaying:
- Total KPIs count
- MTD (Month-to-Date) Target Met count
- MTD Target Missed count
Detailed KPI Table with:
- KPI Number
- KPI Group
- KPI Name
- Unit of measurement
- Type (LTB = Lower the Better, UTB = Upper the Better)
- Actual CY MTD (Current Year Month-to-Date actuals)
- Target CY MTD
- MTD Icon (green ▲ or red ▼ for status)
- Target vs Actual (MTD %)
- PY MTD (Previous Year Month-to-Date actuals)
- CY vs PY (MTD %)
- Actual CY YTD (Year-to-Date actuals)
- Target CY YTD
- YTD Icon (status indicators)
- Target vs Actual (YTD %)
- PY YTD
- CY vs PY (YTD %)
This structured approach ensures managers can evaluate performance across time frames at a glance.
KPI Trend Page
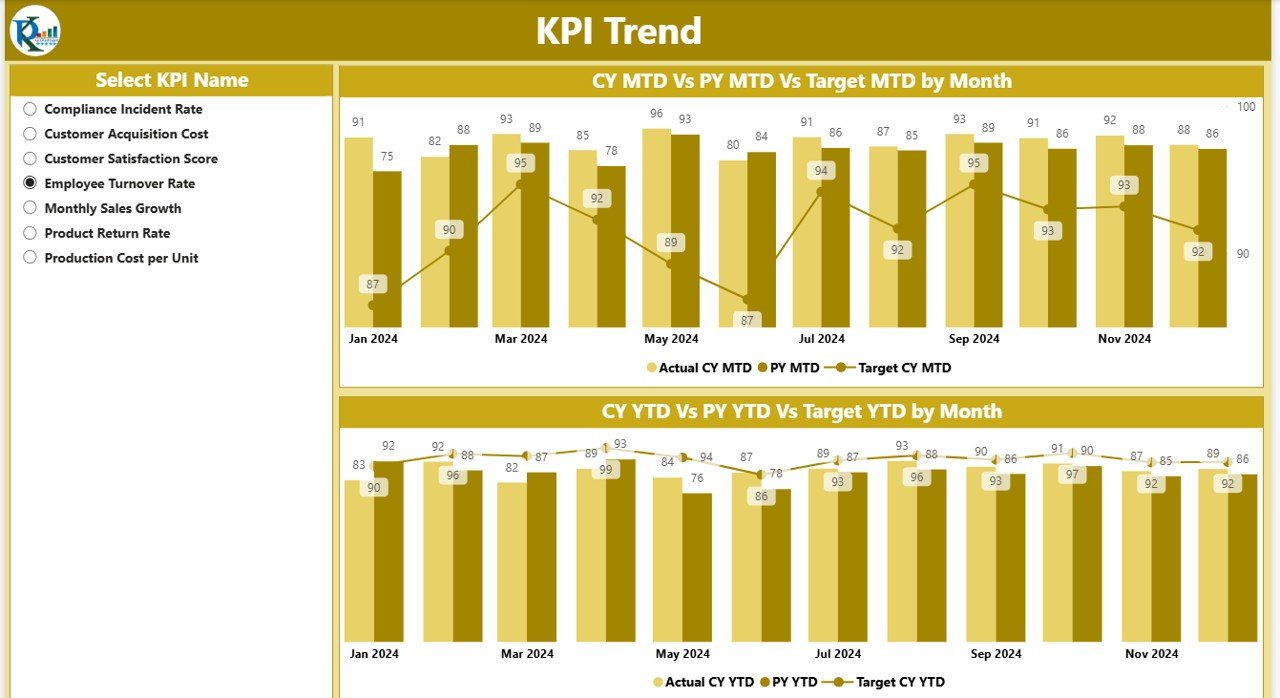
The KPI Trend page focuses on visualizing performance trends.
-
It shows two combo charts comparing Actuals, Targets, and Previous Year numbers for both MTD and YTD.
-
A slicer allows users to select specific KPI names to drill deeper.
This helps businesses identify patterns, spot inefficiencies, and track progress against goals.
KPI Definition Page
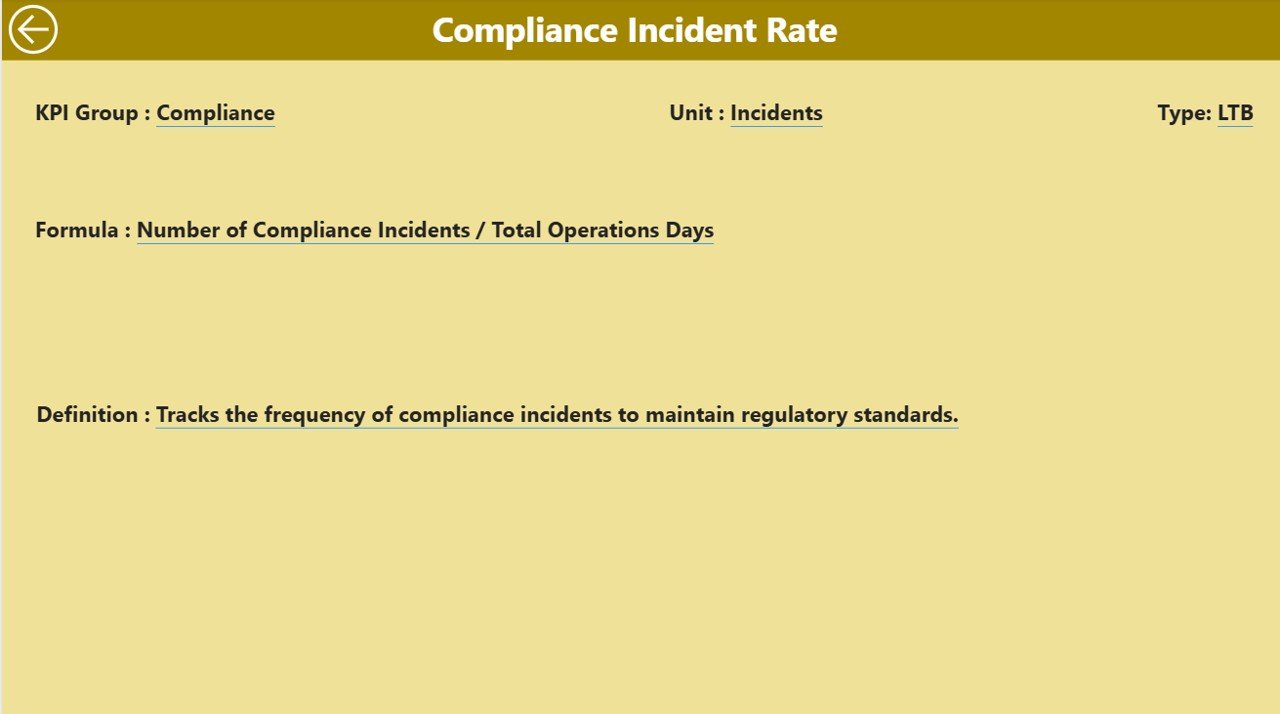
The KPI Definition page is a hidden drill-through page. From the Summary page, users can drill down into specific KPIs to see:
-
KPI Formula
-
KPI Definition
-
Measurement unit
-
KPI Group classification
Click to Purchases Cannabis Industry KPI Dashboard in Power BI
A back button on the top-left corner makes navigation seamless. This page ensures transparency by clarifying how each KPI is calculated and why it matters.
Excel Data Input Structure
The dashboard is powered by an Excel data file with three worksheet tabs:
Input_Actual
- Fill in actual KPI values.
- Columns: KPI Name, Month (first date of the month), MTD, YTD.
Input_Target
- Fill in target KPI values.
- Columns: KPI Name, Month (first date of the month), MTD, YTD.
KPI Definition
- Provide metadata.
- Columns: KPI Number, KPI Group, KPI Name, Unit, Formula, Definition, Type (LTB or UTB).
This simple structure makes data entry easy while ensuring Power BI visualizations remain dynamic.
Why Do Cannabis Businesses Need a KPI Dashboard?
The cannabis industry is unique. It faces strict compliance rules, fluctuating demand, supply chain challenges, and evolving consumer preferences. Managing all these complexities requires real-time visibility into performance metrics.
A KPI Dashboard helps cannabis businesses:
-
Monitor regulatory compliance
-
Track cultivation efficiency
-
Measure retail performance
-
Compare operational costs vs revenue
-
Evaluate product demand trends
-
Improve forecasting and budgeting
Without such a system, companies risk data silos, compliance issues, and lost opportunities.
Advantages of the Cannabis Industry KPI Dashboard in Power BI
Here are the key advantages of using this dashboard:
✅ Centralized Insights – Consolidates multiple KPIs into one visual report.
✅ Real-Time Tracking – Provides MTD and YTD analysis with status indicators.
✅ Easy Comparisons – Quickly compare current year performance with previous year numbers.
✅ Customizability – Users can modify Excel data and adjust KPI definitions as needed.
✅ Compliance Ready – Tracks KPIs critical for meeting government and industry regulations.
✅ Data-Driven Culture – Encourages informed decisions across departments.
✅ Cost Efficiency – Saves time by automating reporting and reducing manual data entry.
Opportunities for Improvement in Cannabis KPI Reporting
While the dashboard offers strong features, businesses can still improve reporting by:
🔹 Adding predictive analytics for sales and yield forecasts.
🔹 Integrating inventory and POS systems for real-time updates.
🔹 Expanding KPI categories to include environmental sustainability metrics.
🔹 Enhancing data security given the sensitive nature of cannabis business.
🔹 Providing mobile-friendly versions for managers on the go.
Best Practices for Using the Cannabis Industry KPI Dashboard
To get maximum value, follow these best practices:
📌 Define Clear KPIs – Focus on metrics that directly impact performance, such as sales growth, compliance rate, or cultivation yield.
📌 Update Data Regularly – Keep actual and target numbers updated each month.
📌 Use Slicers Effectively – Filter by KPI group or month to isolate trends.
📌 Review PY Comparisons – Always check year-over-year performance to gauge improvement.
📌 Customize KPI Definitions – Adjust formulas to align with your business strategy.
📌 Train Staff – Ensure employees understand how to interpret and use dashboard results.
📌 Automate Where Possible – Connect the dashboard to live data sources for real-time reporting.
How Can Different Stakeholders Use This Dashboard?
-
Executives: Monitor business health, compliance, and profitability.
-
Operations Managers: Track cultivation efficiency, logistics, and quality.
-
Retail Managers: Evaluate sales, customer trends, and stock performance.
-
Finance Teams: Compare costs, budgets, and revenue vs targets.
-
Regulatory Officers: Ensure compliance with industry standards.
Conclusion
The Cannabis Industry KPI Dashboard in Power BI is more than just a reporting tool. It is a strategic solution that empowers cannabis businesses to track performance, improve operations, and stay compliant with regulations. By combining Excel input sheets with Power BI’s visual power, the dashboard provides clarity, accuracy, and actionable insights.
As the cannabis industry continues to grow, companies that adopt data-driven decision-making will have a clear advantage. With the right KPIs and a well-structured dashboard, businesses can reduce risks, optimize operations, and build a sustainable future.
Frequently Asked Questions (FAQs)
1. What KPIs should a cannabis business track?
Businesses should track cultivation yield, sales revenue, compliance rate, operational cost, product returns, and customer satisfaction.
2. Can this dashboard be customized for different cannabis companies?
Yes. The dashboard is highly customizable. You can add or remove KPIs, change definitions, and integrate additional data sources.
3. How often should I update the dashboard?
You should update the Excel input sheets monthly. However, with live integrations, updates can happen in real-time.
4. Is Power BI better than Excel for cannabis reporting?
Yes. While Excel works well for data input, Power BI offers advanced visualizations, interactive analysis, and easier comparisons.
5. Can this dashboard help with compliance?
Absolutely. By tracking compliance-related KPIs, businesses can ensure they meet government and industry standards.
6. Do I need technical expertise to use this dashboard?
No. The template is ready-to-use. Basic knowledge of Excel and Power BI navigation is enough to operate it.
7. Can I integrate this with other systems like POS or ERP?
Yes. With Power BI’s connectivity features, you can integrate the dashboard with multiple data systems for real-time reporting.
Visit our YouTube channel to learn step-by-step video tutorials