Managing contracts effectively has become a vital part of business success. Contracts define relationships, responsibilities, and commitments between organizations and their stakeholders. Without proper monitoring, companies risk missed deadlines, compliance failures, and revenue leakage. To solve these challenges, businesses are adopting digital solutions like the Contract Management Dashboard in Power BI.
This dashboard turns raw contract data into interactive insights. With features like approval tracking, renewal analysis, and responsible person monitoring, it helps decision-makers understand contract performance at a glance. In this article, we will explore the structure of the Contract Management Dashboard, its advantages, best practices, and how organizations can maximize its impact.
Click to Purchases Contract Management Dashboard in Power BI
What Is a Contract Management Dashboard in Power BI?
A Contract Management Dashboard in Power BI is a visual reporting tool designed to track and analyze contracts throughout their lifecycle. By integrating Excel-based data with Power BI’s powerful visualization features, businesses can see key performance indicators (KPIs), contract statuses, renewal patterns, and responsible person performance in real-time.
Instead of manual tracking or scattered spreadsheets, this dashboard offers a centralized and interactive view of all contracts. Managers can use slicers to filter data, analyze approvals and rejections, and monitor trends across months, departments, and responsible persons.
Key Features of the Contract Management Dashboard
The Contract Management Dashboard in Power BI is structured into five analytical pages, each offering unique insights:
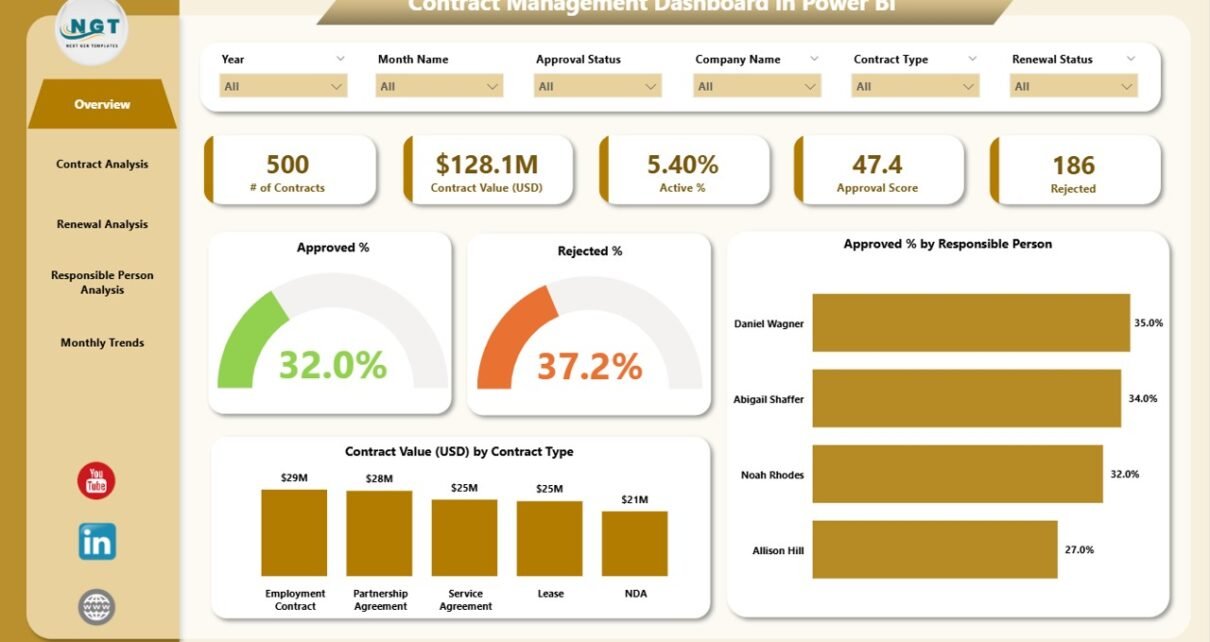
Overview Page
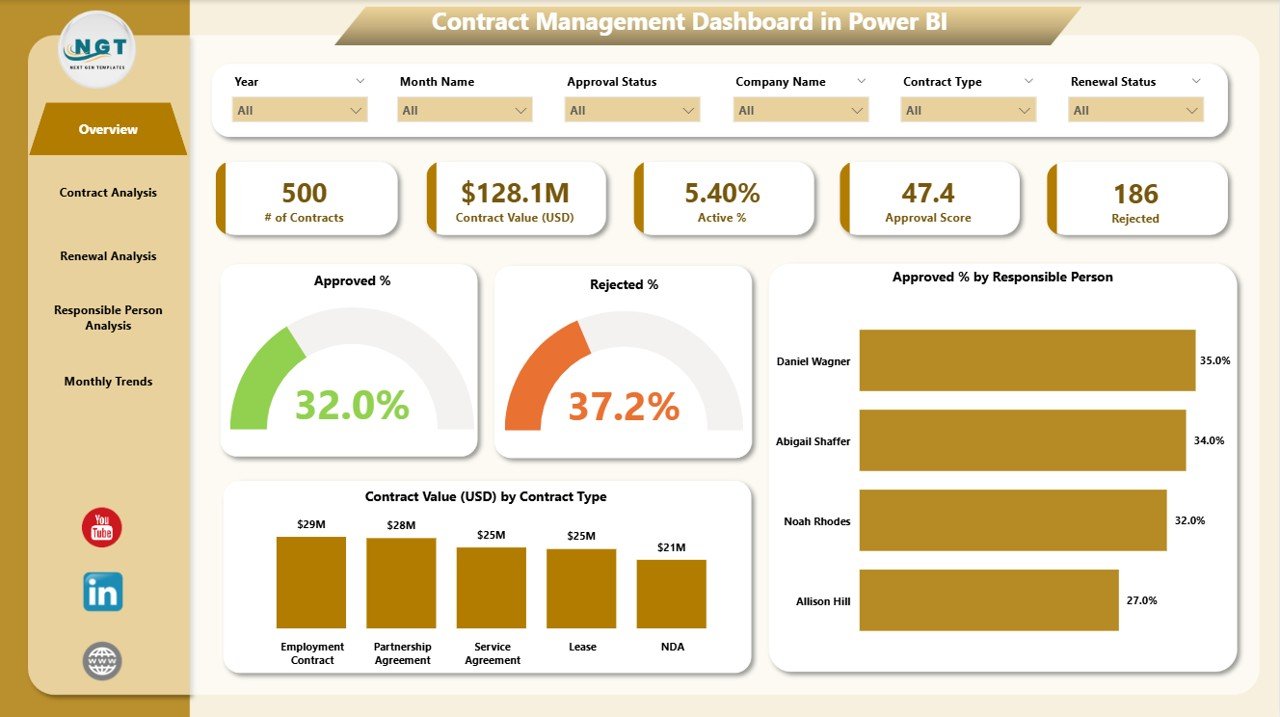
The Overview Page is the main entry point into the dashboard. It provides a quick summary of contract status and approvals.
Charts:
- Approved % by Responsible Person
- Contract Value (USD) by Contract Type
This page gives executives a high-level picture of contract performance, making it easy to spot red flags or positive trends.
Contract Analysis
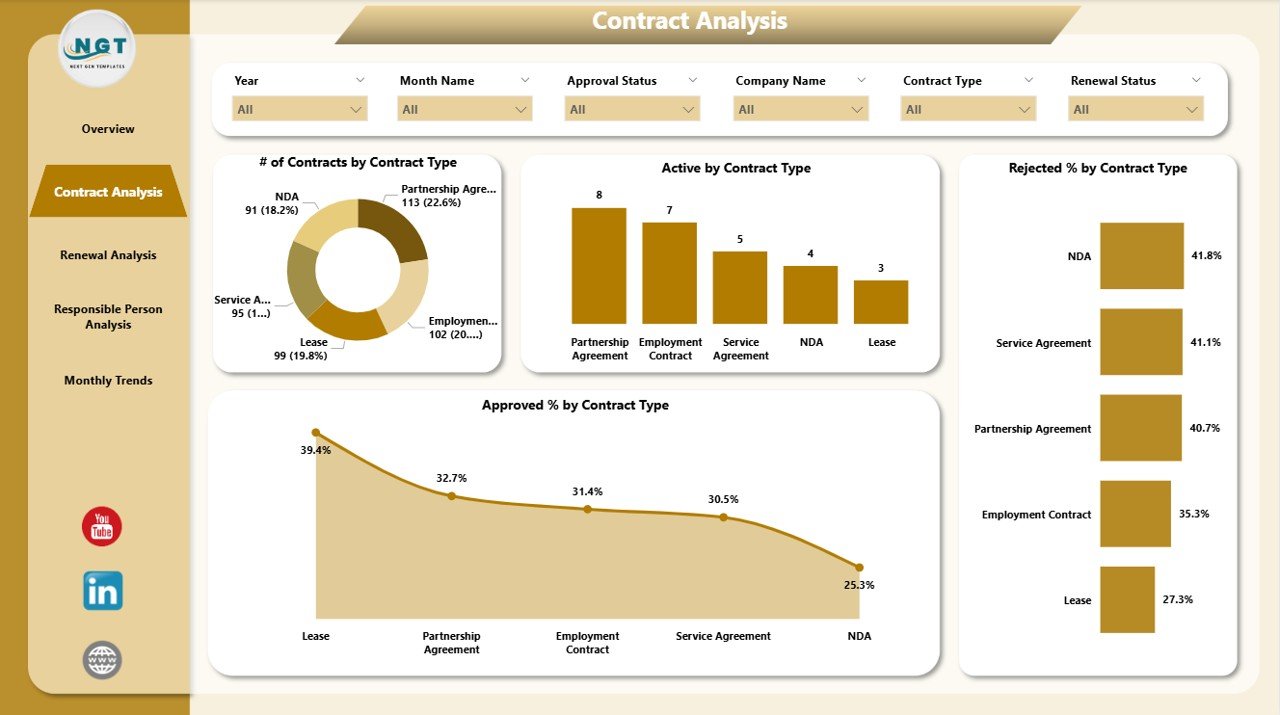
The Contract Analysis Page dives deeper into how contracts are distributed across types.
Charts:
- Number of Contracts by Contract Type
- Active Contracts by Contract Type
- Rejection % by Contract Type
- Approval % by Contract Type
This section helps businesses understand which contract types are performing well and which need attention. For example, high rejection rates in specific contract categories may indicate compliance issues or unrealistic terms.
Renewal Analysis
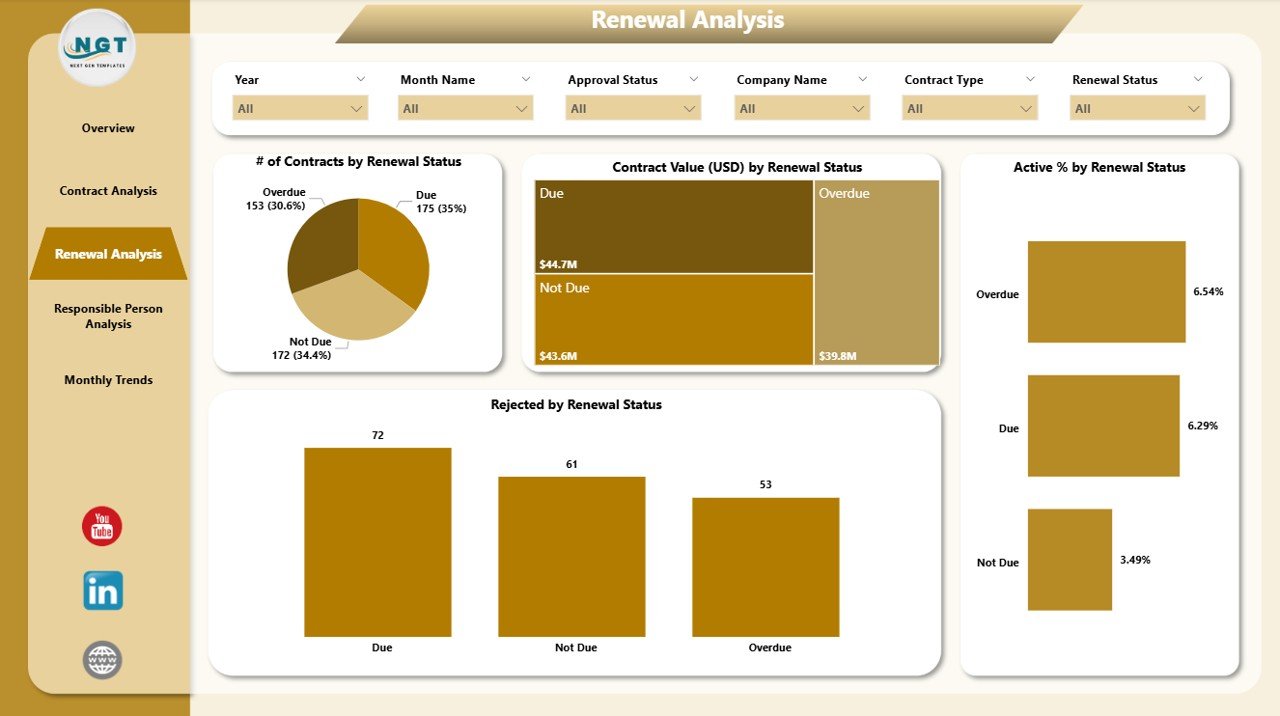
Renewals often determine ongoing revenue and long-term business relationships. The Renewal Analysis Page ensures managers can track these critical events.
Charts:
- Number of Contracts by Renewal Status
- Active % by Renewal Status
- Rejected by Renewal Status
- Approved % by Renewal Status
By monitoring renewals, businesses can plan ahead, negotiate better terms, and avoid sudden contract expirations.
Click to Purchases Contract Management Dashboard in Power BI
Responsible Person Analysis
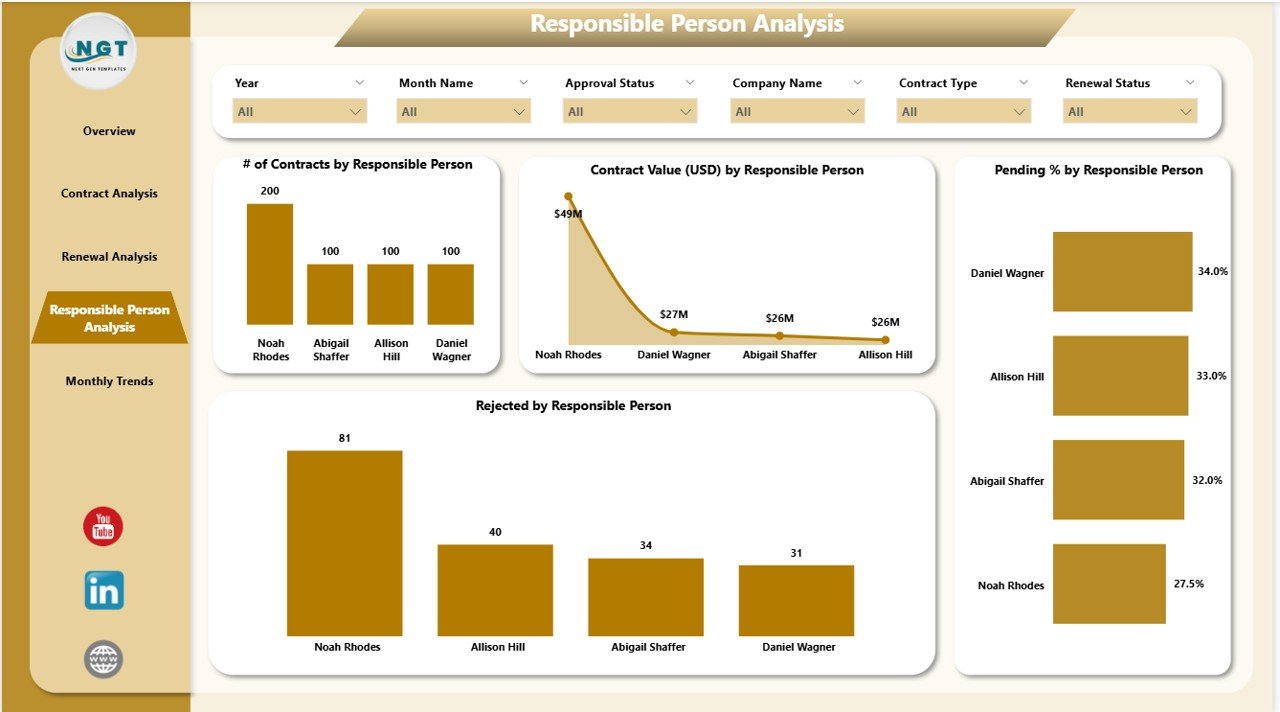
Not all contracts perform equally, and much of that performance depends on the responsible person. The Responsible Person Analysis Page highlights who is handling contracts effectively.
Charts:
- Number of Contracts by Responsible Person
- Contract Value (USD) by Responsible Person
- Pending % by Responsible Person
- Rejected % by Responsible Person
This feature brings accountability and transparency, helping managers identify top performers and areas for improvement.
Monthly Trends
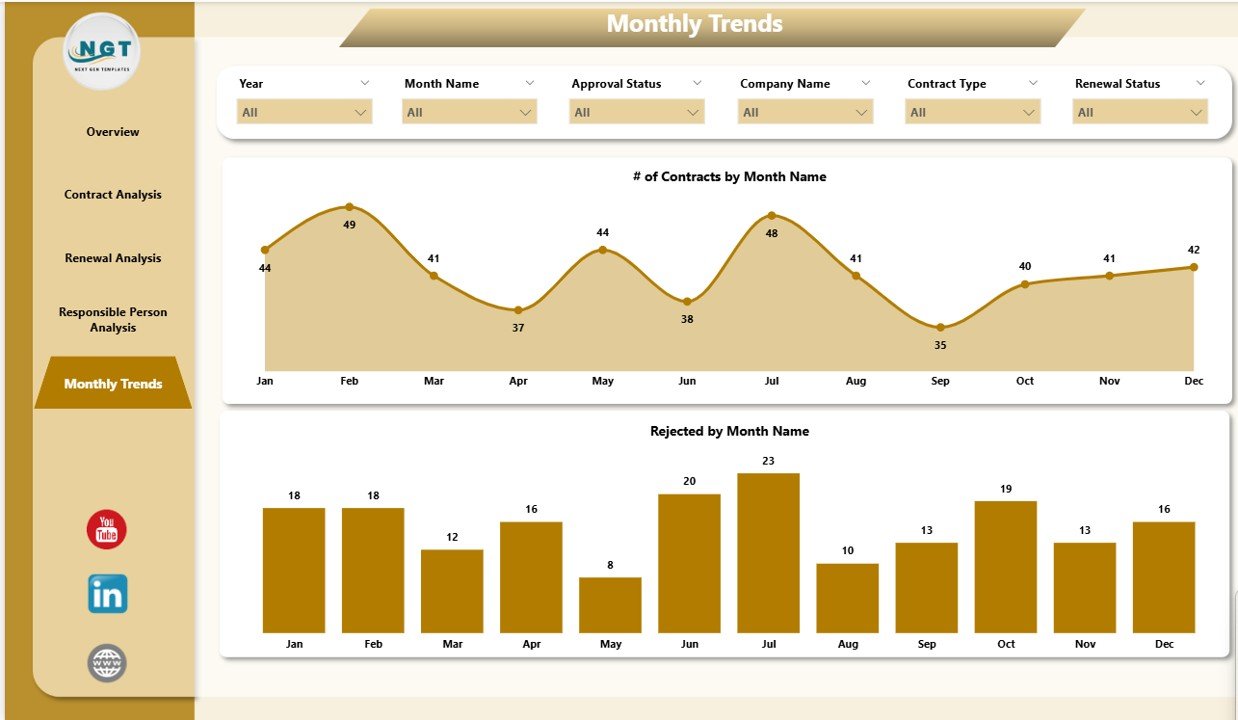
Contracts evolve over time, and so do their approval and rejection patterns. The Monthly Trends Page captures this evolution.
Charts:
- Number of Contracts by Month Name
- Rejection % by Month Name
This page helps businesses identify seasonal trends. For instance, some months may show higher approvals due to annual renewals, while others may see spikes in rejections.
Why Use Power BI for Contract Management?
Many businesses wonder why Power BI is the right tool for contract management. The answer lies in its flexibility, interactivity, and cost-effectiveness.
-
Centralized reporting: Integrates data from Excel or databases into one view.
-
Interactive slicers: Allow users to filter by contract type, person, status, or month.
-
Real-time insights: Dashboards refresh as data updates, ensuring accuracy.
-
User-friendly: No advanced coding or IT knowledge required.
-
Scalable: Works for small businesses and large enterprises alike.
Advantages of Contract Management Dashboard in Power BI
Implementing this dashboard provides multiple benefits:
📊 Better Visibility: Managers get a full picture of contracts without searching across multiple files.
✅ Improved Compliance: Tracks approvals, renewals, and rejections to ensure adherence to policies.
⏱️ Time Savings: Automates reporting and eliminates manual errors.
💰 Cost Control: Identifies contract leakages and helps optimize values.
👥 Accountability: Tracks performance of responsible persons.
🔄 Trend Analysis: Highlights monthly or yearly patterns for better planning.
Opportunities for Improvement in Contract Management Dashboards
Even though Power BI dashboards are powerful, there are areas businesses can enhance:
🔧 Automation of Data Updates: Automating the connection to data sources reduces manual refresh work.
🌐 Integration with Other Systems: Linking the dashboard to ERP or CRM tools adds more value.
🔒 Enhanced Security: Implementing row-level security ensures sensitive contract data is visible only to authorized users.
📱 Mobile Accessibility: Optimizing the dashboard for mobile devices improves accessibility for on-the-go managers.
📊 Predictive Analysis: Using AI features in Power BI can forecast contract approvals, rejections, and renewals.
Best Practices for Using a Contract Management Dashboard in Power BI
To get the most out of this dashboard, businesses should follow some best practices:
-
Define Clear KPIs: Choose metrics like approval %, rejection %, and renewal rates carefully.
-
Update Data Regularly: Keep Excel or database records accurate to maintain dashboard integrity.
-
Use Slicers Effectively: Train users to filter data smartly for faster insights.
-
Create Access Levels: Limit data visibility based on user roles.
-
Review Trends Monthly: Regularly analyze patterns to make proactive decisions.
-
Integrate Feedback: Encourage users to share improvements for dashboard usability.
Conclusion
The Contract Management Dashboard in Power BI is more than a reporting tool—it is a strategic asset. By providing real-time visibility, improving accountability, and highlighting trends, it empowers businesses to manage contracts effectively. Organizations that adopt such dashboards gain an edge in compliance, cost control, and decision-making.
When used with best practices, this dashboard can transform contract management into a data-driven, efficient, and transparent process.
Frequently Asked Questions (FAQs)
1. What is a Contract Management Dashboard in Power BI?
It is a reporting tool that visualizes contract data, including approvals, rejections, renewals, and responsible person performance, using Power BI.
2. How does this dashboard help businesses?
It improves compliance, saves time, provides visibility into contract status, and holds responsible persons accountable.
3. Can small businesses use this dashboard?
Yes. Power BI dashboards are scalable and cost-effective, making them suitable for both small and large businesses.
4. How is data connected to the dashboard?
Data is usually stored in an Excel sheet or database, which Power BI imports and visualizes.
5. Can the dashboard show future contract trends?
Yes, with Power BI’s AI features, businesses can forecast renewals, approvals, and rejections.
6. Is the dashboard mobile-friendly?
Yes. Power BI dashboards can be viewed on tablets and smartphones, but optimization improves user experience.
7. What KPIs should be tracked in contract management?
Common KPIs include approval %, rejection %, renewal rates, total contract value, and active vs inactive contracts.
Visit our YouTube channel to learn step-by-step video tutorials