Pharmacies play a crucial role in healthcare. They manage prescriptions, track patient safety, optimize inventory, and ensure compliance with regulations. However, handling these responsibilities efficiently requires more than manual reporting. That is where a Pharmacy KPI Dashboard in Power BI becomes essential.
A Pharmacy KPI Dashboard provides pharmacy managers and business owners with a clear view of performance indicators in real time. By using Microsoft Power BI, pharmacies can visualize data from multiple sources, track critical metrics, and make informed decisions.
This article explains the structure, features, benefits, and best practices of a Pharmacy KPI Dashboard in Power BI. We will also explore practical use cases and answer frequently asked questions.
Click to Purchases Pharmacy KPI Dashboard in Power BI
What Is a Pharmacy KPI Dashboard?
A Pharmacy KPI Dashboard is a data visualization tool built in Power BI that tracks pharmacy performance through Key Performance Indicators (KPIs). It consolidates data such as sales, stock levels, prescription trends, and customer service metrics into interactive reports.
Instead of working with spreadsheets or disconnected systems, pharmacies can use the dashboard to:
-
Monitor business and clinical performance.
-
Compare targets against actual results.
-
Identify areas for cost savings and process improvements.
-
Ensure compliance with healthcare regulations.
Key Features of the Pharmacy KPI Dashboard in Power BI
The Pharmacy KPI Dashboard in Power BI is designed with three main pages. Each page provides unique insights for pharmacy managers and staff.
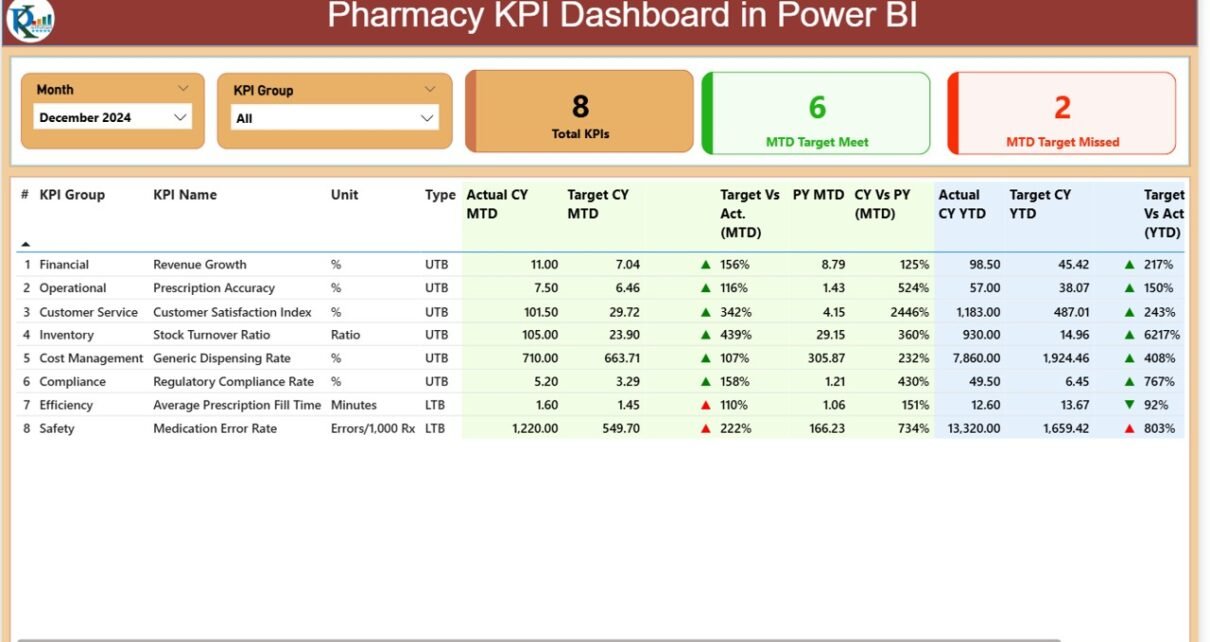
Summary Page
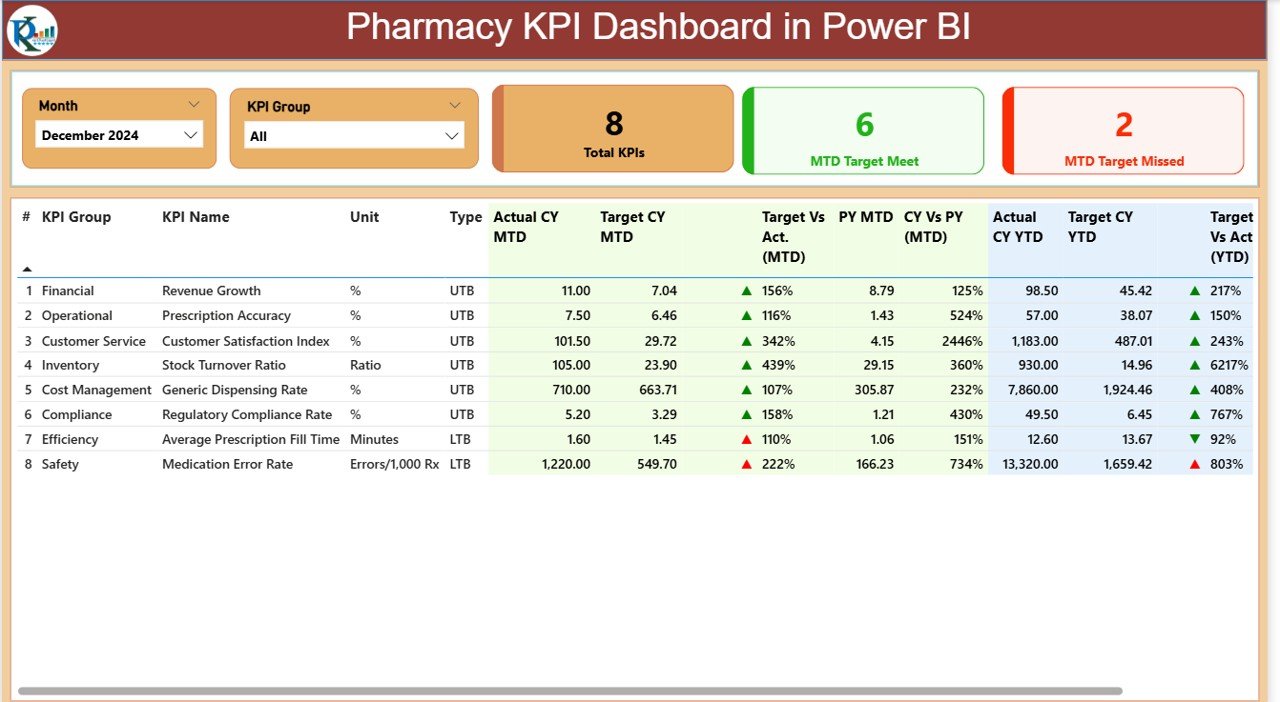
The Summary Page acts as the main control center of the dashboard.
-
Slicers for Month and KPI Group: Allows users to filter data quickly.
-
Cards for Quick Insights: Displays Total KPIs count, MTD (Month-to-Date) Target Met count, and MTD Target Missed count.
Detailed KPI Table: Shows critical fields, including:
- KPI Number (sequence).
- KPI Group (category of KPI).
- KPI Name (indicator being tracked).
- Unit (measurement unit like %, count, or USD).
- Type (LTB = Lower the Better, UTB = Upper the Better).
- Actual CY MTD (current month actuals).
- Target CY MTD (set goal for the month).
- MTD Icons (visual ▲▼ with colors to show performance status).
- Target vs. Actual % (calculated ratio of actual to target).
- PY MTD (previous year’s MTD for comparison).
- CY vs. PY % (month-to-date progress compared with last year).
- Actual CY YTD (year-to-date actual values).
- Target CY YTD (year-to-date goals).
- YTD Icons (performance vs. target in green or red).
- Target vs. Actual (YTD) %.
- PY YTD (last year’s YTD).
- CY vs. PY (YTD) %.
This page offers both a high-level overview and a detailed breakdown of pharmacy KPIs.
KPI Trend Page
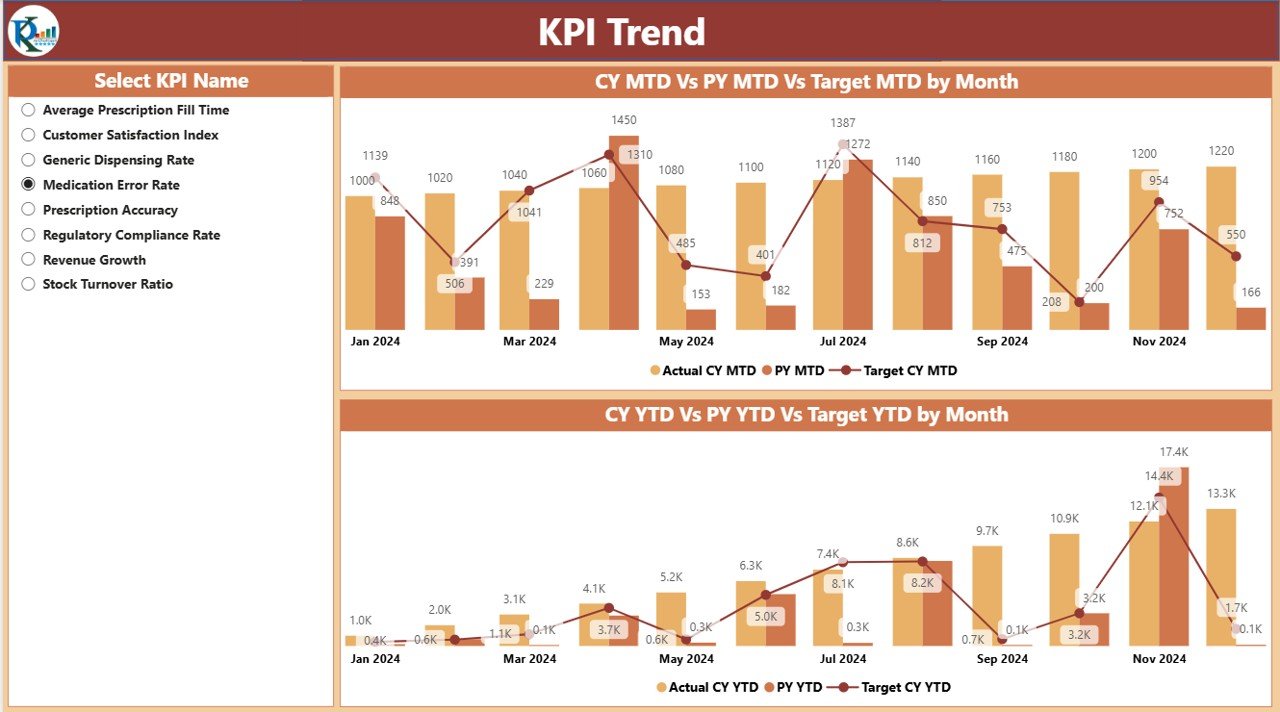
The KPI Trend page focuses on visual analytics.
Two Combo Charts:
- One for MTD trends (Actual vs. Target vs. Previous Year).
- One for YTD trends (Actual vs. Target vs. Previous Year).
-
KPI Selector: A slicer to filter data by specific KPI name.
This view helps managers track performance trends over time and identify whether progress is steady, improving, or declining.
KPI Definition Page
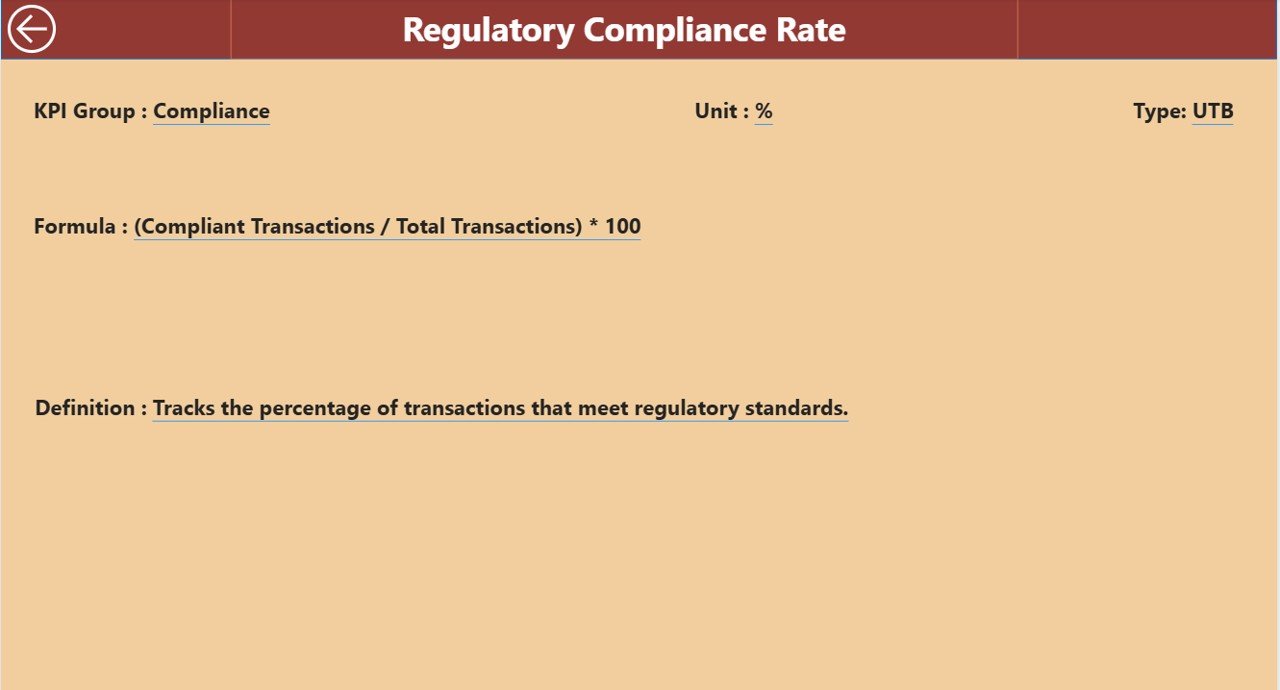
The KPI Definition page is designed as a drill-through feature.
-
It contains detailed formulas and definitions for each KPI.
-
Users can understand exactly how each KPI is calculated.
-
It ensures consistency in measurement across the team.
-
A back button allows quick navigation to the Summary page.
Although hidden from the main navigation, this page is vital for governance and clarity.
Data Source: Excel Integration
The dashboard connects seamlessly with an Excel file that contains structured data. This file includes three worksheets:
Input_Actual
- Fields: KPI Name, Month (use first date of the month), MTD, and YTD values.
- Purpose: Capture real numbers from pharmacy operations.
Input_Target
- Fields: KPI Name, Month (use first date of the month), MTD, and YTD values.
- Purpose: Define the performance goals for the pharmacy.
KPI Definition
- Fields: KPI Number, KPI Group, KPI Name, Unit, Formula, Definition, and Type (LTB or UTB).
- Purpose: Ensure clarity and transparency in KPI measurement.
This Excel-driven structure makes the dashboard flexible, customizable, and easy to update.
Why Pharmacies Need a KPI Dashboard in Power BI
Click to Purchases Pharmacy KPI Dashboard in Power BI
Pharmacies deal with multiple responsibilities—from financial management to patient safety. Without a structured system, managers often struggle with fragmented data.
A Pharmacy KPI Dashboard in Power BI solves this by:
-
Consolidating Data: Integrates data from prescriptions, inventory, staff, and finance.
-
Improving Visibility: Provides real-time performance tracking.
-
Boosting Efficiency: Reduces manual reporting work.
-
Enhancing Decision-Making: Offers actionable insights backed by numbers.
Advantages of a Pharmacy KPI Dashboard
✅ Improved Data Accuracy – Automated data integration reduces errors.
✅ Real-Time Monitoring – Managers can view live performance updates.
✅ Regulatory Compliance – Ensures documentation is aligned with healthcare standards.
✅ Cost Optimization – Identifies areas of overspending in inventory or operations.
✅ Better Patient Outcomes – Tracks service quality, prescription accuracy, and patient safety.
✅ Benchmarking – Compares current performance with targets and past data.
Opportunities for Improvement in Pharmacy Dashboards
Even though Power BI dashboards are powerful, pharmacies can still improve by:
🔹 Adding predictive analytics to forecast demand.
🔹 Integrating with ERP and POS systems for real-time updates.
🔹 Using AI to detect fraud or unusual prescription patterns.
🔹 Including patient feedback metrics to track service quality.
🔹 Expanding KPIs to cover staff training, safety, and satisfaction.
Best Practices for the Pharmacy KPI Dashboard
To maximize the dashboard’s effectiveness, follow these best practices:
-
Define Clear KPIs: Select indicators that align with business and patient-care goals.
-
Use Consistent Data Entry: Standardize how staff record data to avoid mismatches.
-
Update Data Regularly: Refresh data at least daily or weekly.
-
Leverage Drill-Throughs: Use detailed views to understand KPI definitions and formulas.
-
Focus on Actionable Insights: Avoid tracking too many metrics; focus on those that matter most.
-
Train Staff: Ensure all team members understand how to read and use the dashboard.
Practical Use Cases of Pharmacy KPI Dashboards
Inventory Management
- Track stock levels of medicines.
- Avoid shortages or overstocking.
Sales & Revenue Analysis
- Measure monthly sales against targets.
- Identify high-performing products.
Prescription Accuracy
- Monitor prescription error rates.
- Reduce compliance risks.
Staff Performance Tracking
- Evaluate pharmacist productivity.
- Monitor patient satisfaction scores.
Compliance Monitoring
- Track adherence to healthcare regulations.
- Avoid penalties or license risks.
Conclusion
A Pharmacy KPI Dashboard in Power BI transforms how pharmacies monitor and improve their operations. By consolidating data from multiple sources and offering real-time insights, it ensures better decision-making, compliance, and efficiency.
With clear KPI definitions, trend analysis, and Excel integration, this dashboard becomes a powerful ally for pharmacy managers who aim to balance profitability, compliance, and patient care.
Frequently Asked Questions (FAQs)
1. What is a Pharmacy KPI Dashboard?
It is a Power BI tool that tracks pharmacy performance through KPIs such as sales, inventory, and patient safety.
2. Why should pharmacies use Power BI for dashboards?
Power BI allows pharmacies to visualize data in real time, reduce manual work, and make better decisions.
3. What are common KPIs in a pharmacy dashboard?
Common KPIs include prescription accuracy, sales growth, patient satisfaction, stock levels, and compliance rates.
4. Can the dashboard connect to systems other than Excel?
Yes. Power BI can connect to multiple data sources, including SQL databases, ERP systems, and cloud apps.
5. How often should pharmacy KPI dashboards be updated?
Ideally, data should refresh daily or weekly to provide accurate and timely insights.
6. Can small pharmacies also benefit from KPI dashboards?
Absolutely. Even small pharmacies can track essential KPIs to improve service quality and efficiency.
Visit our YouTube channel to learn step-by-step video tutorials