Managing a childcare center is no small task. From ensuring the safety and happiness of children to maintaining compliance, monitoring staff performance, and meeting operational goals, administrators face numerous challenges every day. To succeed, they need reliable insights. This is where a Childcare Center KPI Dashboard in Power BI becomes invaluable.
In this detailed article, we’ll explore what this dashboard is, its structure, benefits, opportunities for improvement, and best practices. By the end, you’ll have a clear understanding of how Power BI can transform childcare management with data-driven decision-making.
Click to Purchases Childcare Center KPI Dashboard Power BI
What Is a Childcare Center KPI Dashboard in Power BI?
A Childcare Center KPI Dashboard in Power BI is a pre-built reporting solution designed to track and analyze the most important Key Performance Indicators (KPIs) in childcare management. Instead of relying on manual spreadsheets or disconnected reports, this dashboard consolidates all data into a single, interactive platform.
The dashboard pulls data from an Excel file and converts it into visually engaging charts, tables, and cards within Power BI. With just a few clicks, administrators can monitor operational performance, measure goals, and compare progress over time.
It provides visibility into:
-
Monthly and yearly performance
-
Achievement of targets versus actual results
-
Comparison with previous year metrics
-
KPI-specific definitions and formulas
This dashboard is ideal for childcare centers of all sizes that want to improve efficiency, accountability, and outcomes.
Key Features of the Childcare Center KPI Dashboard
The dashboard consists of three main pages, each designed to provide valuable insights.
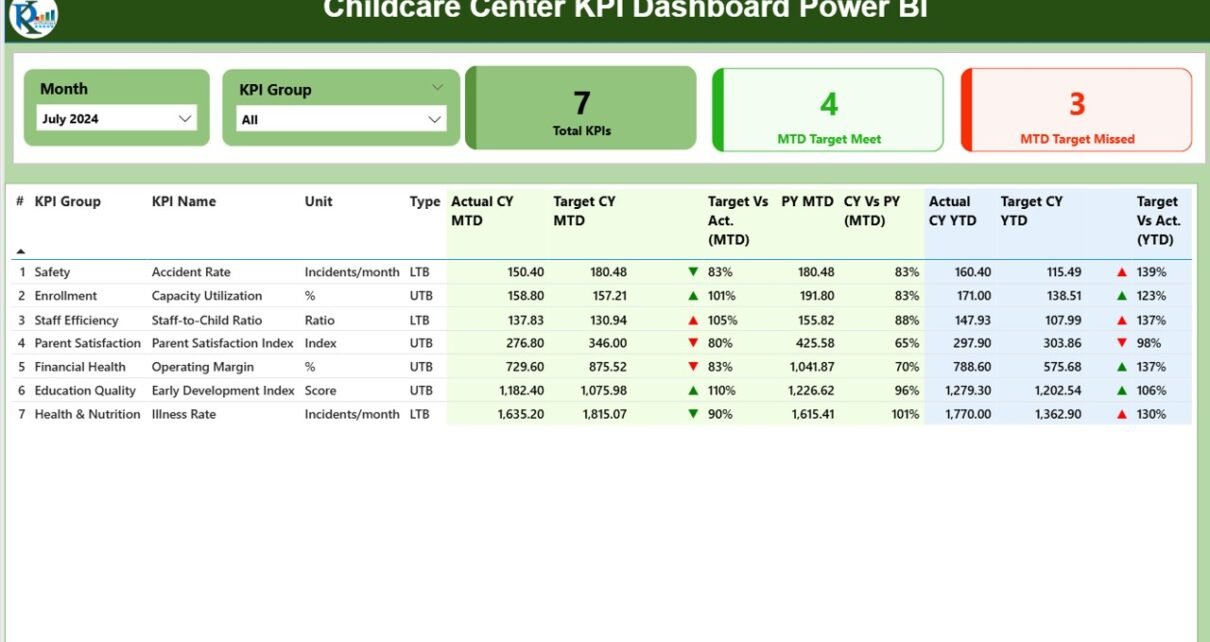
Summary Page

This is the central hub of the dashboard where most users spend their time.
-
Slicers: Filters for Month and KPI Group are placed at the top.
-
KPI Cards: Three key metrics are highlighted – Total KPIs count, MTD (Month-to-Date) Target Met count, and MTD Target Missed count.
Detailed KPI Table: Displays a full breakdown of metrics, including:
- KPI Number (sequence ID)
- KPI Group (category such as Staff, Compliance, Operations, etc.)
- KPI Name
- Unit of measurement
- Type (UTB – Upper the Better or LTB – Lower the Better)
- Actual CY MTD (Current Year Month-to-Date)
- Target CY MTD
- MTD Icons (green ▲ or red ▼ for status)
- Target vs Actual MTD (%)
- Previous Year MTD value
- CY vs PY MTD (%) comparison
- Actual CY YTD (Current Year-to-Date)
- Target CY YTD
- YTD Icons (green ▲ or red ▼ for status)
- Target vs Actual YTD (%)
- Previous Year YTD
- CY vs PY YTD (%)
This page offers a complete snapshot of performance, making it easy to track progress and spot problem areas.
Click to Purchases Childcare Center KPI Dashboard Power BI
KPI Trend Page

The KPI Trend page provides visual comparisons of performance over time.
-
Combo Charts: Two charts display Actuals, Targets, and Previous Year numbers for both MTD and YTD.
-
Slicer for KPI Selection: Users can select a specific KPI from the left panel to view trends.
This helps in spotting patterns, understanding performance consistency, and identifying areas that need corrective action.
KPI Definition Page

The KPI Definition page is a hidden drill-through page that provides context for each metric.
From the Summary Page, users can right-click and drill through to view details like:
-
KPI Number
-
KPI Group
-
KPI Name
-
Unit
-
Formula
-
Definition
-
Type (UTB or LTB)
A back button on the top-left corner makes navigation simple.
This ensures all users understand what each KPI represents and how it is calculated.
Data Source: Excel Integration
The dashboard relies on Excel as the backend data source, with three key worksheets:
Input_Actual Sheet:
- Enter KPI Name, Month (first day of the month), MTD value, and YTD value.
Input_Target Sheet:
- Enter KPI Name, Month, Target MTD, and Target YTD values.
KPI Definition Sheet:
- Define KPI Number, Group, Name, Unit, Formula, Definition, and Type (LTB or UTB).
By keeping data entry in Excel, the system remains user-friendly and flexible, while Power BI transforms it into actionable insights.
Why Use a KPI Dashboard for Childcare Centers?
Childcare centers face unique challenges that make data tracking essential. A KPI dashboard:
-
Provides real-time visibility into performance.
-
Improves decision-making with facts instead of guesswork.
-
Enhances accountability by showing staff and department results.
-
Identifies trends early to prevent issues.
-
Saves time by automating reporting.
Advantages of Childcare Center KPI Dashboard in Power BI
✅ Centralized Data – All KPIs and performance metrics are stored in one place.
✅ Interactive Reporting – Filters, slicers, and drill-through options allow deeper analysis.
✅ Visual Insights – Charts and icons make it easy to interpret data.
✅ Target Monitoring – Track performance against monthly and yearly goals.
✅ Year-on-Year Comparisons – Measure improvements or declines over time.
✅ Customizable – Adjust KPIs, formulas, and targets based on specific center needs.
✅ Time-Saving – Reduces manual reporting efforts.
✅ Improved Communication – Share dashboards with staff and stakeholders.
Opportunities for Improvement
Although powerful, this dashboard can be further enhanced:
🔹 Automated Data Refresh: Currently dependent on Excel input; connecting to a database or cloud system can improve accuracy.
🔹 Mobile Accessibility: Optimizing for mobile devices can help managers monitor KPIs on the go.
🔹 Benchmarking: Adding industry benchmarks for childcare standards would provide context.
🔹 Predictive Analytics: AI-driven forecasts could help anticipate future performance.
🔹 Role-Based Access: Different views for staff, managers, and administrators can increase usability.
Best Practices for Using Childcare KPI Dashboards
To get maximum value from this dashboard:
-
Define Clear KPIs: Ensure KPIs align with childcare center goals.
-
Update Data Regularly: Keep Excel sheets current for accurate insights.
-
Use Filters Effectively: Apply slicers to focus on specific groups or periods.
-
Engage Staff: Share results with staff to promote accountability.
-
Review Trends Monthly: Use KPI Trend charts to spot early warning signals.
-
Document KPI Definitions: Ensure all stakeholders understand the meaning of each KPI.
-
Leverage Drill-Throughs: Use the KPI Definition page to reduce confusion about metrics.
-
Combine with Action Plans: Use insights to create strategies for improvement.
Conclusion
The Childcare Center KPI Dashboard in Power BI is a game-changer for administrators and managers who want to improve efficiency and performance. By consolidating data into a single, interactive platform, it ensures that decision-making is faster, smarter, and backed by facts.
From staff efficiency to compliance and child well-being, KPIs provide a roadmap for growth. With the right practices, childcare centers can not only meet targets but also deliver higher-quality services to children and parents.
Frequently Asked Questions (FAQs)
1. What is a Childcare Center KPI Dashboard in Power BI?
It is a reporting tool built in Power BI that tracks performance indicators for childcare centers, such as staff efficiency, compliance, and service quality.
2. Why should childcare centers use a KPI dashboard?
It helps managers monitor progress, compare results with targets, improve decision-making, and increase accountability.
3. What data sources does this dashboard use?
The dashboard uses an Excel file with three sheets: Input_Actual, Input_Target, and KPI Definition.
4. Can this dashboard be customized?
Yes. You can add new KPIs, adjust targets, or connect it to other data sources as needed.
5. Does it support Year-on-Year comparisons?
Yes. The dashboard provides MTD and YTD comparisons with previous year values.
6. Can I use this dashboard without advanced technical skills?
Absolutely. The backend is Excel-based, so users only need to enter numbers. Power BI handles the rest.
7. How does the dashboard show KPI status?
It uses icons (▲ for green, ▼ for red) to indicate if KPIs are meeting or missing targets.
8. Can I share the dashboard with others?
Yes. Power BI allows dashboards to be shared across teams and stakeholders for collaboration.
9. How often should I update the data?
At least monthly, but weekly or daily updates provide more accurate insights.
10. Is it possible to view KPI trends over time?
Yes. The KPI Trend page shows monthly and yearly patterns for Actuals, Targets, and Previous Year metrics.
Visit our YouTube channel to learn step-by-step video tutorials
Click to Purchases Childcare Center KPI Dashboard Power BI