Managing employees effectively is one of the most important responsibilities of any organization. As businesses grow, HR teams face challenges like tracking performance, analyzing training, monitoring attendance, and understanding employee engagement. Doing all this manually is time-consuming, error-prone, and inefficient.
This is where an HR Dashboard in Excel becomes an essential tool. With a well-designed Excel dashboard, HR professionals can quickly view workforce data, identify trends, and make data-driven decisions. In this article, we will explore everything you need to know about HR dashboards in Excel—its features, benefits, structure, best practices, and more.
Click to Purchases HR Dashboard in Excel
What Is an HR Dashboard in Excel?
An HR Dashboard in Excel is a ready-to-use template that consolidates multiple HR metrics into a single interactive interface. It provides a clear view of employee performance, training, engagement, and attendance across the organization.
Instead of manually checking separate reports, HR professionals can rely on a single dashboard to:
-
Track KPIs (Key Performance Indicators) in real time.
-
Visualize workforce data with charts and graphs.
-
Compare performance across departments, locations, or job roles.
-
Identify problem areas quickly and act faster.
Excel is an excellent tool for creating HR dashboards because it is widely available, easy to use, and flexible. You can customize it based on your company’s unique needs without investing in expensive software.
Key Features of the HR Dashboard in Excel
The HR Dashboard template comes with several built-in features designed for ease of use and comprehensive analysis. Below are the main highlights:
Page Navigator
-
Located on the left side of the dashboard.
-
Allows easy navigation across different analytical pages.
-
Saves time by enabling HR managers to switch between views without scrolling through large datasets.
Multiple Analytical Pages
This dashboard includes five pages, each focusing on a different aspect of HR analysis.
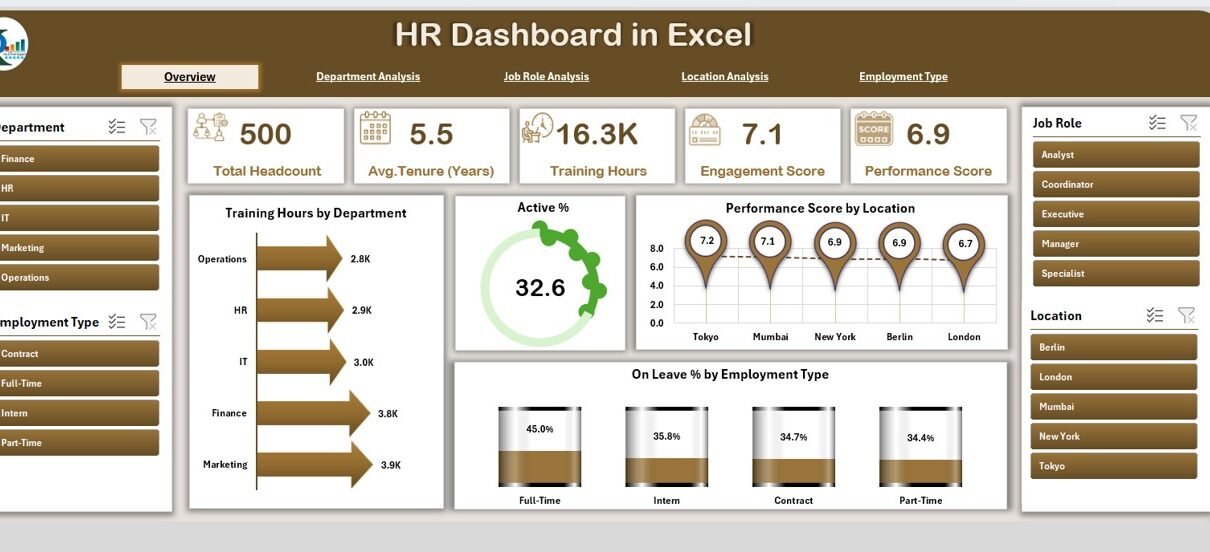
Overview Page
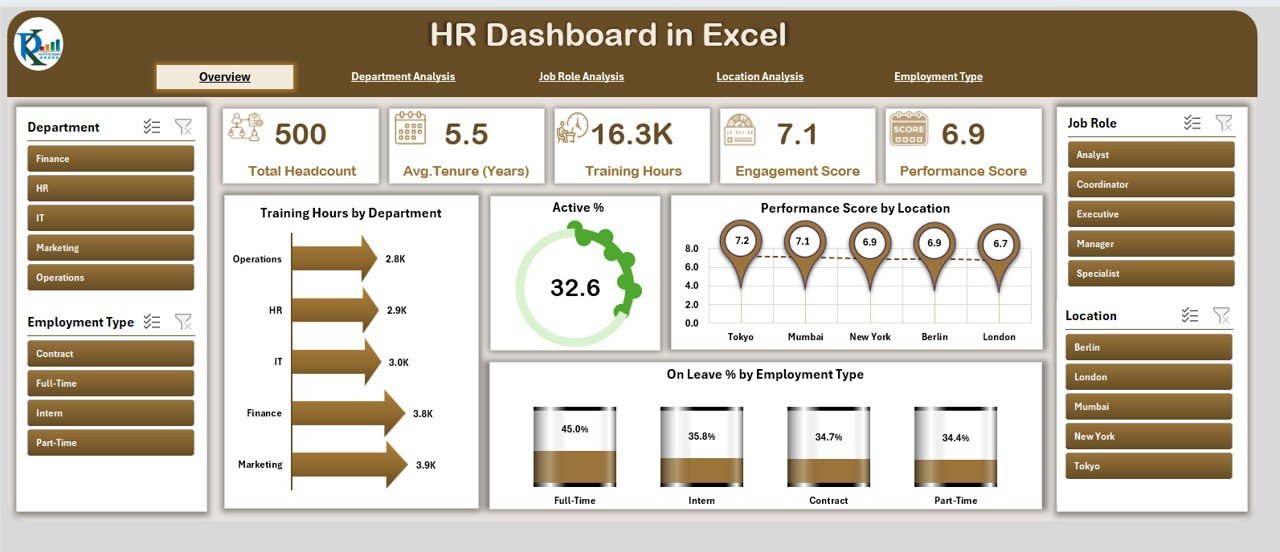
-
The main landing page.
-
Includes five cards for quick insights.
Displays four key charts:
- Training Hours by Department
- Active % of Employees
- Performance Score by Location
- On Leave % by Employee Type
Click to Purchases HR Dashboard in Excel
Department Analysis
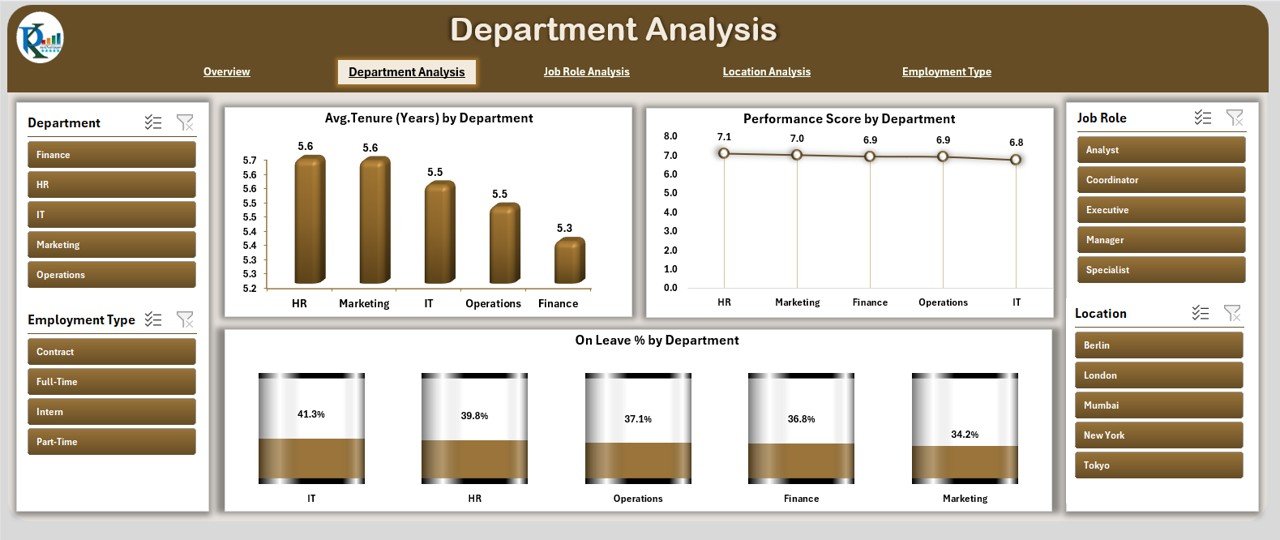
-
Focuses on workforce trends by department.
Includes charts like:
- Average Tenure (Years) by Department
- Performance Score by Department
- On Leave % by Department
Job Role Analysis
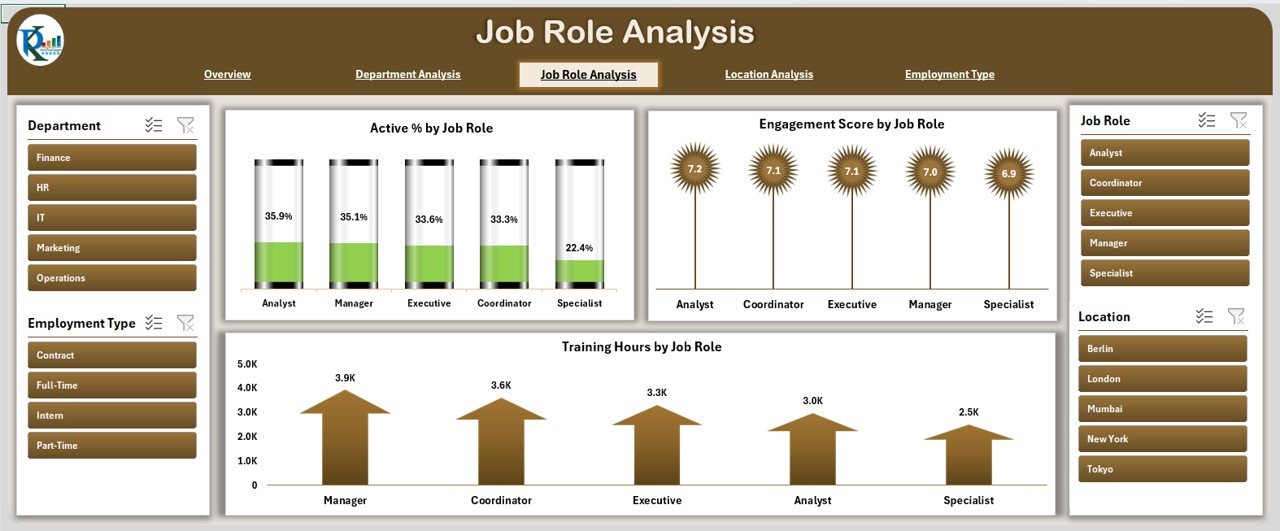
-
Provides clarity on job role performance and training.
Charts include:
- Active % by Job Role
- Engagement Score by Job Role
- Training Hours by Job Role
Location Analysis
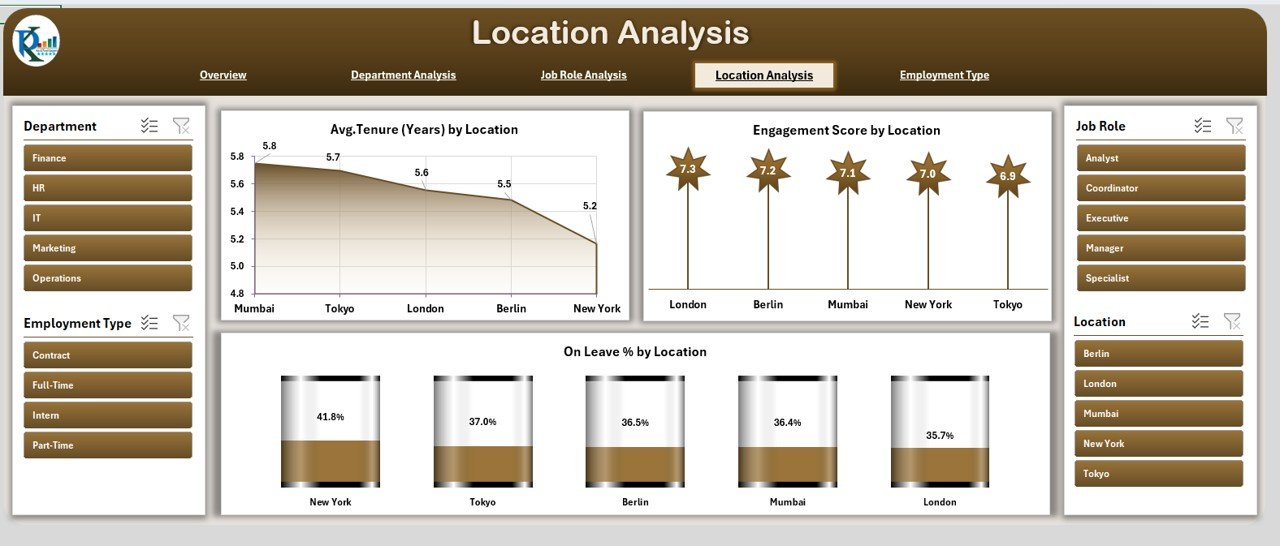
-
Helps compare performance across offices or branches.
Charts include:
- Average Tenure by Location
- Engagement Score by Location
- On Leave % by Location
Employment Type Analysis
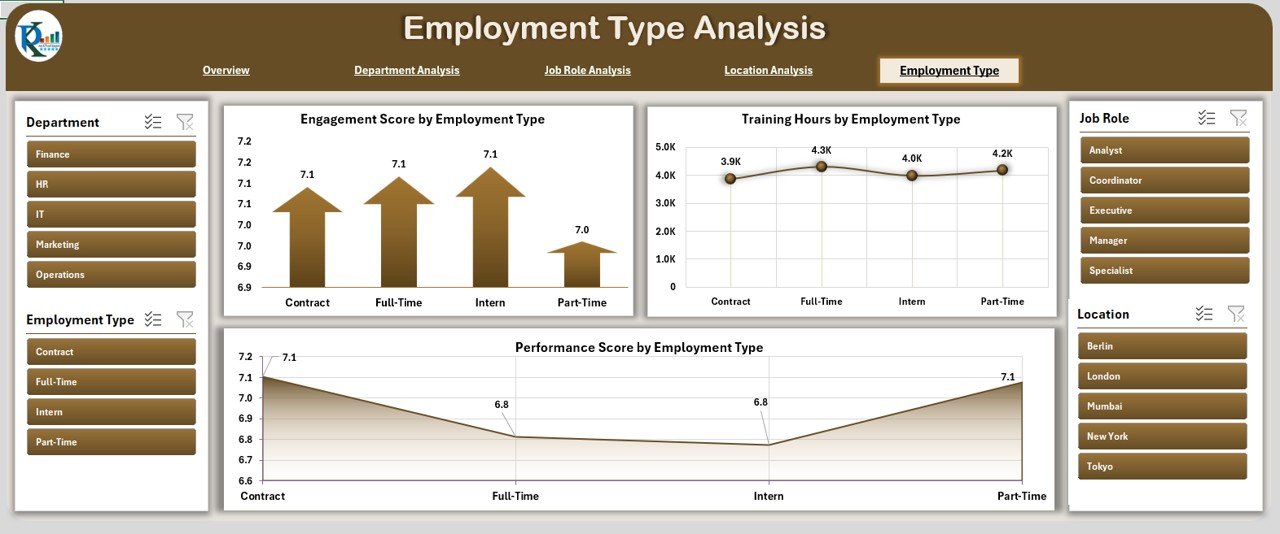
-
Analyzes workforce metrics by employment type.
Charts include:
- Engagement Score by Employee Type
- Training Hours by Employment Type
- Performance Score by Employee Type
Support Sheet
-
Stores backend data.
-
Keeps the dashboard dynamic and user-friendly.
-
Ensures data updates reflect automatically in charts.
Why Should Organizations Use an HR Dashboard in Excel?
An HR Dashboard in Excel offers both simplicity and power. Here’s why it is valuable:
-
Cost-Effective: No expensive software needed—Excel is already available in most organizations.
-
Customizable: You can adapt charts, KPIs, and metrics to match your unique HR strategy.
-
Real-Time Analysis: Data gets updated instantly when new information is added.
-
Better Decision-Making: Managers can act on insights instead of relying on assumptions.
-
User-Friendly: Anyone familiar with Excel can navigate and manage the dashboard.
Advantages of an HR Dashboard in Excel
Let’s explore the major benefits in detail:
📊 Centralized Workforce Insights: All HR data is available in one place.
⚡ Faster Analysis: Charts and visuals save time compared to manual reports.
📈 Performance Monitoring: HR teams can easily compare KPIs across departments and job roles.
🔍 Identifying Problem Areas: Spot trends in absenteeism, low engagement, or high turnover quickly.
🛠 Custom Reporting: Filter data by time period, location, or employee type.
💰 Budget-Friendly Solution: Avoids costly HR software and works with existing systems.
🔄 Flexibility: Easy to expand as the organization grows.
How to Create and Use an HR Dashboard in Excel
Click to Purchases HR Dashboard in Excel
Creating an HR dashboard in Excel involves a structured process. Here are the main steps:
-
Define Your KPIs
Decide which metrics matter most, such as turnover rate, engagement score, or training hours. -
Collect Data
Import employee records, training schedules, leave data, and performance reviews. -
Organize the Data
Use clean tables in a support sheet to keep information structured. -
Build Visuals
Insert charts (bar, line, pie, etc.) to represent the metrics clearly. -
Design the Dashboard Layout
Arrange visuals logically, ensuring easy navigation through page navigator buttons. -
Test and Refine
Review with HR managers, collect feedback, and make improvements.
Best Practices for the HR Dashboard in Excel
To maximize the effectiveness of your HR Dashboard, follow these best practices:
✅ Keep it Simple: Avoid clutter—focus on the most important metrics.
✅ Use Consistent Colors: Make charts easy to read by using uniform color coding.
✅ Update Data Regularly: Ensure accuracy by refreshing data frequently.
✅ Provide Interactivity: Add slicers and dropdowns for filtering data.
✅ Align with Business Goals: Track KPIs that support overall organizational objectives.
✅ Train HR Staff: Make sure the HR team knows how to use and interpret the dashboard.
✅ Secure Sensitive Data: Protect employee information with password-protected sheets.
Opportunities for Improvement in an HR Dashboard
While an Excel-based HR Dashboard is powerful, there is always room to grow:
🔄 Integration with HRMS/Payroll Software: Automate data import.
🌐 Cloud Access: Host on platforms like OneDrive or SharePoint for real-time collaboration.
📱 Mobile-Friendly Versions: Adapt dashboards for mobile access.
🤖 AI-Powered Insights: Use predictive analytics to forecast turnover or training needs.
🧑🤝🧑 Employee Self-Service: Create simplified views for managers or employees.
Conclusion
An HR Dashboard in Excel is a practical and affordable tool for any organization that wants to improve workforce management. By combining multiple data points—such as performance, training, and engagement—into one dashboard, HR professionals can make better decisions, boost employee satisfaction, and align HR activities with business goals.
Whether you are a small company or a large enterprise, an HR dashboard in Excel can be customized to fit your needs. With clear visuals, structured data, and best practices in place, this tool can transform how HR operates within your business.
Frequently Asked Questions (FAQs)
1. What is an HR Dashboard in Excel?
An HR Dashboard in Excel is a template that displays HR metrics such as performance, training, and employee engagement in one interactive interface.
2. Who can use an HR Dashboard?
HR managers, department heads, and business leaders can use it to monitor workforce trends and make data-driven decisions.
3. Can I customize the HR Dashboard in Excel?
Yes, you can add or remove KPIs, change chart types, or adjust layouts based on your organizational needs.
4. How often should I update the HR Dashboard?
Ideally, update it weekly or monthly depending on how frequently you collect HR data.
5. Is an Excel-based HR Dashboard better than HR software?
For small to medium businesses, Excel dashboards are cost-effective and sufficient. Large enterprises may benefit from integrated HRMS systems, but Excel remains a great starting point.
6. Can I share the HR Dashboard with my team?
Yes, you can share it through OneDrive, SharePoint, or email. Just ensure sensitive employee data is secured.
Visit our YouTube channel to learn step-by-step video tutorials