Artificial Intelligence (AI) has transformed the way businesses operate, analyze data, and make decisions. However, managing the performance of AI initiatives requires a systematic approach. Companies cannot rely only on fragmented reports or manual tracking because these methods are slow, prone to error, and fail to provide real-time insights. This is where the Artificial Intelligence KPI Dashboard in Excel becomes a game-changer.
This dashboard provides a single, consolidated view of all critical AI-related performance indicators. Whether you want to track model accuracy, deployment success, data processing speed, or ROI from AI initiatives, the dashboard makes everything simple and visual. With built-in charts, slicers, and conditional formatting, even complex AI metrics become easy to understand and act upon.
In this article, we will explore what the AI KPI Dashboard in Excel is, its structure, advantages, best practices, and how organizations can use it to improve decision-making.
Click to Purchase Artificial Intelligence KPI Dashboard in Excel
What Is an Artificial Intelligence KPI Dashboard in Excel?
An Artificial Intelligence KPI Dashboard in Excel is a ready-to-use tool that consolidates all performance metrics related to AI projects. It allows users to track progress, compare actual performance against targets, and monitor year-over-year growth.
Instead of juggling multiple files, teams can rely on this single dashboard to get a holistic view of AI performance. From machine learning accuracy and data quality to cost efficiency and adoption rates, the dashboard covers all the key dimensions of AI implementation.
Structure of the AI KPI Dashboard in Excel
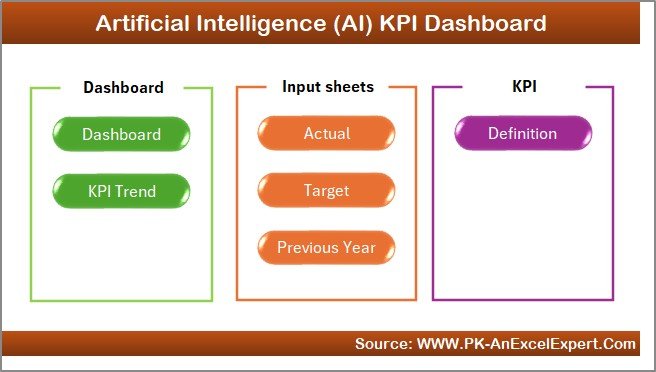
The dashboard has been designed with seven powerful worksheets. Each sheet plays a specific role in organizing, displaying, and analyzing AI-related KPIs.
1. Home Sheet
-
Works as the index page of the dashboard.
-
Provides six clickable buttons to navigate to the respective sheets.
-
Helps users quickly move between Dashboard, KPI Trend, Data Input, Targets, and other sections without scrolling endlessly.
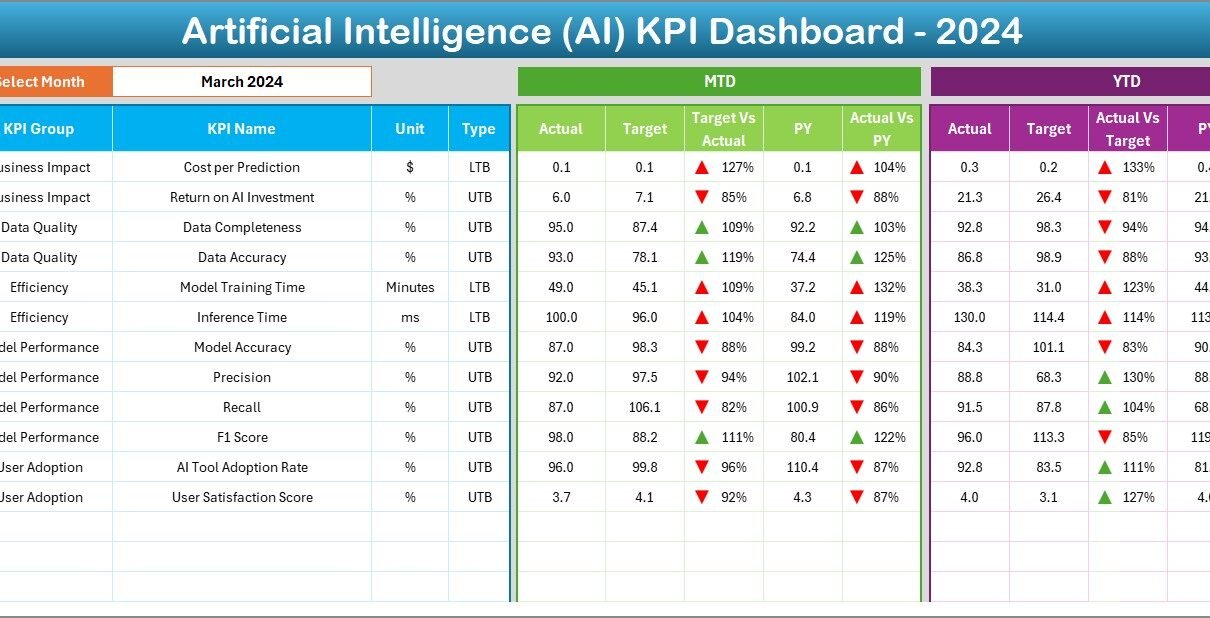
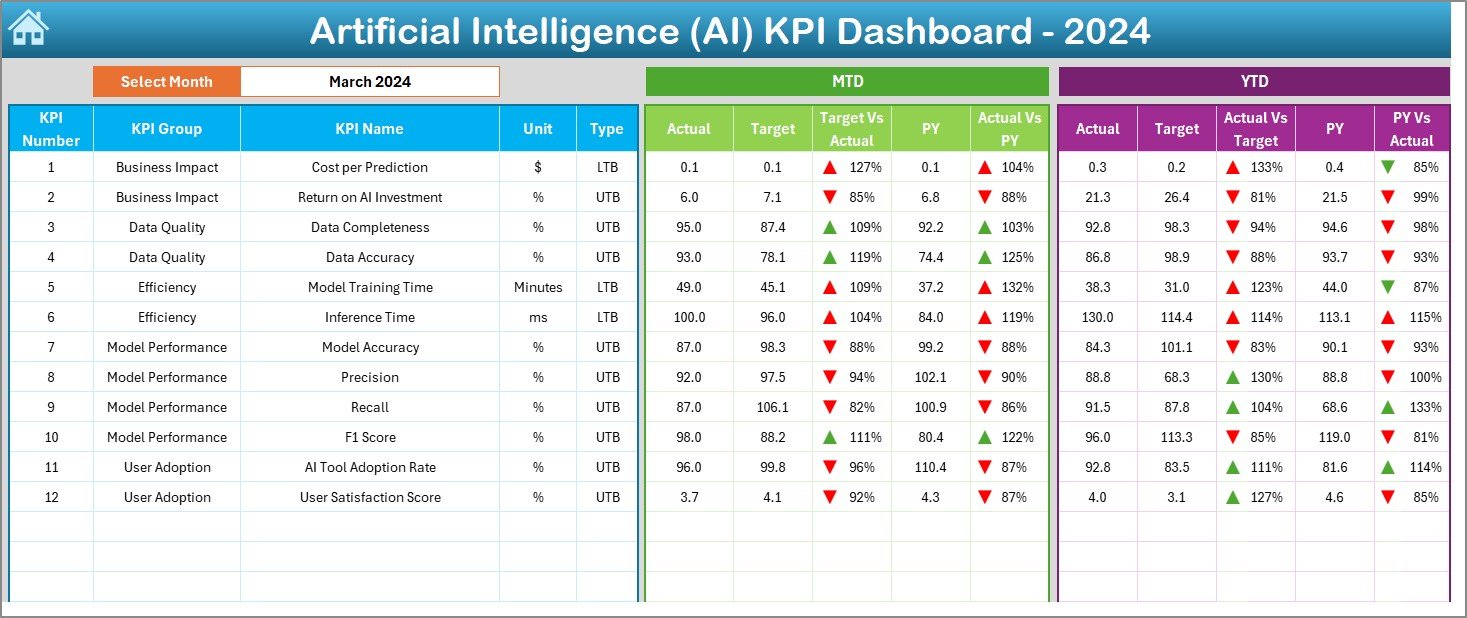
2. Dashboard Sheet Tab
-
Acts as the main performance view.
-
On cell D3, you can select the month from a drop-down. The entire dashboard updates automatically for that month.
-
Displays MTD (Month-to-Date) and YTD (Year-to-Date) numbers.
-
Compares Actual vs. Target and Actual vs. Previous Year.
-
Uses conditional formatting with arrows to show performance (up for growth, down for decline).
-
Provides both short-term and long-term insights with MTD and YTD perspectives.
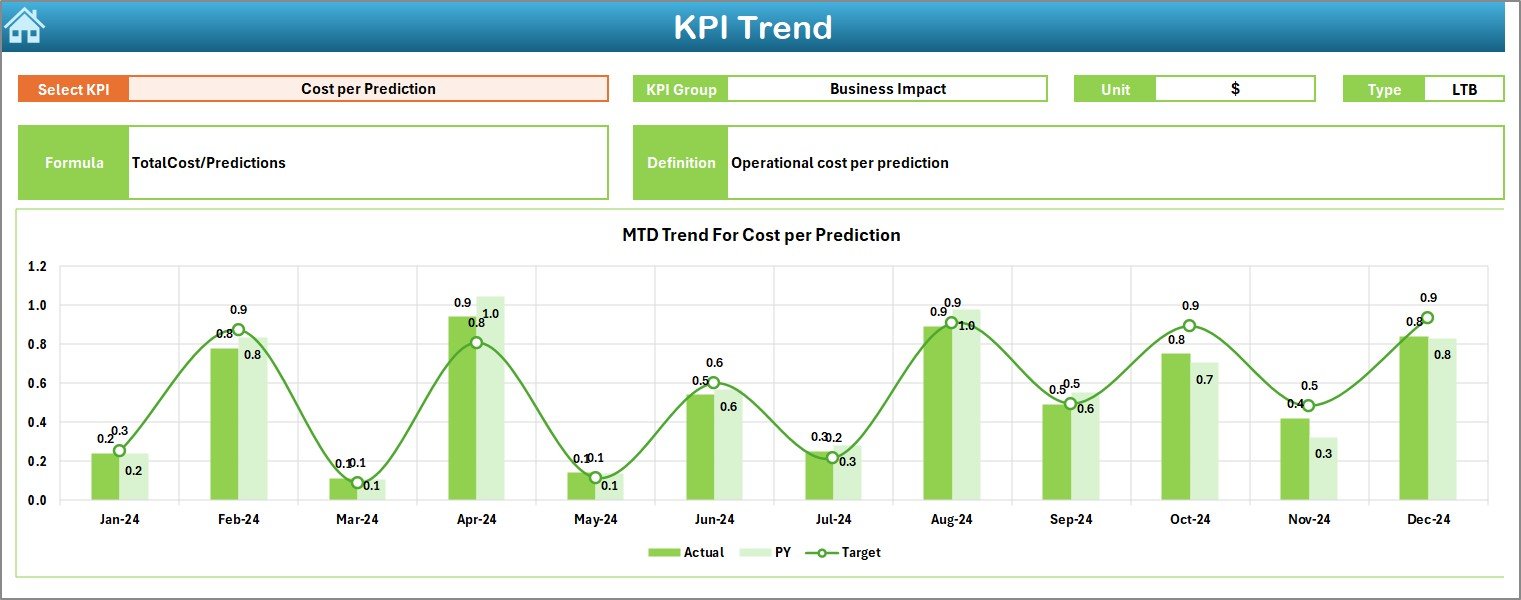
3. KPI Trend Sheet Tab
-
Offers a KPI-specific deep dive.
-
Users can select any KPI from the drop-down (cell C3).
-
Displays KPI details like Group, Unit, Type (Lower the Better or Upper the Better), Formula, and Definition.
-
Shows MTD and YTD trend charts for Actual, Target, and Previous Year values.
-
Perfect for analyzing KPI behavior across months and identifying patterns.
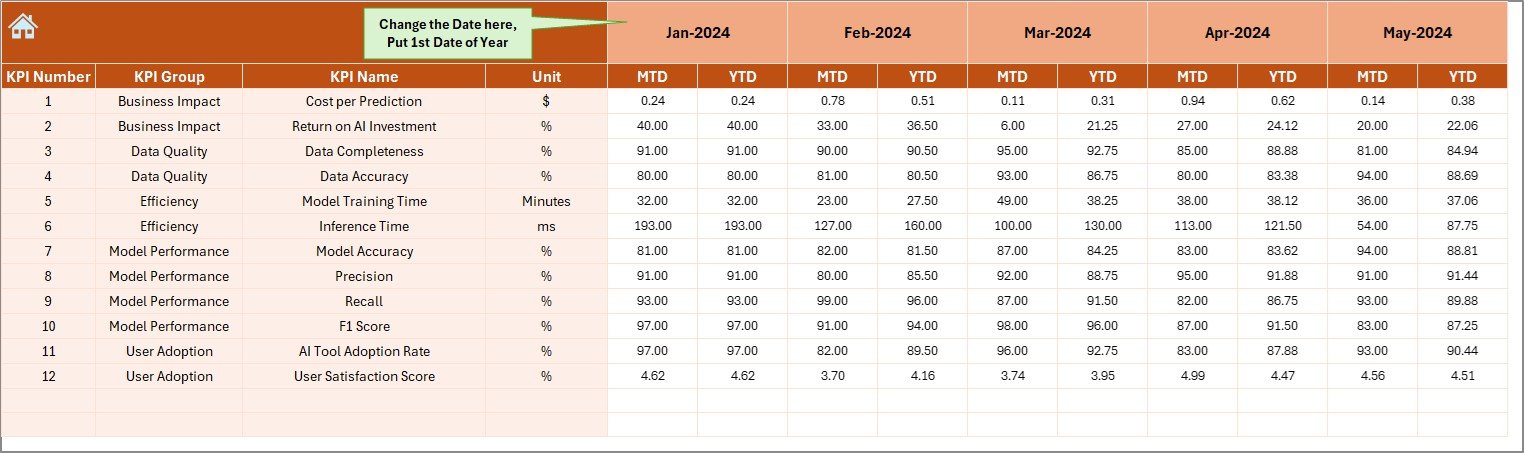
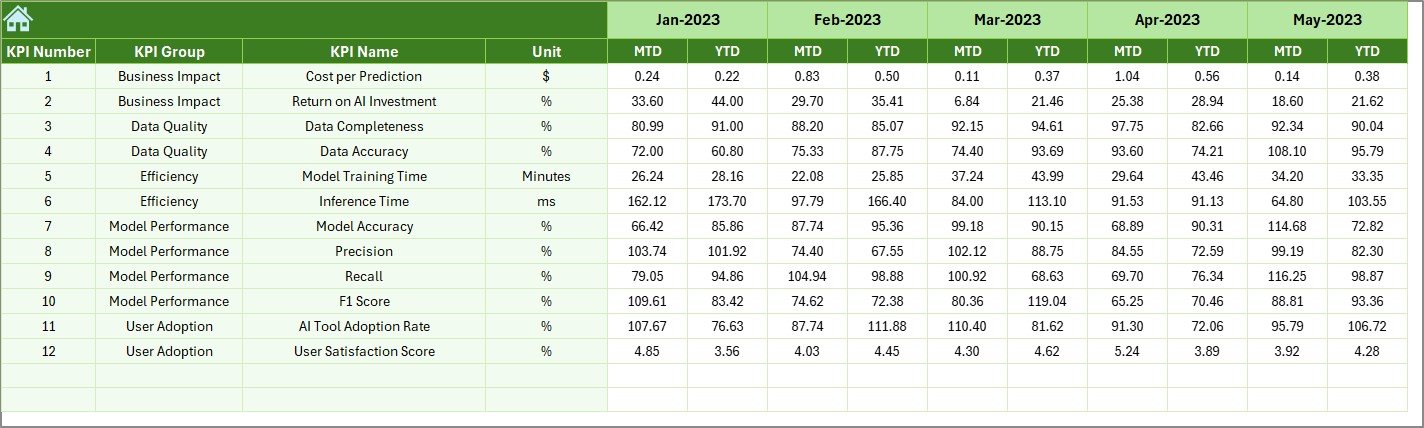
4. Actual Numbers Input Sheet
-
Designed for entering real performance data.
-
Allows you to input both MTD and YTD numbers for each month.
-
Includes a control cell (E1) where you enter the first month of the financial year. This feature automatically adjusts the calendar view.
-
Ensures consistency across the dashboard.
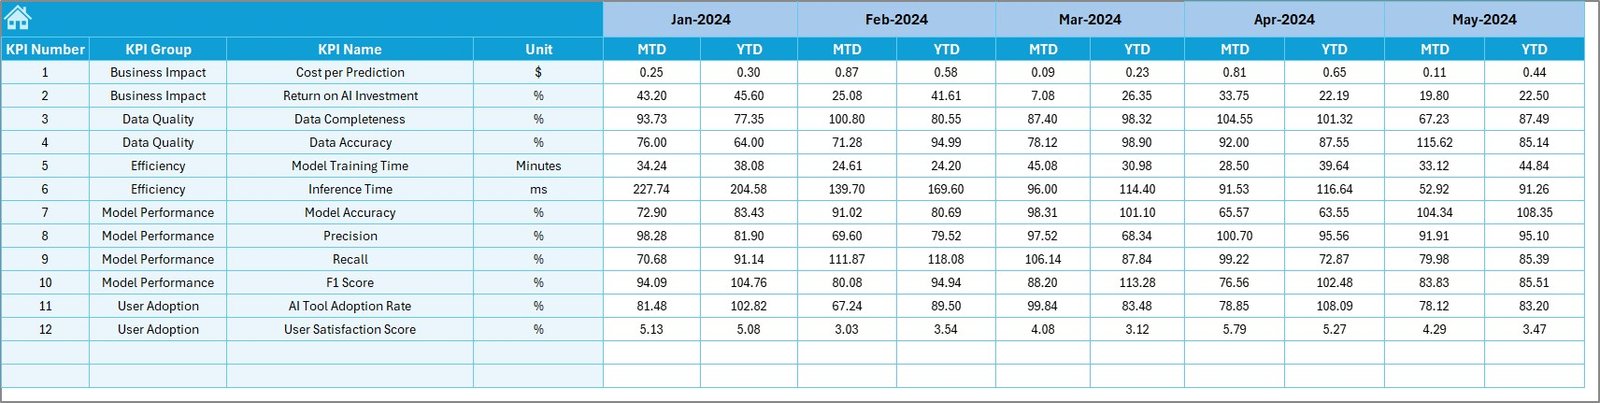
5. Target Sheet Tab
-
Stores target values for each KPI.
-
Includes MTD and YTD targets for every month.
-
Helps organizations set realistic benchmarks and track whether they are meeting their AI goals.
6. Previous Year Number Sheet Tab
-
Stores historical performance data.
-
Mirrors the structure of the current year’s Actual and Target sheets.
-
Enables comparison between this year and last year’s AI achievements.
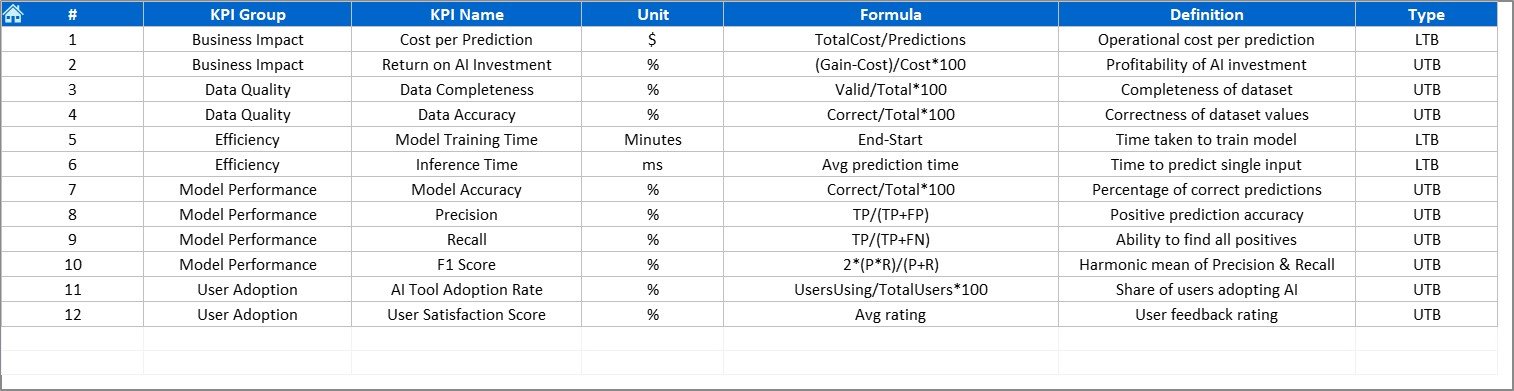
7. KPI Definition Sheet Tab
-
Contains the master list of KPIs.
-
Includes KPI Name, Group, Unit, Formula, and Definition.
-
Provides transparency so everyone understands how KPIs are measured.
Advantages of Using the AI KPI Dashboard in Excel
An AI KPI Dashboard is more than just a reporting tool. It delivers multiple advantages to organizations that want to optimize their AI projects.
✅ Centralized Insights – Brings all AI performance data into one place.
✅ Real-Time Updates – Any change in Actual, Target, or Previous Year data reflects instantly in the dashboard.
✅ Customizable – Can be adapted to different industries, from healthcare AI to financial services AI.
✅ Easy Navigation – With index buttons and structured sheets, users save time moving around.
✅ Data Transparency – KPI definitions make sure everyone understands the logic behind each metric.
✅ Performance Tracking – Tracks both MTD and YTD metrics, ensuring short-term and long-term focus.
✅ Historical Comparisons – Compares current AI initiatives with previous year data to measure growth.
Click to Purchase Artificial Intelligence KPI Dashboard in Excel
Opportunities for Improvement in AI KPI Tracking
While the dashboard is powerful, there are always opportunities to refine it:
🔹 Add Predictive Analytics – Integrating simple Excel forecasting can help predict future KPI trends.
🔹 Automate Data Input – Linking the dashboard with a database or external file can save time.
🔹 Expand KPI Library – New AI KPIs like model drift, fairness score, or interpretability can be included.
🔹 Include Role-Based Views – Custom dashboards for executives, developers, and project managers can make the tool even more effective.
🔹 Integration with Power BI – Exporting data to Power BI can create even more interactive and visual reports.
Best Practices for Using the AI KPI Dashboard
To get the most value out of this tool, follow these best practices:
-
Define KPIs Clearly – Ensure that each KPI has a clear formula and definition in the KPI Definition sheet.
-
Update Data Regularly – Keep Actual and Target values up to date to maintain accuracy.
-
Use Conditional Formatting Wisely – Avoid clutter by using only meaningful visuals such as arrows or progress bars.
-
Train Teams – Educate users on how to navigate the dashboard and interpret trends.
-
Align with Business Goals – Make sure KPIs reflect the organization’s AI objectives, not just technical performance.
-
Review Yearly – Update KPI definitions and targets annually to keep them relevant.
Conclusion
The Artificial Intelligence KPI Dashboard in Excel is an essential tool for businesses that want to monitor, evaluate, and improve their AI initiatives. With its structured design, clear visuals, and customizable features, it allows organizations to track both high-level results and detailed trends.
By using this dashboard, decision-makers can move beyond guesswork and adopt a data-driven approach. Whether you are tracking AI model performance, data quality, or cost-effectiveness, this tool ensures that you stay on top of every critical metric.
Frequently Asked Questions (FAQs)
1. What is the purpose of an AI KPI Dashboard?
The purpose of an AI KPI Dashboard is to track and analyze performance metrics related to AI projects. It helps organizations compare Actual vs. Target values and identify areas that need attention.
2. Can I customize the AI KPI Dashboard in Excel?
Yes, the dashboard is fully customizable. You can add or remove KPIs, modify the layout, or link it with other data sources.
3. How often should I update the dashboard?
You should update it monthly to keep MTD and YTD data accurate. However, some organizations update it weekly for faster insights.
4. What types of KPIs can be tracked?
You can track KPIs such as AI model accuracy, processing time, adoption rate, ROI, and data quality. The dashboard is flexible enough to handle different kinds of metrics.
5. Is Excel suitable for AI KPI tracking?
Yes. Excel is widely accessible, easy to use, and powerful enough for KPI tracking. For larger datasets, you can integrate it with databases or Power BI.
Visit our YouTube channel to learn step-by-step video tutorials
Click to Purchase Artificial Intelligence KPI Dashboard in Excel
Watch the step-by-step video tutorial: