In today’s fast-evolving world, space technology is no longer limited to research labs and government agencies. Private companies, defense organizations, and global institutions are investing heavily in satellite launches, space exploration, and orbital infrastructure. With such high stakes, tracking Key Performance Indicators (KPIs) becomes essential. That’s where the Space Tech KPI Dashboard in Power BI comes in.
This ready-to-use dashboard transforms raw data into clear, interactive insights that help organizations in the space industry monitor performance, improve decision-making, and ensure that their projects remain on track.
In this article, we will explore:
-
What a Space Tech KPI Dashboard is
-
Its structure and features
-
How the Excel data source integrates with Power BI
-
Advantages of using this dashboard
-
Opportunities for improvement
-
Best practices for getting the most value
-
Frequently asked questions
Let’s dive in.
Click to Purchases Space Tech KPI Dashboard in Power BI
What Is a Space Tech KPI Dashboard in Power BI?
A Space Tech KPI Dashboard in Power BI is a digital reporting solution designed to measure and visualize KPIs related to space technology projects. It consolidates metrics such as satellite performance, launch efficiency, mission readiness, and operational targets.
Instead of analyzing numbers in scattered spreadsheets, Power BI brings everything into a unified, dynamic dashboard. The Space Tech KPI Dashboard allows users to filter data, track monthly and yearly performance, and compare results with targets and historical benchmarks.
Key Features of the Space Tech KPI Dashboard
This dashboard includes three main pages in Power BI, each serving a unique purpose:
Summary Page
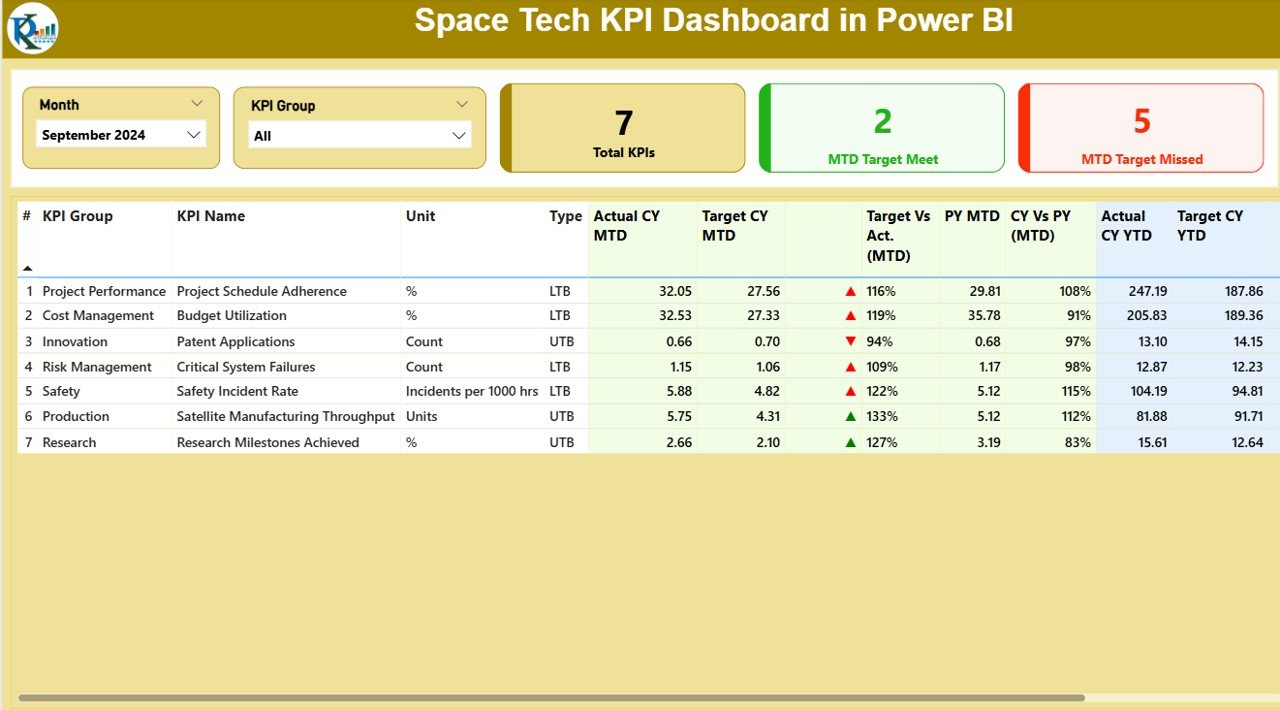
The Summary Page provides a complete overview of KPIs.
-
Slicers for Month and KPI Group: Users can instantly filter results by time or category.
Three KPI Cards:
- Total KPIs Count
- MTD (Month-to-Date) Target Met Count
- MTD Target Missed Count
Detailed Table with KPI Information:
- KPI Number: Sequential ID for reference
- KPI Group: Category of KPI (e.g., Satellite Operations, Launch, Communication)
- KPI Name: Specific metric
- Unit: Measurement unit (e.g., %, hours, count)
- Type: LTB (Lower the Better) or UTB (Upper the Better)
- Actual CY MTD: Current Year MTD values
- Target CY MTD: Benchmark target for MTD
- MTD Icon: Green ▲ or Red ▼ indicator for quick performance check
- Target vs. Actual (MTD): Percentage calculation (Actual ÷ Target)
- PY MTD: Previous Year’s MTD value
- CY vs. PY (MTD): Percentage change vs. last year
- Actual CY YTD: Year-to-Date actual values
- Target CY YTD: Year-to-Date target values
- YTD Icon: Visual indicator for YTD status
- Target vs. Actual (YTD): Actual ÷ Target formula
- PY YTD: Previous Year’s YTD numbers
- CY vs. PY (YTD): Percentage difference compared to last year
This structure makes the Summary Page a single point of truth for performance evaluation.
Click to Purchases Space Tech KPI Dashboard in Power BI
KPI Trend Page
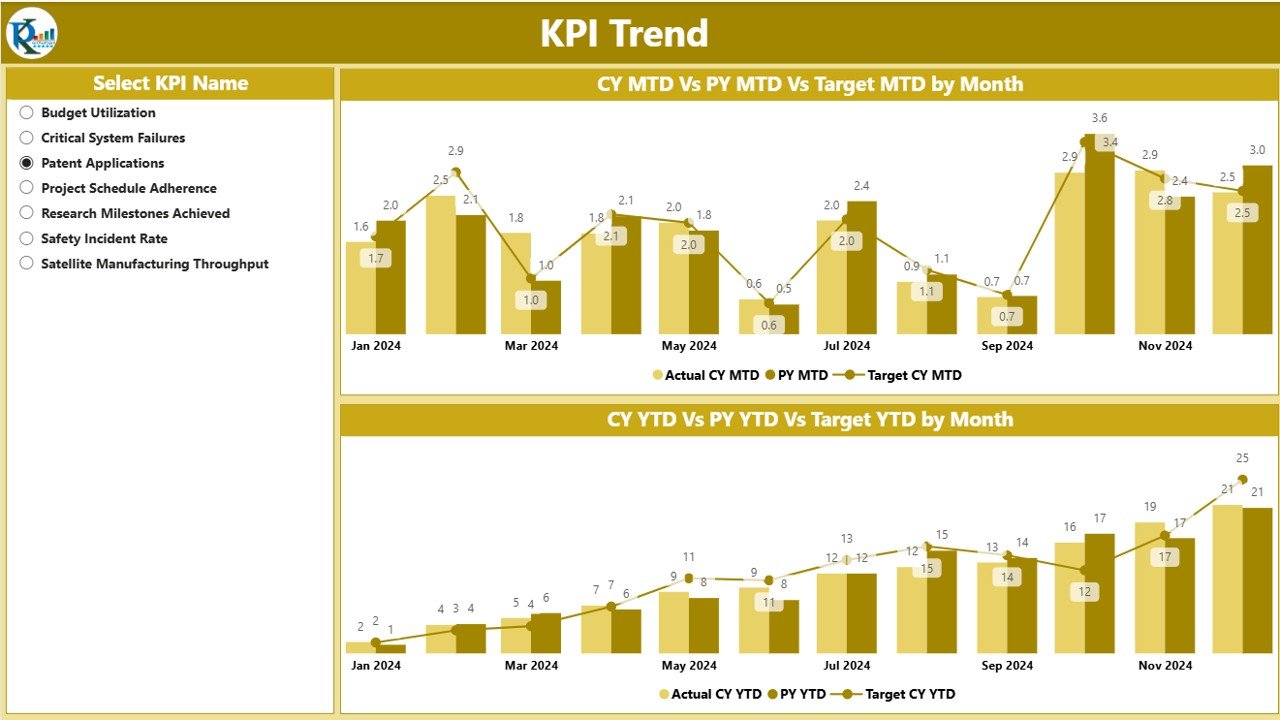
The KPI Trend Page focuses on performance trends.
-
Two Combo Charts: Show comparisons between Actual numbers, Targets, and Previous Year values for both MTD and YTD.
-
KPI Slicer: Located on the left side, allowing users to select and analyze a specific KPI.
This page helps decision-makers identify whether a KPI is improving, stagnating, or declining.
KPI Definition Page
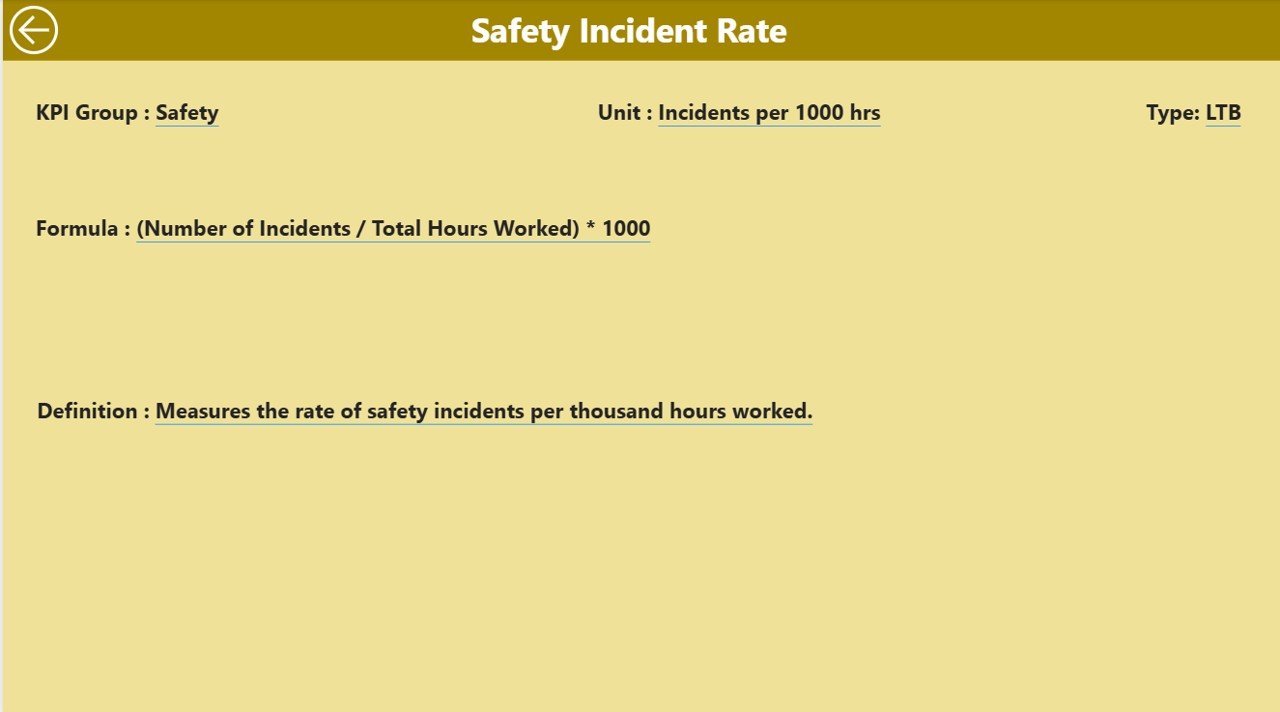
The KPI Definition Page is a drill-through view hidden by default.
From the Summary Page, users can drill into a KPI to review details such as:
-
Formula used for calculation
-
KPI definition
-
Type (LTB or UTB)
A Back Button on the top-left corner ensures smooth navigation back to the Summary Page.
How the Excel Data Source Works
The Space Tech KPI Dashboard uses Excel as its data source. The file has three key sheets:
-
Input_Actual
-
Fields: KPI Name, Month (first date of the month), MTD, YTD
-
Purpose: Records actual performance values
-
-
Input_Target
-
Fields: KPI Name, Month, MTD, YTD
-
Purpose: Stores benchmark targets
-
-
KPI Definition
-
Fields: KPI Number, KPI Group, KPI Name, Unit, Formula, Definition, Type (LTB/UTB)
-
Purpose: Provides structure and context for each KPI
-
By connecting these sheets to Power BI, users can refresh the data source anytime and instantly see updated dashboard visuals.
Why Space Technology Needs KPI Dashboards
Space projects involve massive investments and critical missions. A minor delay or error can cost millions of dollars and impact global operations. A KPI dashboard helps organizations by:
-
Monitoring launch readiness and success rates
-
Tracking satellite performance and uptime
-
Ensuring adherence to safety and compliance standards
-
Managing R&D efficiency
-
Improving collaboration across engineering, operations, and finance teams
Advantages of the Space Tech KPI Dashboard
Using a Space Tech KPI Dashboard in Power BI offers several benefits:
✅ Real-Time Insights: Updates instantly when new data is uploaded.
✅ Clear Visualization: Icons, charts, and slicers make metrics easy to interpret.
✅ Improved Decision-Making: Helps leaders spot trends and take corrective action quickly.
✅ Customizable Structure: Flexible enough to adapt for different space organizations.
✅ Historical Comparisons: Year-over-year tracking improves performance analysis.
✅ Efficiency Gains: Saves time by replacing manual report compilation.
Opportunities for Improvement
Even though the dashboard is powerful, there are ways to enhance it further:
🔹 Automated Data Integration: Connect directly with APIs from mission control systems instead of manual Excel updates.
🔹 Advanced Predictive Analytics: Add forecasting models to predict launch success or satellite degradation.
🔹 Mobile Optimization: Enable field engineers and managers to access dashboards on tablets and smartphones.
🔹 More KPI Categories: Include sustainability KPIs such as fuel consumption, carbon emissions, and reusability rates.
🔹 AI-Powered Alerts: Set up notifications when KPIs deviate significantly from targets.
Best Practices for Using the Space Tech KPI Dashboard
To maximize effectiveness, follow these best practices:
📌 Keep KPI Definitions Clear: Ensure everyone understands how each metric is calculated.
📌 Focus on Key Metrics: Avoid clutter by tracking only the most impactful KPIs.
📌 Update Data Regularly: Schedule refreshes so decision-makers always see the latest numbers.
📌 Use Conditional Formatting: Visual cues like arrows and colors speed up analysis.
📌 Encourage Drill-Throughs: Teach users to explore KPI definitions for deeper insights.
📌 Align KPIs with Strategy: Ensure KPIs link directly to organizational goals.
Conclusion
The Space Tech KPI Dashboard in Power BI is more than just a reporting tool—it is a strategic performance management system. By combining Excel-based inputs with Power BI’s dynamic visuals, organizations can track critical KPIs, compare them with historical data, and make smarter decisions.
In the competitive and high-stakes field of space technology, staying ahead means having complete visibility over performance. This dashboard ensures that managers, analysts, and engineers have the right insights at the right time.
Frequently Asked Questions (FAQs)
1. What is a KPI Dashboard in Power BI?
A KPI Dashboard in Power BI is a data visualization tool that tracks and measures key performance indicators in real time using charts, tables, and slicers.
2. Why is KPI tracking important for space technology?
Because space projects involve high investments and risks, KPI tracking ensures that performance, safety, and mission success remain on track.
3. Can I customize the Space Tech KPI Dashboard?
Yes. You can add or remove KPIs, change visualizations, and integrate it with live data sources.
4. How often should the data be updated?
Ideally, the data should be refreshed monthly or in real time if connected to automated systems.
5. What skills are needed to use this dashboard?
Basic knowledge of Excel and Power BI is enough. No advanced coding skills are required.
6. Can this dashboard work for other industries?
Yes. Although designed for space tech, the structure can be adapted for manufacturing, telecom, defense, or healthcare industries.
Visit our YouTube channel to learn step-by-step video tutorials
Click to Purchases Space Tech KPI Dashboard in Power BI