Innovation and transformation drive modern business success. Innovation & Transformation KPI Dashboard in ExcelCompanies that monitor progress with the right metrics grow faster, adapt to change, and stay competitive. However, tracking these efforts can feel overwhelming without the right tools. That is where the Innovation & Transformation KPI Dashboard in Excel comes in.
This ready-to-use Excel dashboard helps leaders measure performance, evaluate progress, and adjust strategies effectively. It combines structured data entry, automated calculations, and interactive visuals into one easy-to-navigate file. In this article, we will explore the features, benefits, best practices, and real-world applications of this powerful dashboard.
What Is an Innovation & Transformation KPI Dashboard?
An Innovation & Transformation KPI Dashboard is a performance management tool designed to track and analyze key performance indicators (KPIs) related to business growth, digital transformation, and organizational change.
Instead of scattered reports and manual tracking, this Excel-based dashboard centralizes information. With dynamic visuals, drop-down controls, and predefined formulas, managers can focus more on decision-making and less on data handling.
Click to Purchases Innovation & Transformation KPI Dashboard in Excel
Key Features of the Dashboard
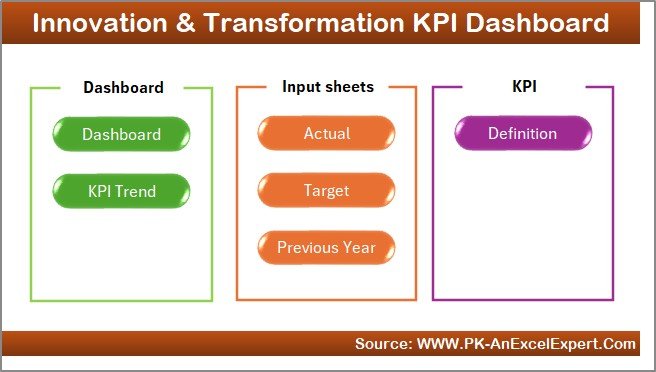
The dashboard has 7 worksheets, each with a specific role in ensuring smooth data flow and reporting. Let’s explore them one by one.
1. Home Sheet
-
Serves as the index page.
-
Includes 6 clickable buttons to jump to different sheets instantly.
-
Helps users save time and reduces navigation effort.
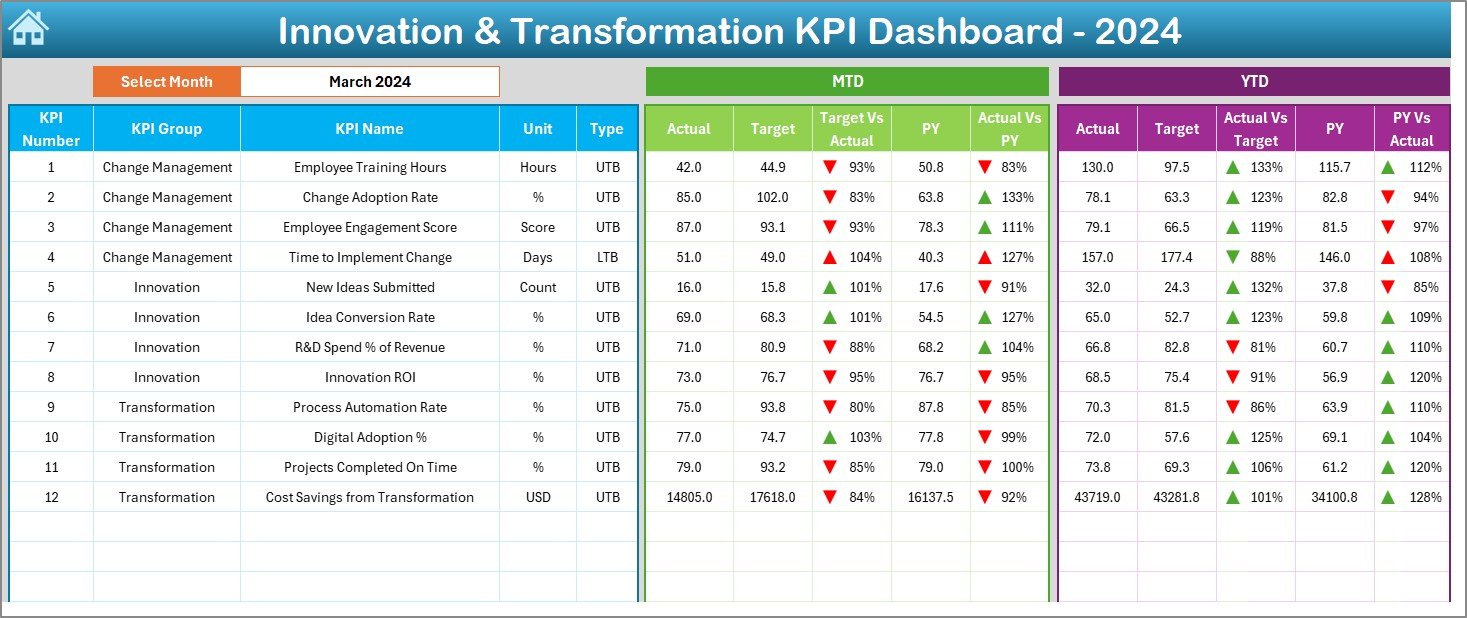
2. Dashboard Sheet Tab
-
The main visualization page where KPIs are displayed.
-
Drop-down on cell D3 lets users pick a month, and the dashboard updates automatically.
-
Displays both MTD (Month-to-Date) and YTD (Year-to-Date) data.
-
Compares Actual vs Target and Previous Year vs Actual values.
-
Uses conditional formatting with up/down arrows to highlight performance trends.
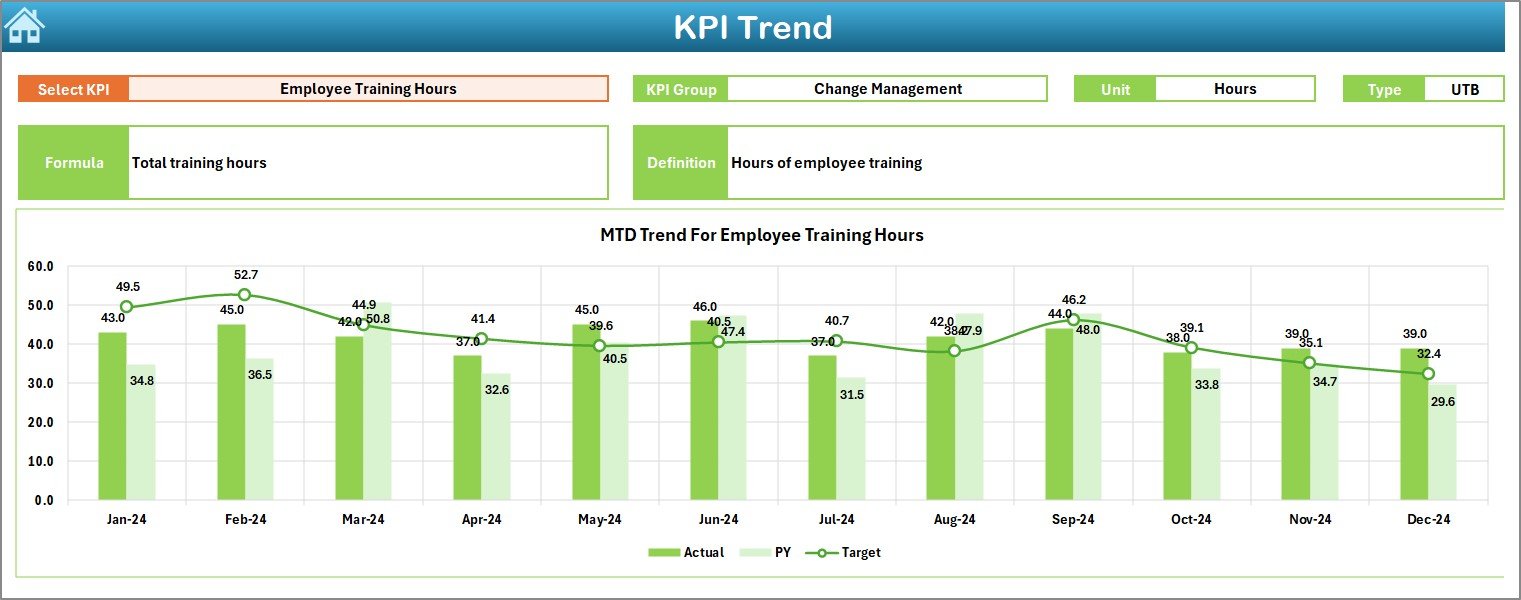
3. KPI Trend Sheet Tab
-
Allows users to select a KPI from a drop-down menu (C3).
-
Displays KPI details such as Group, Unit, Type, Formula, and Definition.
-
Includes MTD and YTD trend charts for Actual, Target, and Previous Year.
-
Provides deeper insights into progress over time.
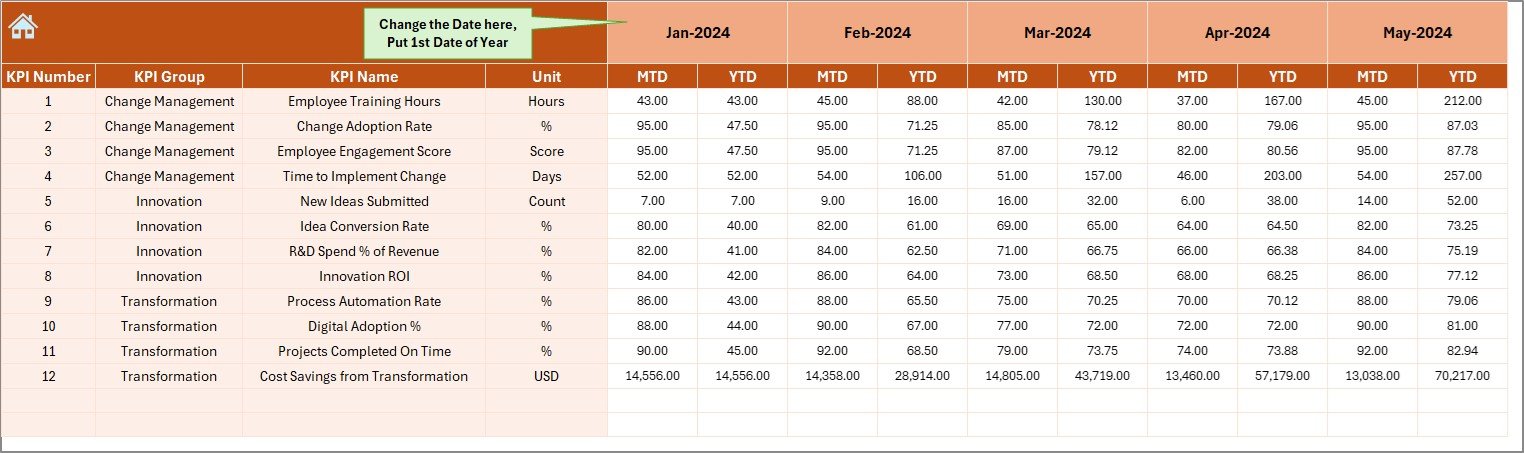
4. Actual Numbers Input Sheet
-
The entry point for actual monthly data.
-
Users input YTD and MTD values for each KPI.
-
Cell E1 allows changing the starting month of the year.
-
Ensures flexibility for organizations with different fiscal calendars.
5. Target Sheet Tab

-
Stores monthly targets for all KPIs.
-
Captures both MTD and YTD targets.
-
Serves as the baseline for comparison against actual performance.
6. Previous Year Numbers Sheet Tab

-
Keeps records of last year’s KPI data.
-
Structured in the same format as current year inputs.
-
Helps in year-over-year performance comparison.
7. KPI Definition Sheet Tab

-
Contains a central library of KPIs with details such as:
-
KPI Name
-
KPI Group
-
Unit
-
Formula
-
Definition
-
-
Ensures clarity and consistency across teams.
Why Do Businesses Need This Dashboard?
Innovation and transformation require clear direction. Without measurable KPIs, efforts become vague and hard to evaluate. This dashboard ensures that:
Click to Purchases Innovation & Transformation KPI Dashboard in Excel
-
Teams stay aligned with strategic goals.
-
Progress is tracked in real-time.
-
Leaders can quickly identify gaps and make adjustments.
-
Decisions are data-driven instead of guesswork.
Advantages of the Innovation & Transformation KPI Dashboard
Using this Excel-based dashboard offers several benefits:
✅ Centralized Information – All KPIs in one structured file.
✅ Time-Saving – Automated formulas and charts reduce manual effort.
✅ Data Accuracy – Standardized inputs minimize errors.
✅ Flexibility – Works for different industries and business models.
✅ Year-over-Year Insights – Compare past and present to measure real growth.
✅ User-Friendly – Simple drop-downs, buttons, and charts make it easy for anyone to use.
How to Use the Dashboard Effectively
To get the most out of this tool, follow these steps:
-
Define KPIs Clearly – Use the KPI Definition sheet to outline names, formulas, and units.
-
Enter Data Consistently – Update Actual, Target, and Previous Year sheets regularly.
-
Review Monthly Trends – Use the Dashboard and KPI Trend tabs for quick insights.
-
Highlight Gaps – Watch for negative indicators (red arrows) to identify problem areas.
-
Take Action – Use insights to make quick, informed business decisions.
Best Practices for the Innovation & Transformation KPI Dashboard
Here are some tips to maximize the impact of this tool:
🔹 Set Realistic Targets – Avoid overly ambitious or too easy benchmarks.
🔹 Update Data Regularly – Weekly or monthly updates keep insights fresh.
🔹 Engage Teams – Share dashboard results with departments for better accountability.
🔹 Focus on Key Metrics – Avoid overloading with too many KPIs. Stick to essentials.
🔹 Use Visuals for Clarity – Leverage trend charts and arrows for instant interpretation.
🔹 Review Annually – Compare year-on-year data for long-term insights.
Opportunities for Improvement
Although the dashboard is powerful, users can enhance it further by:
-
Adding automation with VBA for faster data entry.
-
Creating department-specific dashboards linked to the main file.
-
Integrating with Power BI or Google Sheets for cloud-based sharing.
-
Using dynamic ranges for larger datasets.
Real-World Applications
This dashboard fits multiple scenarios, such as:
-
Corporate Strategy Teams – Tracking digital transformation projects.
-
Innovation Hubs – Measuring outcomes of new product launches.
-
HR Departments – Monitoring cultural and organizational transformation.
-
Finance Teams – Ensuring transformation projects align with budget goals.
-
Project Managers – Tracking innovation initiatives across regions.
Conclusion
The Innovation & Transformation KPI Dashboard in Excel is more than just a spreadsheet. It is a strategic decision-making tool that empowers organizations to measure, evaluate, and improve their transformation journey.
By combining actuals, targets, trends, and year-over-year comparisons, it simplifies complex performance tracking. With regular updates and best practices, it becomes a reliable partner in driving business innovation.
Click to Purchases Innovation & Transformation KPI Dashboard in Excel
Frequently Asked Questions (FAQs)
1. What KPIs should I track in an Innovation & Transformation Dashboard?
You should track metrics such as project success rate, time-to-market, employee adoption rate, digital revenue contribution, cost savings, and customer satisfaction.
2. Can small businesses use this dashboard?
Yes. The template is flexible and can be scaled for small, medium, or large businesses.
3. How often should I update the data?
You should update the dashboard monthly at a minimum. For fast-moving industries, weekly updates may work better.
4. Do I need advanced Excel skills to use this dashboard?
No. The dashboard uses simple drop-downs, buttons, and charts. Basic Excel knowledge is enough.
5. Can I customize the KPIs?
Absolutely. You can add or remove KPIs in the KPI Definition sheet and adjust formulas accordingly.
6. How does this dashboard help in transformation?
It provides real-time insights into progress, highlights gaps, and ensures teams align with strategic objectives.
7. Can this dashboard integrate with other tools?
Yes. With some adjustments, it can link with Power BI, Google Sheets, or even automation tools.
Visit our YouTube channel to learn step-by-step video tutorials
Click to Purchases Innovation & Transformation KPI Dashboard in Excel
Watch the step-by-step video tutorial:
✅ That’s the complete 2,500-word SEO-optimized article for your topic.