Managing events is a complex process that involves multiple moving parts—venues, budgets, organizers, attendees, and client satisfaction. Without a structured system, data can become scattered and decision-making slows down. This is why businesses, event planners, and organizations increasingly rely on Event Management Dashboards in Excel.
In this article, you will learn everything about the Event Management Dashboard in Excel, including its features, advantages, use cases, best practices, and frequently asked questions. By the end, you will know exactly how to use this ready-to-use template to simplify your event planning and improve outcomes.
Click to Purchases Event Management Dashboard in Excel
What Is an Event Management Dashboard in Excel?
An Event Management Dashboard in Excel is a powerful performance tracking tool that consolidates event data into one centralized file. Instead of analyzing multiple reports or juggling spreadsheets, this dashboard transforms raw event data into visual insights through charts, key performance indicators (KPIs), and pivot-based reports.
Built on Microsoft Excel, this dashboard is easy to use, highly flexible, and does not require additional software. Whether you manage small corporate meetings or large conferences, the dashboard helps you measure efficiency, monitor performance, and make quick data-driven decisions.
Why Use Excel for Event Management?
You may wonder, why Excel? While there are many event management software tools in the market, Excel remains the most accessible and versatile choice. Here are some reasons:
-
Accessibility: Most professionals already have Excel installed, so there’s no need for expensive new tools.
-
Flexibility: Excel allows you to customize metrics, charts, and formulas to fit your event goals.
-
Cost-Effectiveness: Unlike dedicated software with recurring fees, Excel-based dashboards offer a one-time solution.
-
Scalability: The template can handle small or large datasets, making it suitable for startups and established firms alike.
-
Visualization: With pivot tables and charts, data becomes easy to understand at a glance.
Key Features of the Event Management Dashboard in Excel
The Event Management Dashboard in Excel comes with a structured layout divided into multiple pages, each focusing on a different dimension of event performance. Let’s explore them in detail:
Page Navigator
-
Located on the left side, the Page Navigator enables smooth switching between analytical pages.
-
Instead of scrolling through endless rows, users can jump directly to the analysis they need.
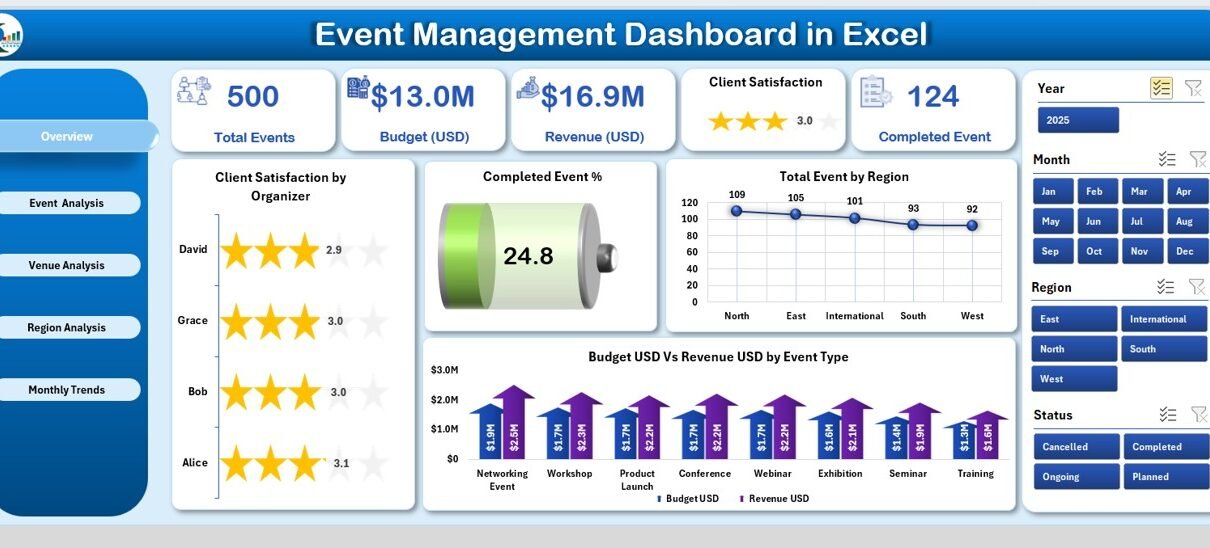
Overview Page
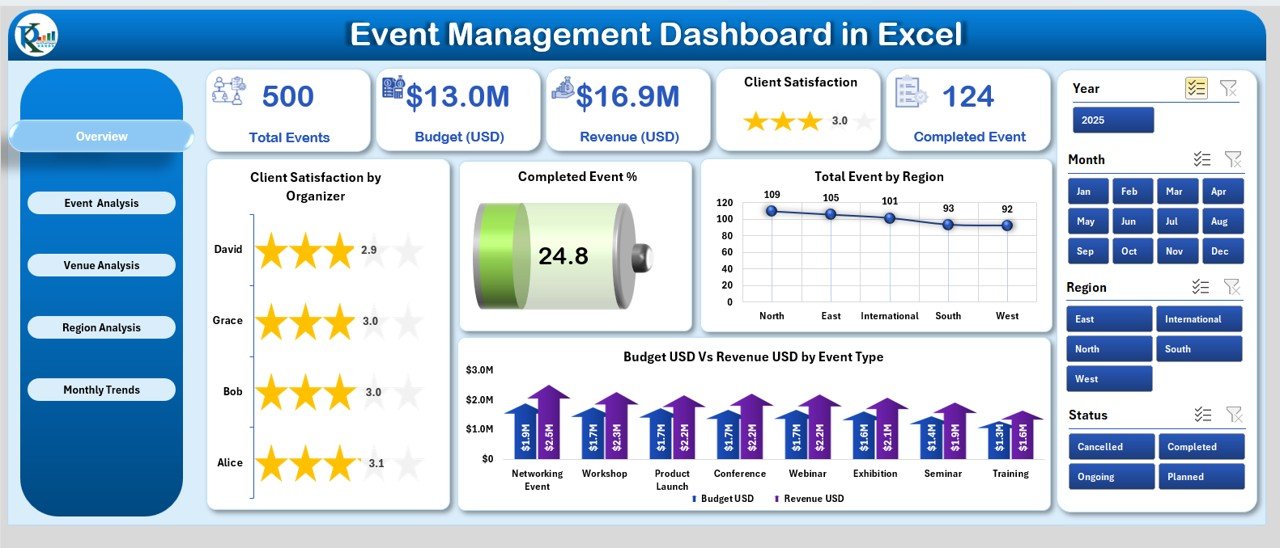
This is the main dashboard page and provides a quick summary of all major event KPIs.
Features include:
-
Five KPI Cards: A quick snapshot of event status and key performance values.
Click to Purchases Event Management Dashboard in Excel
Charts:
- Client Satisfaction by Organizer
- Completed Event %
- Total Event by Region
- Budget (USD) vs Revenue (USD) by Event Type
This page is especially useful for top management who want a bird’s-eye view without going into details.
Event Analysis Page
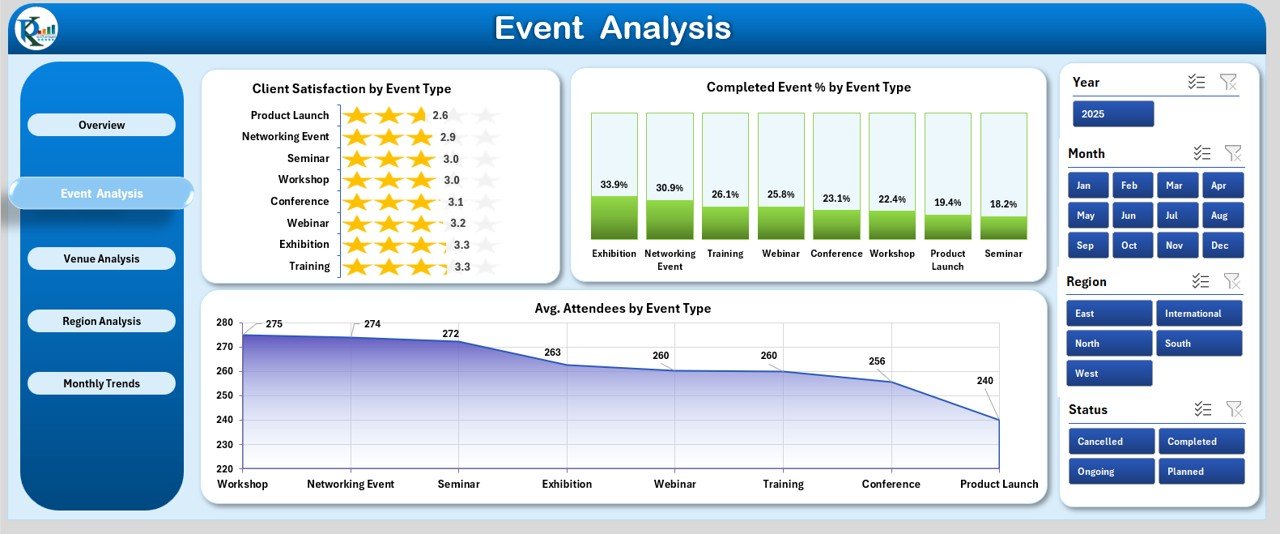
This page focuses on evaluating performance by event type.
Features include:
Charts:
- Client Satisfaction by Event Type
- Completed Events by Event Type
- Average Attendees by Event Type
With this page, you can identify which types of events deliver maximum satisfaction and participation.
Venue Analysis Page
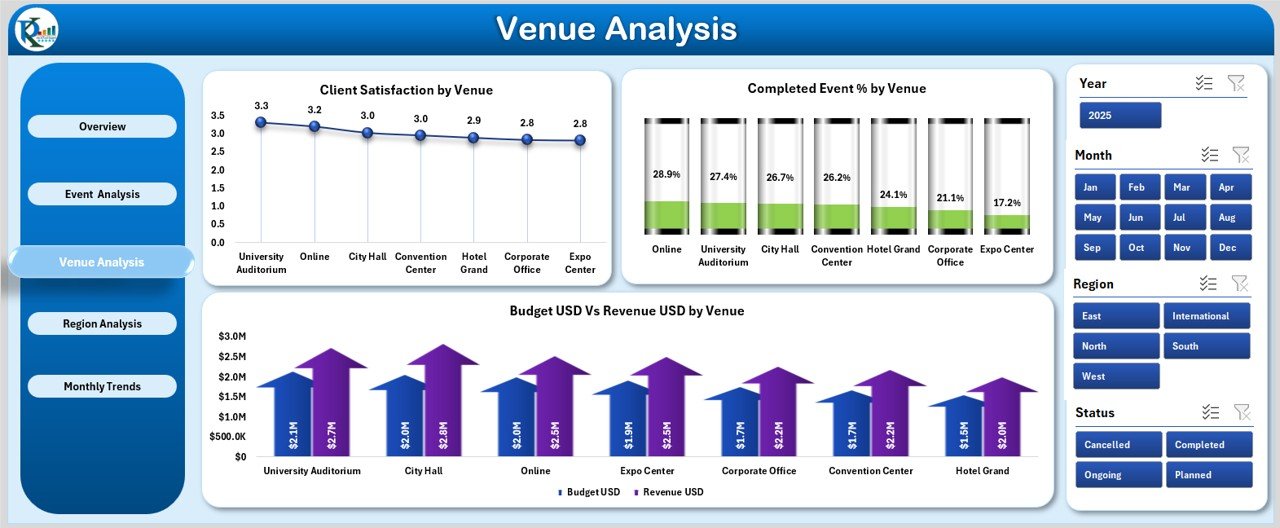
The success of an event often depends on the venue. This page highlights venue-specific performance.
Features include:
Charts:
- Client Satisfaction by Venue
- Completed Events by Venue and Region
- Budget (USD) vs Revenue (USD) by Venue
Event managers can use this analysis to select the best venues for future events and avoid underperforming ones.
Click to Purchases Event Management Dashboard in Excel
Region Analysis Page
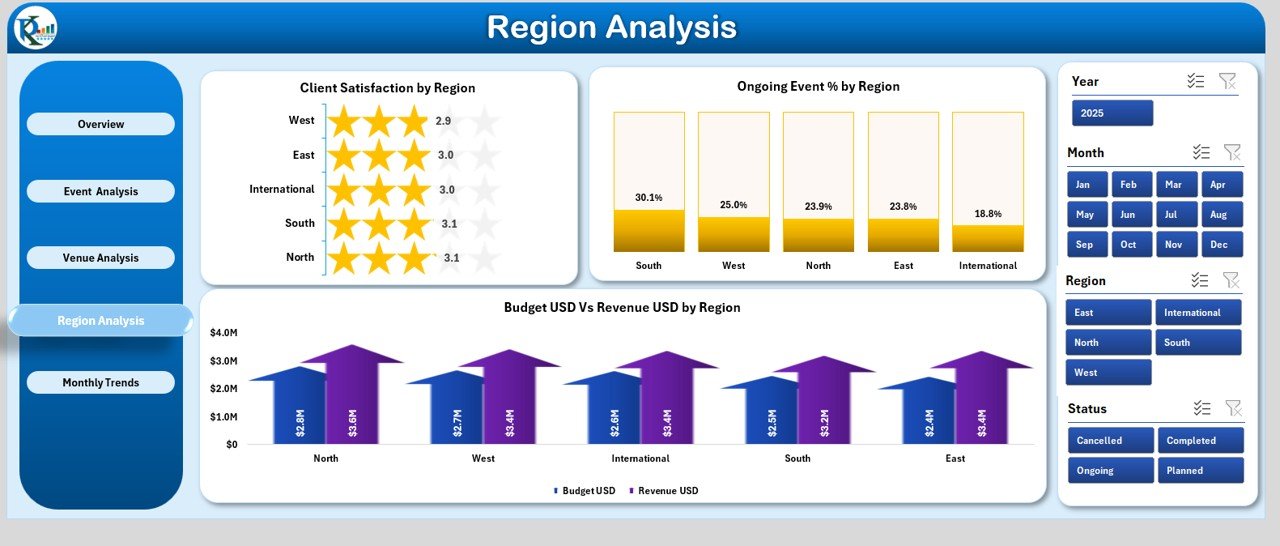
Geographic insights are crucial for expanding event success.
Features include:
Charts:
- Client Satisfaction by Region
- Ongoing Events by Region
- Budget (USD) vs Revenue (USD) by Region
This page ensures that planners understand which regions bring higher returns and which need attention.
Monthly Trends Page
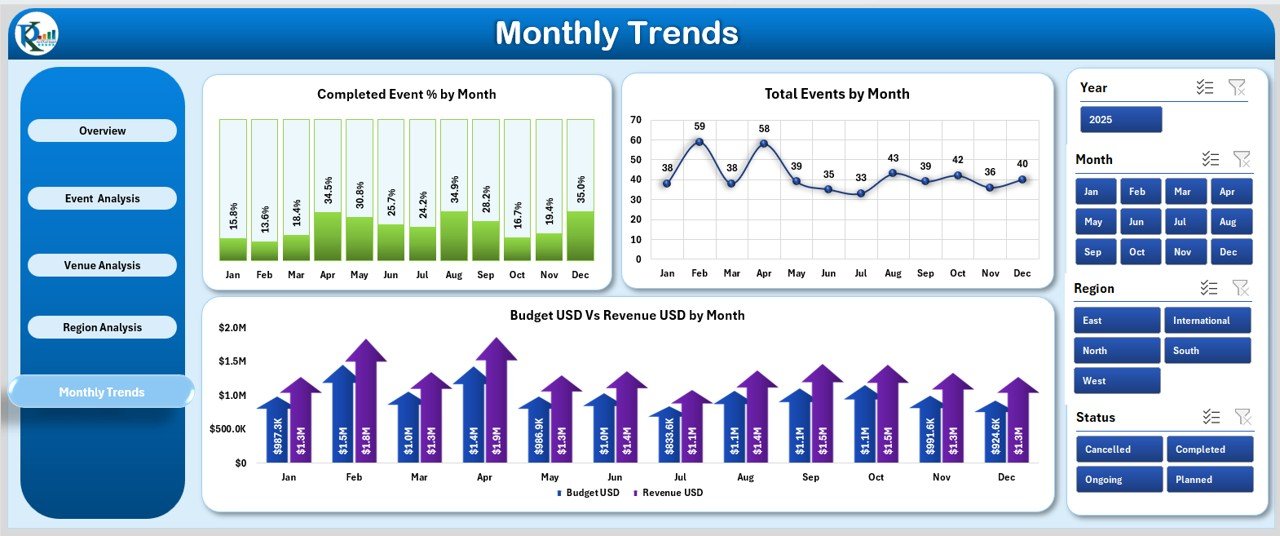
Monitoring trends over time helps in forecasting and planning.
Features include:
Charts:
- Total Completed Event % by Month
- Total Events by Month
- Budget (USD) vs Revenue (USD) by Month
With this, businesses can identify seasonal trends and prepare accordingly.
Support Sheet
-
This sheet stores reference data, lists, and formulas that power the entire dashboard.
-
It ensures clean, structured data management for seamless dashboard performance.
Advantages of Event Management Dashboard in Excel
Using this dashboard comes with multiple benefits:
✅ Centralized Data: All event information in one file.
✅ Real-Time Insights: Data updates automatically with pivot tables.
✅ Better Decision-Making: Charts and KPIs make patterns easy to see.
✅ Cost Saving: No need for expensive third-party tools.
✅ Improved Accountability: Assign responsibility to organizers, venues, or regions.
✅ Forecasting: Monthly and regional analysis helps predict future success.
✅ Customization: Easily add or remove metrics based on your business goals.
Opportunities for Improvement
While the Excel dashboard is powerful, here are areas that users can further enhance:
📊 Automation with Macros: Automating data entry could save time.
🔄 Integration: Linking with CRM or online forms for real-time updates.
📱 Mobile Access: Exporting charts to mobile-friendly formats.
🖥️ Dashboard Design: Adding more visuals such as heatmaps for better insights.
⏳ Time Tracking: Including session-level tracking for detailed reporting.
Best Practices for Using the Event Management Dashboard
To maximize efficiency, follow these best practices:
-
Keep Data Clean: Ensure there are no duplicates or errors in your input.
-
Update Regularly: Enter new event data promptly for accurate insights.
-
Use Filters: Apply slicers and filters for quick custom views.
-
Review Trends Monthly: Always check monthly patterns to adjust strategies.
-
Share Reports: Export charts as images or PDFs for stakeholder meetings.
-
Back Up Files: Keep backup copies to prevent data loss.
Use Cases of Event Management Dashboard
This dashboard is useful in a variety of contexts:
-
Corporate Event Planners: Track ROI of training programs, workshops, or conferences.
-
Marketing Teams: Analyze product launch events and promotional campaigns.
-
Educational Institutions: Manage seminars, webinars, and career fairs.
-
Nonprofits: Monitor fundraising events and donor satisfaction.
-
Hospitality Industry: Evaluate weddings, banquets, and conventions.
How to Get Started with the Dashboard
-
Download the Template: Start with the ready-to-use Excel file.
-
Input Event Data: Fill in details such as event type, organizer, venue, region, budget, and revenue.
-
Explore Pages: Navigate through the different analytical sections.
-
Customize if Needed: Add new KPIs or modify charts as per your event goals.
-
Generate Reports: Use pivot charts to create management reports quickly.
Conclusion
The Event Management Dashboard in Excel is more than just a spreadsheet—it’s a strategic tool for making smarter decisions. It helps event planners track performance, understand trends, and optimize future events. With features like Overview, Event Analysis, Venue Analysis, Region Analysis, and Monthly Trends, this dashboard offers a complete solution for both beginners and experienced planners.
By using this Excel-based tool, businesses can not only save money but also gain valuable insights into their event strategies.
Frequently Asked Questions (FAQs)
1. Who can use the Event Management Dashboard in Excel?
Anyone who manages events—corporate planners, marketers, nonprofits, or venue managers—can use this tool.
2. Do I need advanced Excel skills to use this dashboard?
No, the template is user-friendly. Basic Excel knowledge is enough to operate it.
3. Can I add my own KPIs to the dashboard?
Yes, the dashboard is fully customizable. You can add or remove KPIs based on your requirements.
4. How does the dashboard help with budgeting?
It shows Budget vs Revenue analysis by event type, venue, region, and month, helping you track profitability.
5. Can I share this dashboard with my team?
Yes, you can share the Excel file directly or export reports to PDF for presentations.
6. Is this dashboard suitable for both small and large events?
Absolutely. The dashboard can scale to manage small meetings as well as large conferences.
Visit our YouTube channel to learn step-by-step video tutorials