Managing training budgets is one of the most crucial responsibilities for HR departments, learning & development (L&D) teams, and finance professionals. Without proper visibility, companies often face issues such as overspending, underutilization of resources, or failure to track ROI from employee training.
A Training Budget Report in Excel provides a clear, structured, and data-driven way to monitor training costs, budget allocation, and program efficiency. Excel’s flexibility makes it the perfect platform to create interactive, dynamic, and easy-to-use reports that deliver powerful insights.
In this comprehensive article, we will explore:
-
What a Training Budget Report in Excel is.
-
Why businesses need it.
-
Key features of the template.
-
Step-by-step explanation of each report page.
-
Advantages of using Excel for training budget management.
-
Best practices to maximize efficiency.
-
Frequently asked questions (FAQs).
What Is a Training Budget Report in Excel?
Click to Purchases Training Budget Report in Excel
A Training Budget Report in Excel is a structured tool designed to track and analyze employee training costs, budget allocation, and utilization across programs and departments.
Instead of relying on scattered spreadsheets or manual tracking, this report consolidates everything into one interactive Excel file. It helps managers see how much of the training budget has been approved, allocated, utilized, or overspent.
The template usually includes summary dashboards, detailed reports, and raw data sheets. With built-in slicers, charts, and KPIs, decision-makers can quickly filter information and gain meaningful insights.
Why Do You Need a Training Budget Report?
Training is an investment in employees, but without proper monitoring, it can easily turn into a financial drain. Here’s why organizations need this report:
✅ Budget Control – Monitor allocation vs. utilization in real-time.
✅ Decision Support – Identify overspending programs and take corrective action.
✅ Resource Optimization – Allocate funds to departments or programs that deliver better ROI.
✅ Transparency – Provide clear reports to stakeholders and management.
✅ Scalability – Easily expand reporting for larger training programs.
Key Features of the Training Budget Report in Excel
The ready-to-use Training Budget Report template comes with powerful features that make tracking seamless. It contains 3 main pages plus support sheets.
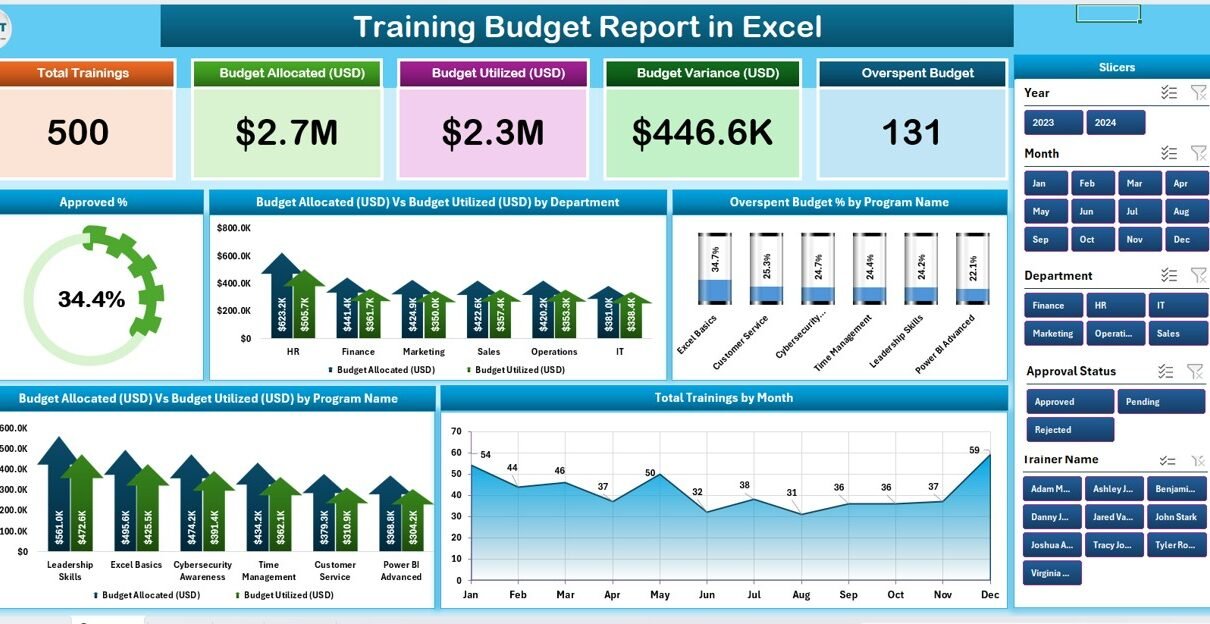
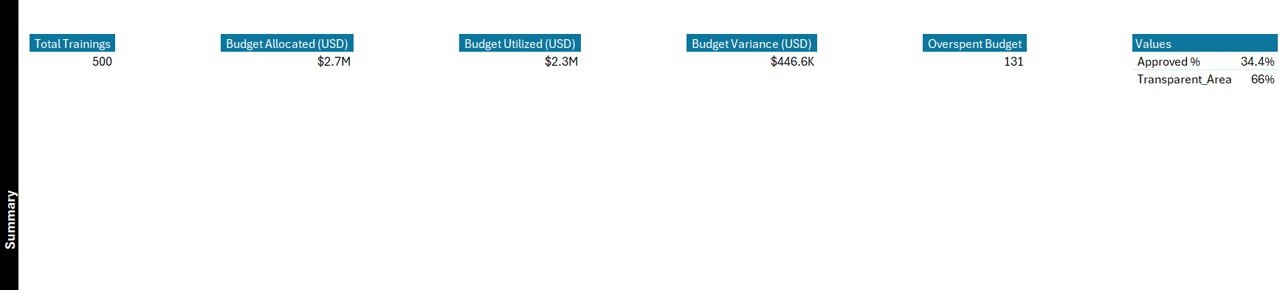
1. Summary Page
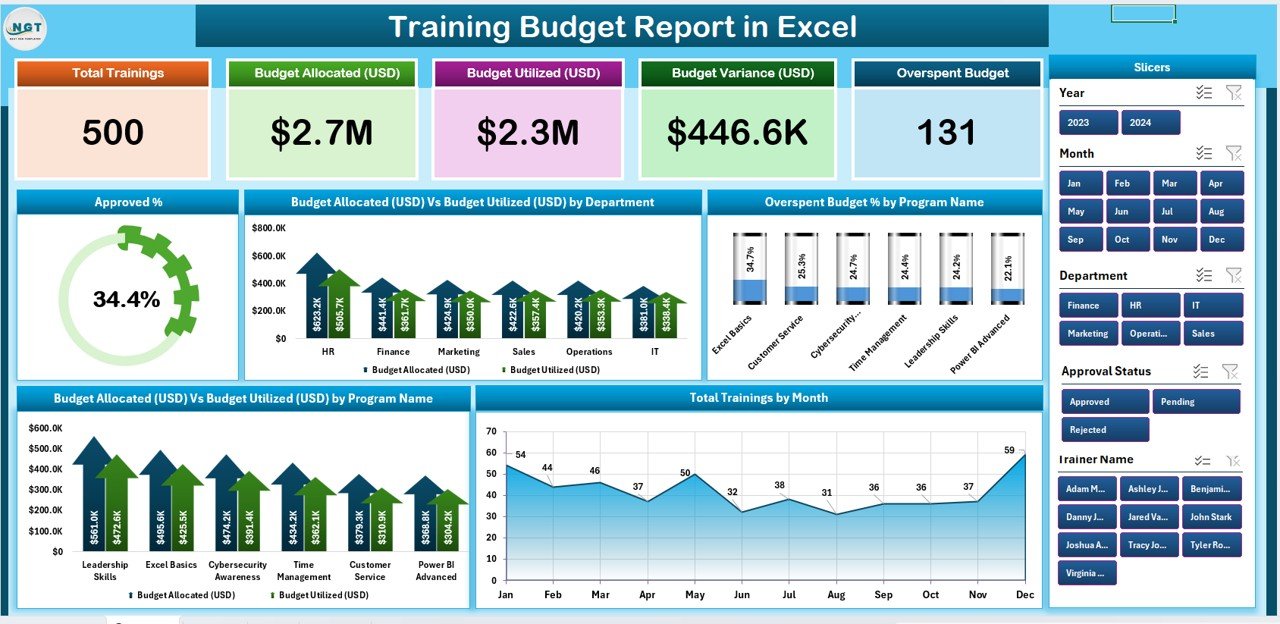
The Summary Page is the main dashboard of the report.
-
It contains 5 KPI cards that highlight key metrics such as Approved %, Budget Utilized %, Overspend %, and Total Training Programs.
-
On the right-side, a slicer allows users to filter data by department, program, or timeframe.
Click to Purchases Training Budget Report in Excel
The page includes 5 charts:
📊 Approved %
📊 Budget Allocation (USD) vs. Budget Utilized (USD) by Department
📊 Overspend Budget % by Program Name
📊 Budget Allocation (USD) vs. Budget Utilized (USD) by Program Name
📊 Total Training by Month
This page provides a quick bird’s-eye view of budget performance.
2. Report Page
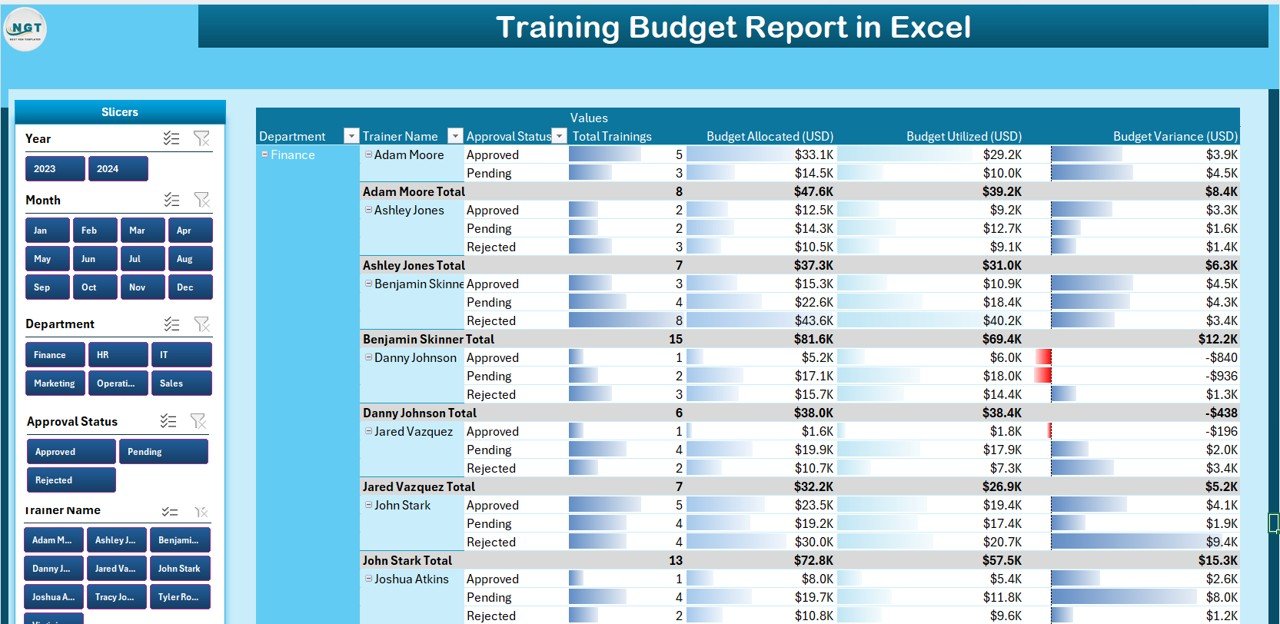
The Report Page offers detailed insights.
-
On the left-side, slicers enable filtering by department, training type, or year.
-
The center table lists budget allocations, utilizations, variances, and program-specific performance.
-
It gives managers a comprehensive tabular view of budget performance.
3. Data Sheet
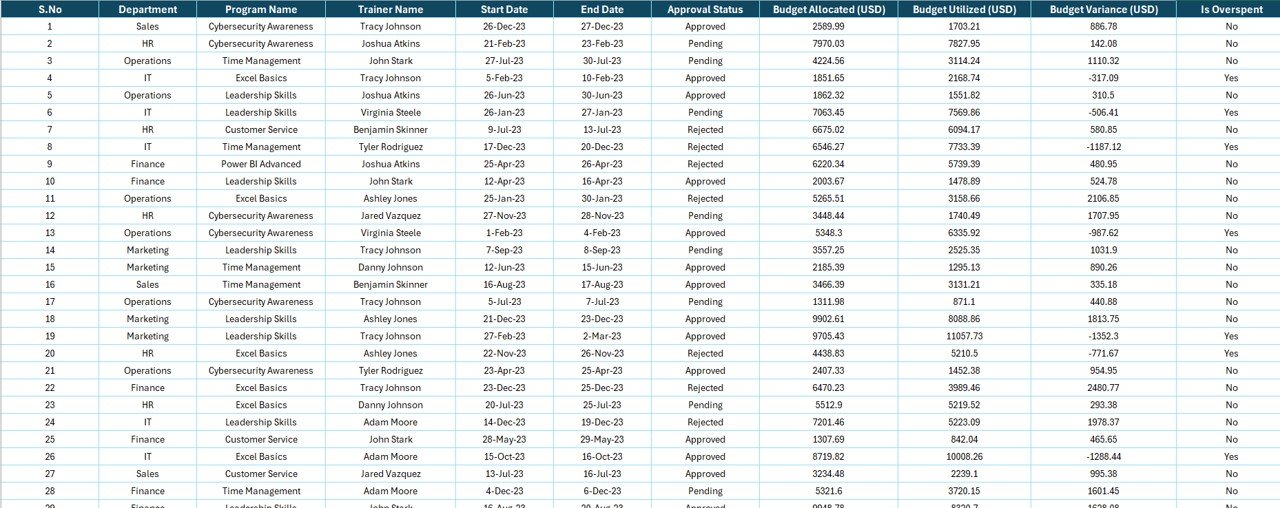
The Data Sheet is the foundation of the report.
-
All raw training-related data is stored here.
-
Includes columns like: Department, Program Name, Budget Allocated, Budget Utilized, Approved %, Overspend %, and Training Month.
-
The data sheet ensures the report remains dynamic, as pivot tables and charts refresh automatically when new data is added.
4. Support Sheet
The Support Sheet maintains reference lists such as department names, program categories, or data validation drop-downs.
This ensures consistency and error-free reporting.
Advantages of Training Budget Report in Excel
Using Excel for budget reporting comes with multiple advantages:
📈 Data Visualization – Interactive charts and KPIs make budget tracking easier.
💡 Informed Decision-Making – Identify where funds are overspent or underutilized.
🕒 Time-Saving – Automates calculations and reduces manual tracking.
🎯 Customization – Tailor reports based on department needs or organizational structure.
🔄 Scalability – Add more programs or departments without disrupting the report.
💰 Cost-Effective – No need for expensive software; Excel provides all functionalities.
How to Use the Training Budget Report
Using this template is straightforward. Here’s the step-by-step process:
-
Enter Raw Data – Update the data sheet with department, program, budget allocation, utilization, and training details.
-
Refresh Pivot Tables – Ensure all charts and reports are updated with the latest data.
-
Review Summary Page – Use the slicers to filter data and analyze KPIs.
-
Drill Down into Report Page – Get detailed insights by department or program.
-
Share Reports – Export charts or dashboards as PDF or PowerPoint for management reviews.
Best Practices for Training Budget Report in Excel
To get the most out of this tool, follow these best practices:
✅ Keep Data Clean – Maintain consistent program and department names.
✅ Update Regularly – Refresh the report after every new training initiative.
✅ Set Clear KPIs – Define measurable outcomes like cost per employee or ROI.
✅ Use Conditional Formatting – Highlight overspending or underutilization.
✅ Automate Where Possible – Use formulas, pivot tables, and slicers to reduce manual work.
✅ Validate Data – Use the support sheet for controlled input.
Opportunities for Improvement
While Excel is powerful, users can consider improvements:
🔄 Integration with HR Systems – Link Excel with HR software for auto-updates.
📊 Advanced Visualizations – Use Power BI for deeper insights and scalability.
🧑💼 Role-Based Access – Restrict editing to maintain data integrity.
Conclusion
A Training Budget Report in Excel is a must-have tool for HR, L&D, and finance professionals. It simplifies tracking, ensures budget control, and supports better decision-making. With ready-to-use templates, organizations can quickly adopt structured reporting without extra costs.
By following best practices and continuously improving, businesses can maximize ROI on training and ensure sustainable workforce development.
Frequently Asked Questions (FAQs)
1. What is a Training Budget Report in Excel?
It is a structured Excel-based tool used to track training costs, budget allocations, and utilization across departments and programs.
2. Who can use this report?
HR teams, L&D professionals, finance managers, and training coordinators can use it to monitor and optimize training investments.
3. What KPIs can be tracked with this report?
Common KPIs include Approved %, Budget Utilization %, Overspend %, Cost per Employee, and Training Program ROI.
4. Can the report be customized?
Yes, you can add or modify charts, KPIs, and slicers based on your organization’s structure.
5. What are the limitations of Excel-based reporting?
Excel is powerful but may not scale well for very large datasets. For enterprise-level needs, integration with Power BI or other analytics tools is recommended.
6. How often should the report be updated?
It is best to update the data sheet monthly or after every training program to keep insights accurate.
Visit our YouTube channel to learn step-by-step video tutorials
Youtube.com/@NeotechNavigators