Running a retail business today is more challenging than ever. Customers expect faster service, better prices, and seamless experiences. To stay competitive, retailers must rely on data-driven decision-making. That’s where a Retail KPI Scorecard in Excel becomes a powerful tool.
A KPI (Key Performance Indicator) scorecard helps retailers track their most important metrics in one place. Instead of managing scattered spreadsheets or struggling with manual reporting, this ready-to-use Excel template consolidates data, automates analysis, and provides actionable insights.
In this article, we’ll explore what a Retail KPI Scorecard is, how it works in Excel, its key features, advantages, best practices, and how you can use it to improve your retail business.
Click to Purchases Retail KPI Scorecard in excel
What Is a Retail KPI Scorecard in Excel?
A Retail KPI Scorecard in Excel is a structured template that tracks retail performance across critical areas like sales, customer satisfaction, inventory, and store operations.
Unlike traditional reports, a scorecard provides a visual and interactive dashboard where managers can analyze actual vs. target performance, monitor trends, and make faster business decisions.
By using Excel, businesses gain flexibility, automation, and ease of use—without the need for complex software or expensive tools.
Key Features of the Retail KPI Scorecard
The template comes with four powerful worksheets, each designed to handle different aspects of KPI tracking:
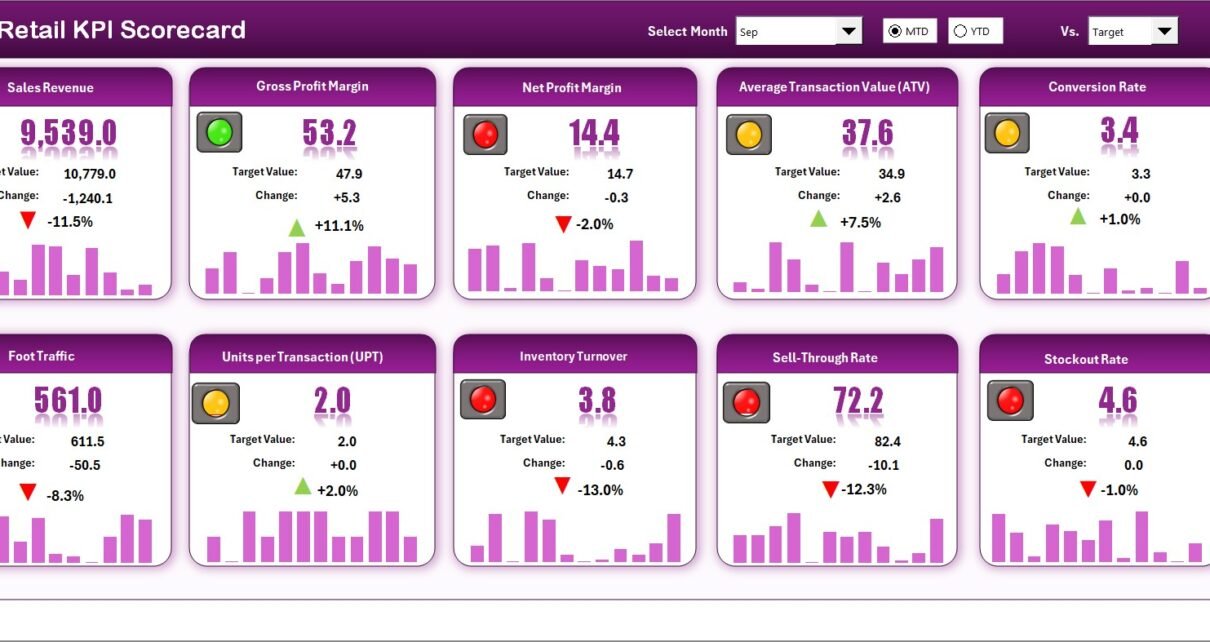
Scorecard Sheet – The Main Dashboard
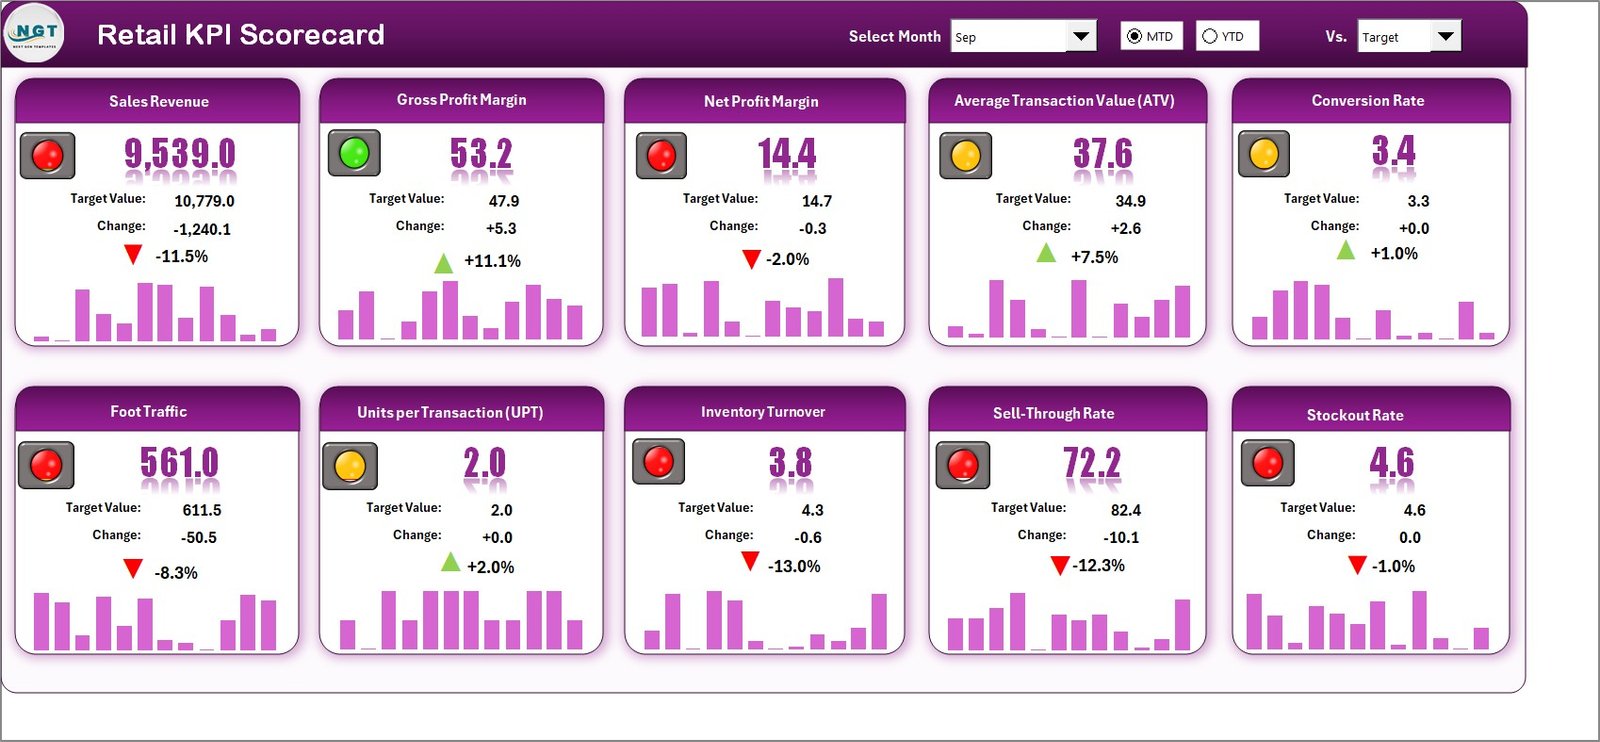
The Scorecard sheet is the heart of this template. It gives managers a quick overview of how the retail business is performing.
Features include:
📊 Dropdown Menus: Select month, MTD (Month-to-Date), or YTD (Year-to-Date) analysis.
🎯 Actual vs. Target Values: Instantly see if KPIs meet goals.
✅ Visual Indicators: Color-coded highlights show whether performance is above or below expectations.
📋 Comprehensive Overview: View multiple KPIs side by side with MTD and YTD comparisons.
This sheet acts as the control center, making it easy to track progress without digging into raw data.
KPI Trend Sheet – Performance Over Time
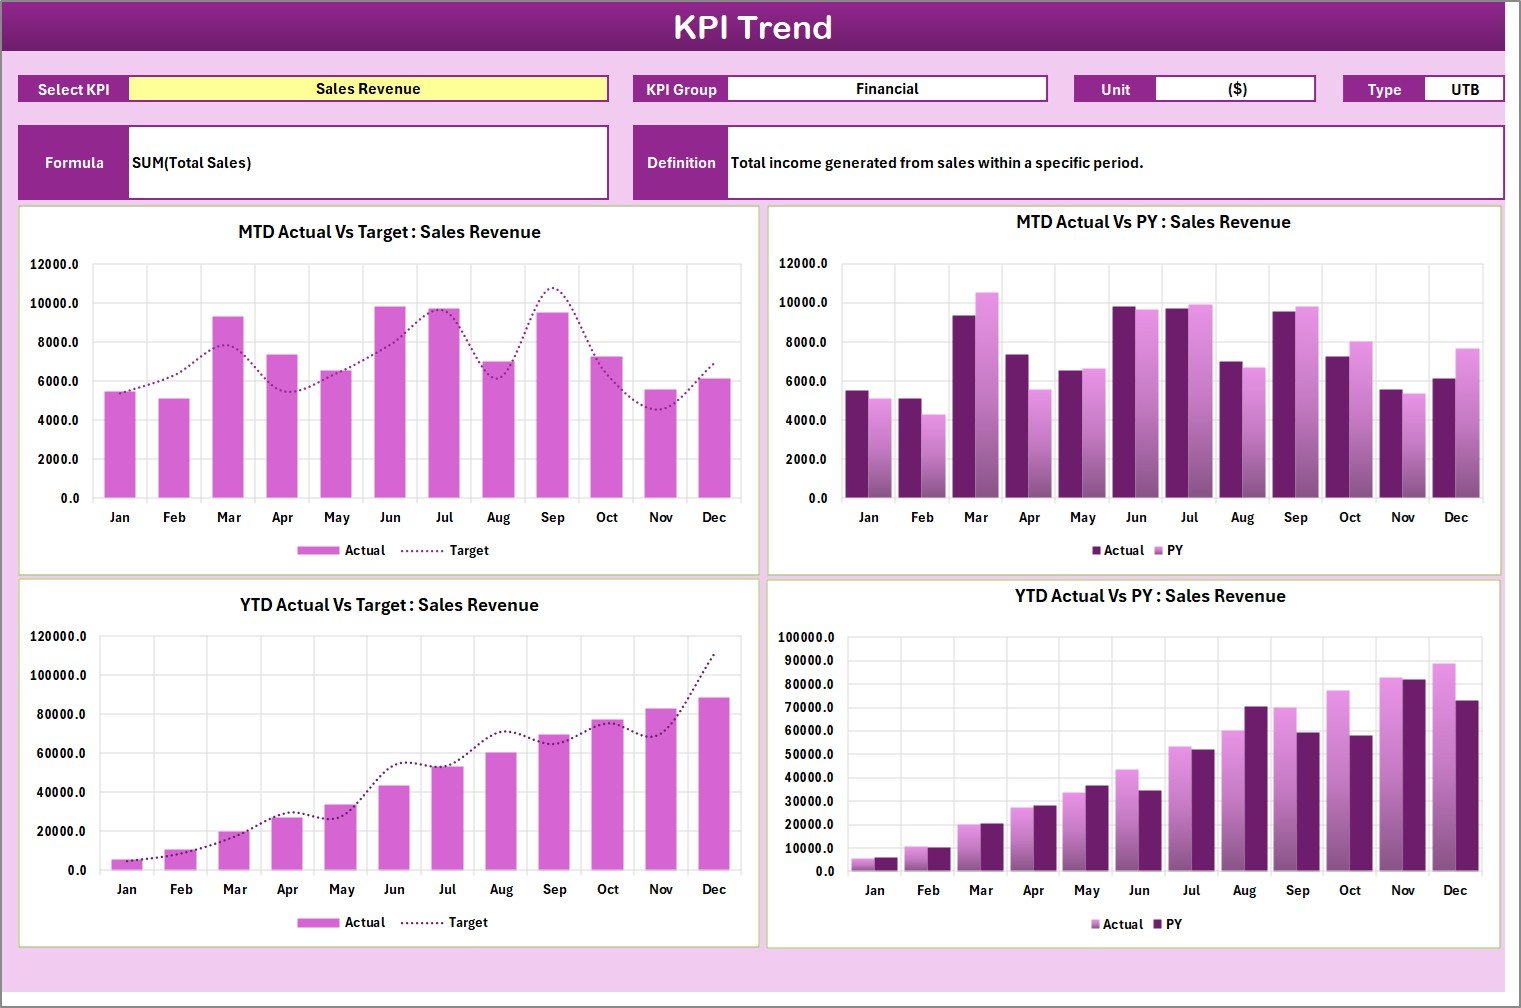
Retail performance is never static. Trends matter more than single values. That’s why the KPI Trend sheet is essential.
Features include:
🔽 KPI Selection: Choose any KPI from a dropdown list in cell C3.
🏷️ KPI Information: Automatically displays KPI Group, Unit, Type (UTB – Upper the Better, LTB – Lower the Better), Formula, and Definition.
📈 Trend Charts: Visualize MTD and YTD performance for Actual, Target, and Previous Year (PY) numbers.
This sheet helps managers spot patterns, seasonal trends, and improvement opportunities.
Input Data Sheet – The Foundation of the Scorecard
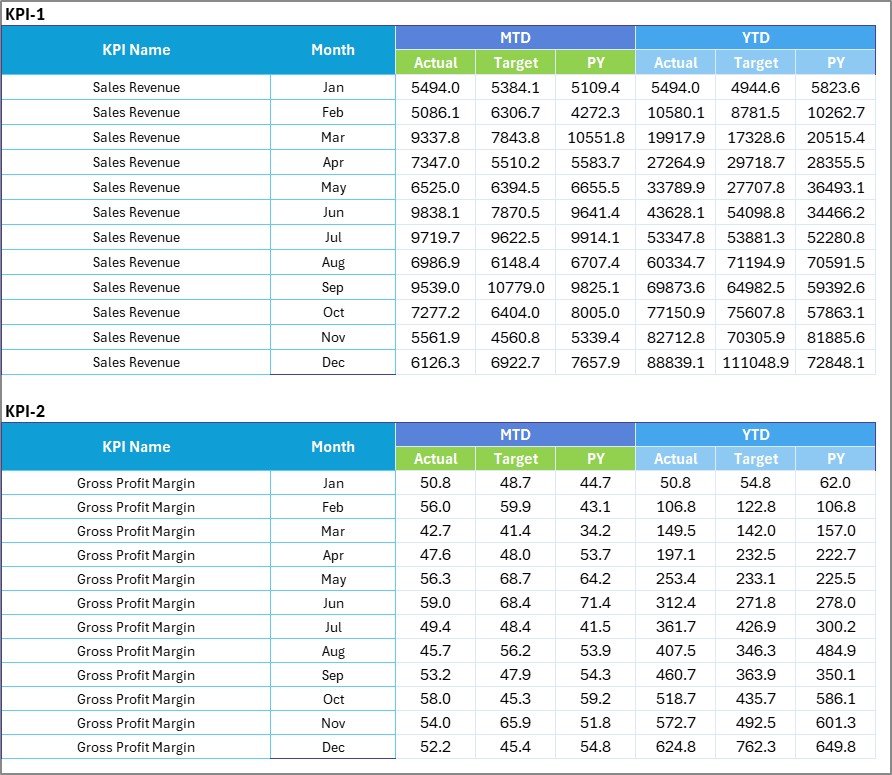
The Input Data sheet is where all raw performance data is entered.
Features include:
✍️ Data Entry: Record actual values, targets, and metrics for each KPI.
🔄 Flexibility: Update new results anytime to refresh the Scorecard and Trend sheets automatically.
⚙️ Automation: Formulas and linked references ensure accuracy across all sheets.
This sheet functions like the engine that powers the dashboard. Without accurate input, the scorecard cannot deliver reliable insights.
KPI Definition Sheet – Standardizing Metrics
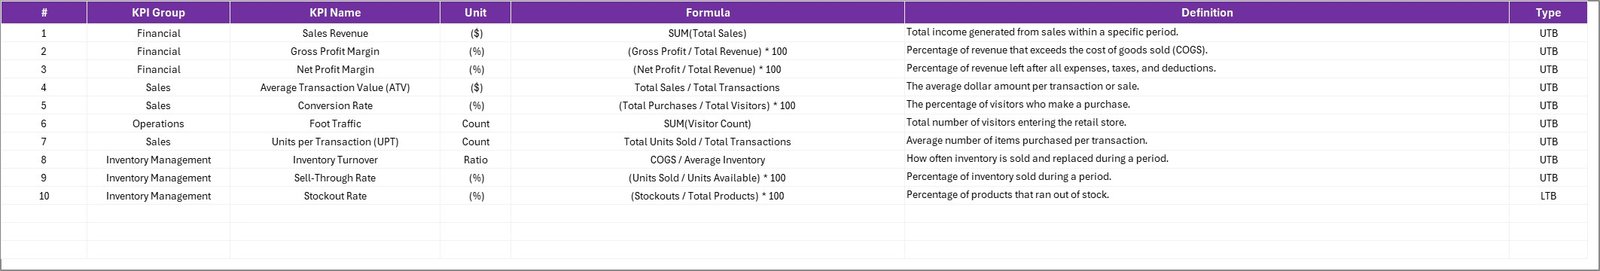
Consistency is critical when tracking KPIs across multiple stores or departments. The KPI Definition sheet ensures everyone speaks the same “performance language.”
Features include:
📌 Enter KPI Name, KPI Group, Unit, Formula, and KPI Definition.
📖 Create a standard reference library of all KPIs.
✅ Prevent confusion between similar KPIs by defining formulas and units clearly.
This sheet promotes clarity and transparency, especially when sharing reports across teams.
Click to Purchases Retail KPI Scorecard in excel
Why Should Retailers Use a KPI Scorecard in Excel?
Managing a retail business involves monitoring dozens of metrics—from daily sales to customer retention. A KPI scorecard helps retailers:
-
Save Time: Automate repetitive reporting tasks.
-
Improve Accuracy: Reduce errors caused by manual calculations.
-
Enhance Decision-Making: Get instant insights on what’s working and what’s not.
-
Increase Accountability: Assign responsibility for each KPI.
-
Boost Performance: Identify underperforming areas quickly.
Advantages of Retail KPI Scorecard in Excel
Using a retail scorecard in Excel offers several key benefits:
📊 Data Visualization
Instead of staring at raw numbers, you get charts, tables, and visual indicators that make performance analysis easier.
⏱️ Real-Time Updates
With simple data entry, the entire scorecard updates instantly. Managers always work with the latest information.
🎯 Goal Alignment
Targets can be set for each KPI, helping staff align daily work with business objectives.
🛠️ Easy Customization
Retailers can add new KPIs, adjust formulas, or change layouts to fit unique needs.
💰 Cost-Effective
Unlike expensive BI tools, Excel templates are affordable and accessible to any business.
📈 Scalability
Whether you run a single store or a retail chain, the scorecard can scale with your data.
Best Practices for Using Retail KPI Scorecard in Excel
To get the most value from your scorecard, follow these best practices:
✅ Define Clear KPIs: Avoid vague metrics. Instead, use specific, measurable indicators like “Monthly Sales Growth %” or “Inventory Turnover.”
📅 Update Data Regularly: Keep input data fresh to ensure reports remain accurate.
🎨 Use Conditional Formatting: Highlight performance status with green (good), yellow (average), and red (poor).
🔄 Compare Multiple Periods: Always analyze Actual vs. Target vs. Previous Year to see real performance.
👥 Share with Teams: Ensure employees understand how their work impacts KPIs.
📊 Leverage Pivot Tables: Use pivot charts for deeper drilldowns.
📈 Track Both MTD & YTD: Month-to-Date analysis shows immediate progress, while Year-to-Date reveals long-term performance.
Use Cases of Retail KPI Scorecard
Different retail formats can use KPI scorecards in unique ways:
🛒 Supermarkets
Track daily sales, basket size, shrinkage rate, and customer footfall.
🏬 Department Stores
Monitor department-wise revenue, staff efficiency, and seasonal promotions.
📦 E-Commerce Retailers
Track website traffic, conversion rates, average order value, and return rates.
🍔 Restaurants & Cafes
Measure table turnover, average order value, delivery time, and customer satisfaction.
👕 Fashion Retail
Track inventory turnover, sales by category, markdown % and online vs. offline sales.
🏪 Franchise Chains
Standardize KPIs across multiple stores to maintain brand consistency.
How to Implement Retail KPI Scorecard in Excel?
-
Download or Create the Template
Use a prebuilt scorecard or design one based on your retail KPIs. -
Identify Key KPIs
Choose metrics aligned with your business goals, such as revenue growth, customer retention, or staff productivity. -
Enter Historical Data
Load past results into the Input Data sheet for trend analysis. -
Set Targets
Define realistic monthly and yearly targets. -
Monitor Trends
Use the KPI Trend sheet to analyze performance patterns. -
Review & Act
Regularly review the Scorecard sheet, identify gaps, and take corrective actions.
Conclusion
The Retail KPI Scorecard in Excel is more than just a spreadsheet—it is a powerful decision-making tool. By tracking KPIs systematically, retailers can improve efficiency, optimize resources, and deliver better customer experiences.
Whether you’re a small shop owner or managing a retail chain, this scorecard can simplify reporting and accelerate growth.
Investing in a structured KPI scorecard means investing in clarity, accountability, and profitability.
Frequently Asked Questions (FAQs)
1. What are Retail KPIs?
Retail KPIs are measurable indicators that track performance in areas like sales, customer satisfaction, inventory, and store operations.
2. Why use Excel for KPI Scorecards?
Excel is cost-effective, flexible, and widely accessible. It allows retailers to build automated scorecards without expensive software.
3. Can I customize the Retail KPI Scorecard?
Yes, you can add or remove KPIs, adjust formulas, and modify layouts to suit your business needs.
4. How often should I update KPI data?
Ideally, update data daily or weekly. Regular updates ensure the scorecard reflects current performance.
5. What are the most important retail KPIs?
Some key retail KPIs include sales growth, average basket size, customer satisfaction score (CSAT), inventory turnover, and gross margin.
6. Can small businesses use this scorecard?
Absolutely. The template works for both small shops and large retail chains.
7. How do KPIs improve decision-making?
By highlighting strengths and weaknesses, KPIs allow managers to focus on areas that need improvement, leading to better business decisions.
Visit our YouTube channel to learn step-by-step video tutorials