In today’s competitive business environment, organizations need clear, accurate, and measurable insights into their performance. Quality management is not only about delivering products or services—it is about ensuring consistency, efficiency, and improvement across all processes. To achieve this, companies must track and evaluate their Key Performance Indicators (KPIs).
One of the most effective tools for monitoring and improving quality performance is the Quality KPI Scorecard in Excel. This scorecard provides a structured and interactive way to measure quality-related KPIs, compare them with targets, and make informed decisions. Unlike costly business intelligence software, Excel offers flexibility, accessibility, and simplicity, making it an ideal platform for building KPI scorecards.
In this article, we will explore the structure, features, advantages, use cases, and best practices of a Quality KPI Scorecard in Excel. By the end, you will understand how to use it effectively and why it is a powerful tool for quality management.
Click to Purchases Quality KPI Scorecard in Excel
What Is a Quality KPI Scorecard in Excel?
A Quality KPI Scorecard in Excel is a performance-tracking tool that organizes, monitors, and visualizes key quality indicators in one place. It allows managers and teams to measure Month-to-Date (MTD) and Year-to-Date (YTD) results against set targets, identify gaps, and track progress over time.
Instead of handling scattered reports, Excel brings data together into a structured format, supported by charts, conditional formatting, and dynamic features such as dropdown menus.
Click to Purchases Quality KPI Scorecard in Excel
Structure of the Quality KPI Scorecard Template
The Quality KPI Scorecard in Excel is divided into four main worksheets, each designed to provide different insights.
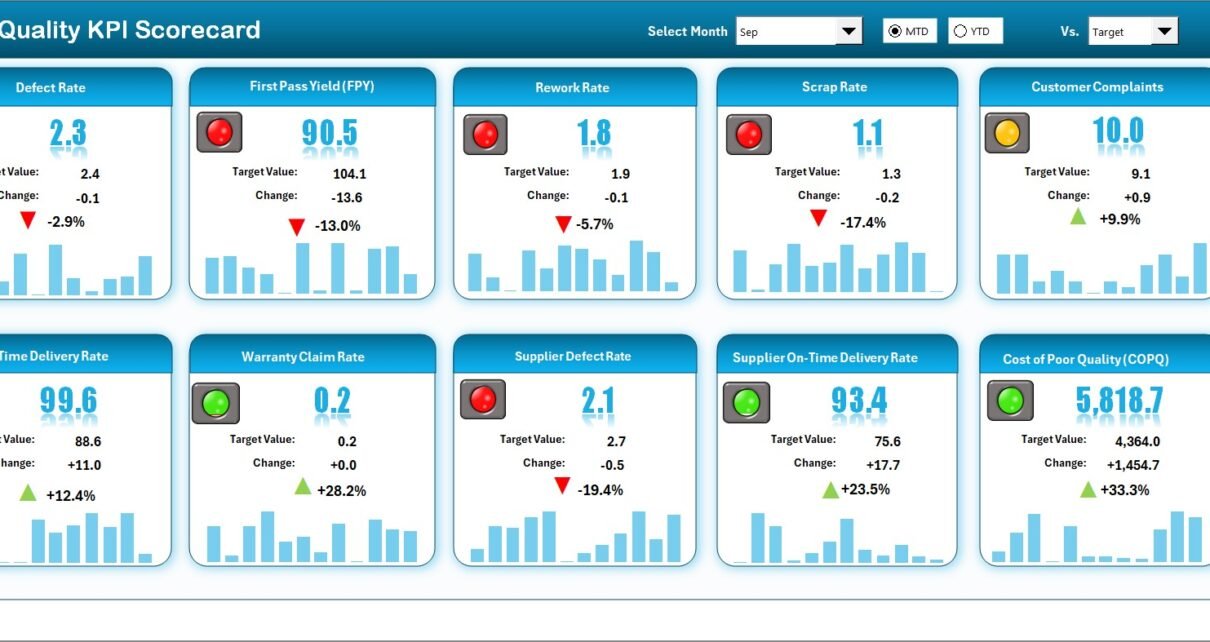
1. Scorecard Sheet
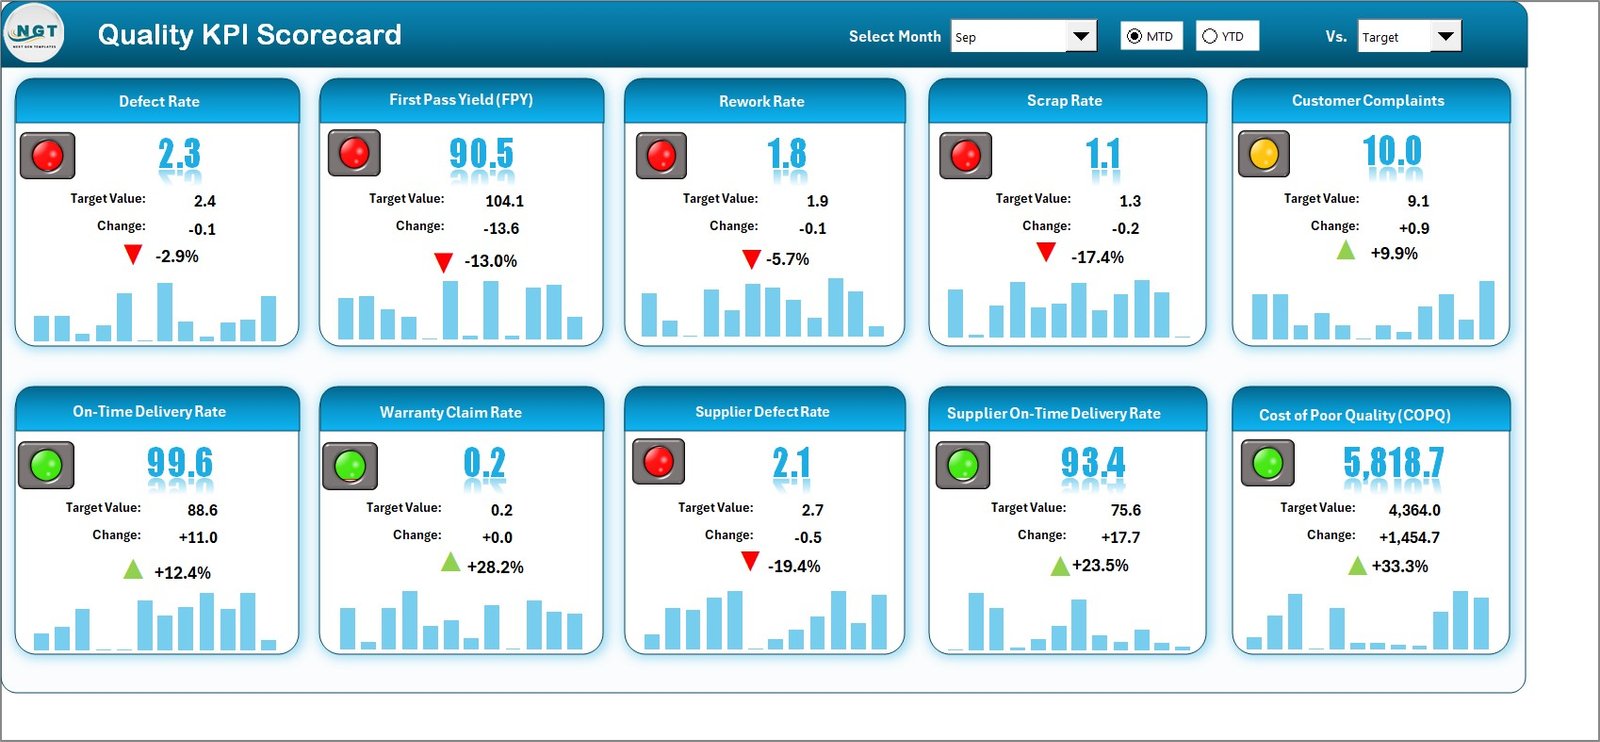
The Scorecard Sheet is the main dashboard and serves as the central view of all KPIs.
Key Features:
-
Dropdown Menus: Select the month and choose MTD (Month-to-Date) or YTD (Year-to-Date) for analysis.
-
Actual vs Target Values: Compare real results against expected targets.
-
Visual Indicators: Color-coded visuals highlight performance gaps.
-
Comprehensive Overview: A complete picture of KPIs for management decisions.
This sheet helps leaders quickly identify whether performance is improving, stable, or declining.
2. KPI Trend Sheet
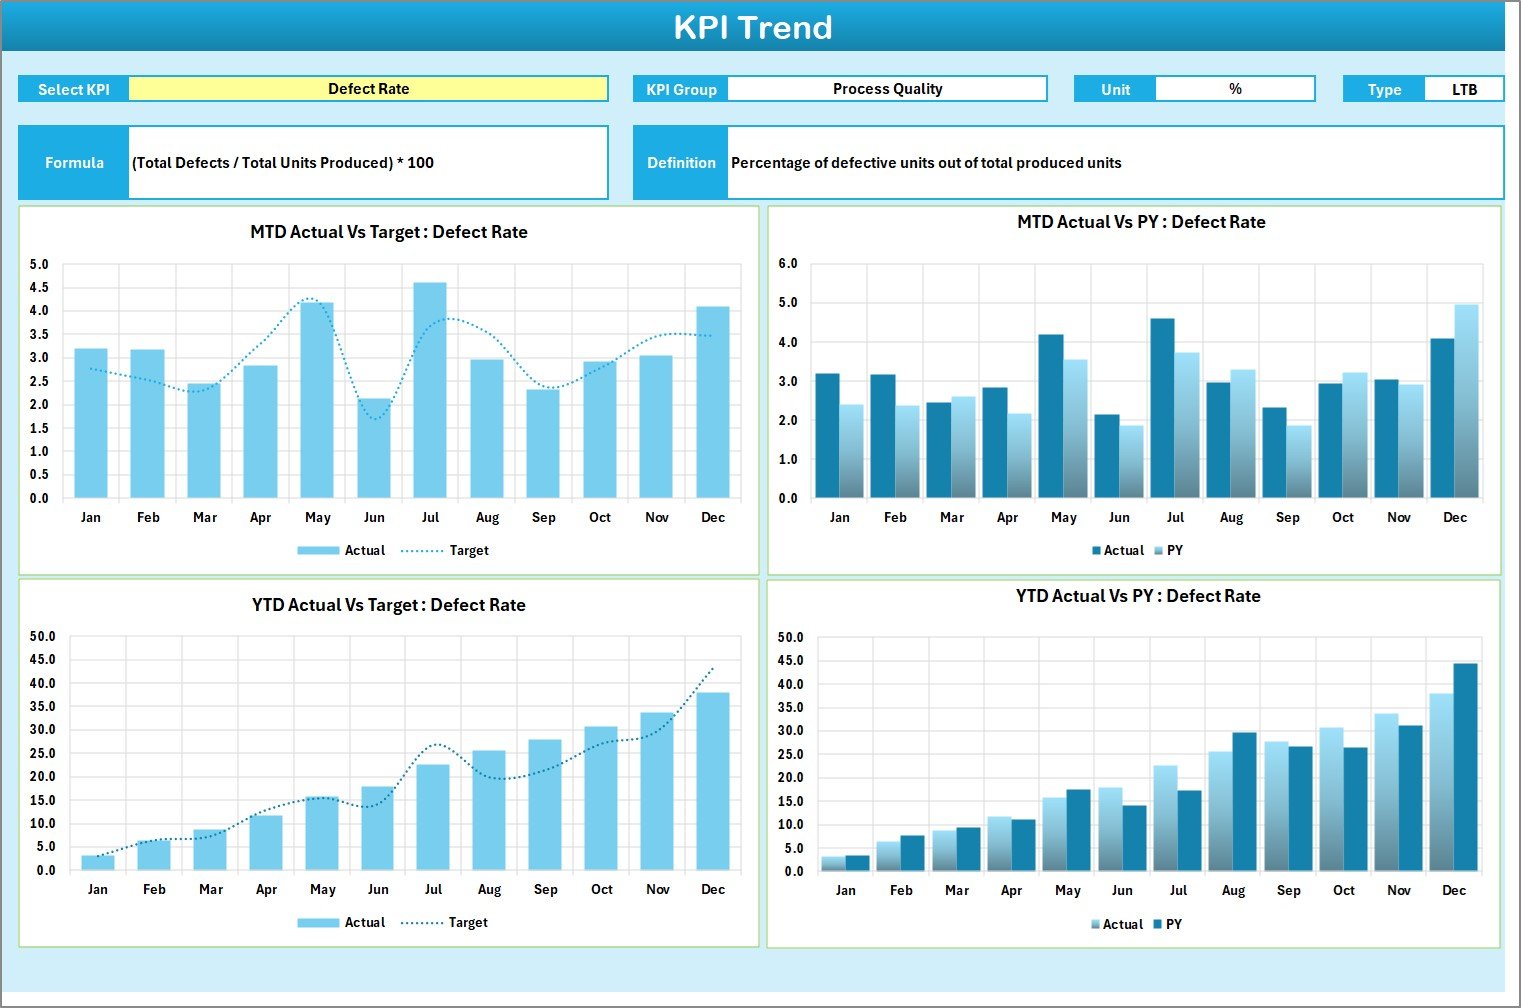
The KPI Trend Sheet focuses on tracking changes over time.
Key Features:
-
Dropdown Selector: Choose a KPI from the dropdown menu in cell C3.
-
KPI Details: Displays KPI group, unit, type (Lower the Better or Upper the Better), formula, and definition.
-
Trend Charts: View trends for MTD and YTD performance vs. targets and previous year data.
This sheet is highly useful for long-term monitoring and forecasting future performance.
3. Input Data Sheet
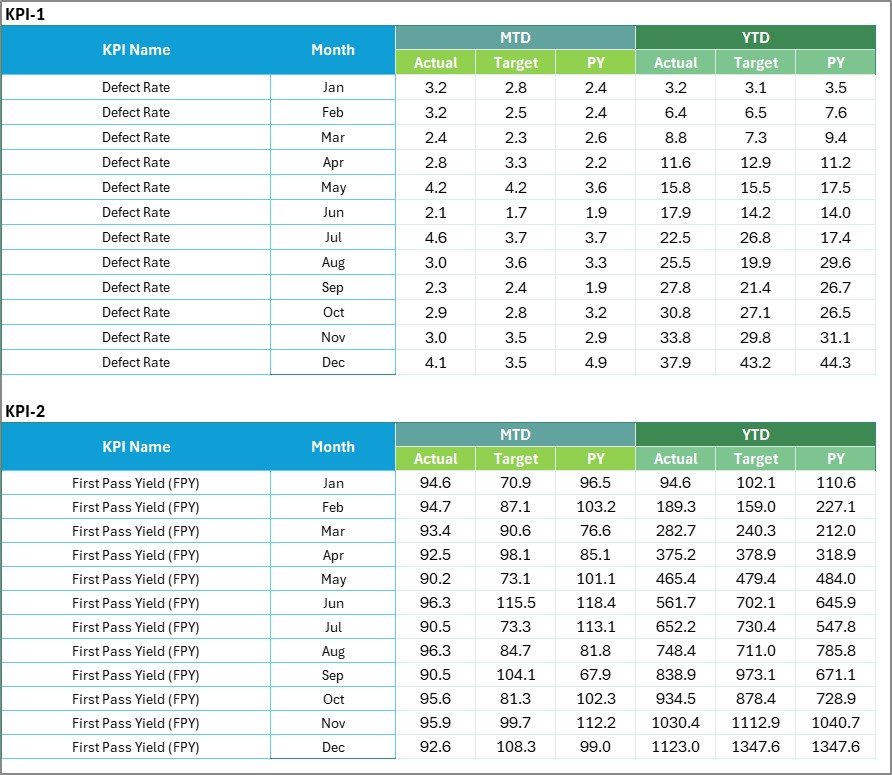
The Input Data Sheet is the backbone of the scorecard, where users enter KPI-related values.
Key Features:
-
Data Entry: Record actual results, targets, and other metrics.
-
Flexibility: Update regularly with fresh data.
-
Accuracy: Acts as the single source of truth for reporting.
Keeping this sheet up-to-date ensures that the scorecard remains reliable and actionable.
4. KPI Definition Sheet
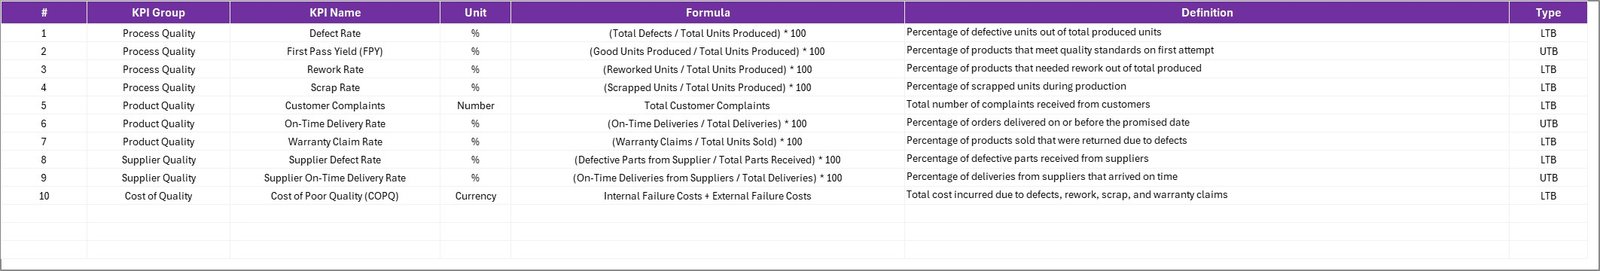
The KPI Definition Sheet provides clarity and standardization for each metric.
Key Features:
-
KPI Details: Add KPI Name, Group, Unit, Formula, and Definition.
-
Consistency: Ensures that all team members understand the same KPI definition.
-
Transparency: Reduces confusion and keeps reporting accurate.
This sheet is particularly important for organizations with multiple departments using the same scorecard.
Click to Purchases Quality KPI Scorecard in Excel
Why Use a Quality KPI Scorecard in Excel?
Tracking KPIs is not only about numbers—it is about driving results. A Quality KPI Scorecard in Excel ensures that you can:
-
Monitor performance trends.
-
Identify quality issues early.
-
Measure progress against organizational goals.
-
Communicate results clearly to stakeholders.
-
Reduce reporting time with automated visual indicators.
Advantages of a Quality KPI Scorecard in Excel
1. Easy to Use
Excel is widely used and familiar to most employees. No advanced training is required.
2. Cost-Effective
Unlike expensive BI software, Excel is affordable and readily available.
3. Customizable
Users can tailor the scorecard to match industry-specific KPIs and organizational needs.
4. Visual and Interactive
With charts, conditional formatting, and dropdowns, the scorecard becomes more engaging.
5. Real-Time Updates
As data is entered in the input sheet, all dashboards update automatically.
6. Data Transparency
Centralized KPI definitions prevent misunderstandings and promote clarity.
Use Cases of a Quality KPI Scorecard
-
Manufacturing Industry: Track defect rates, rework percentages, and compliance with standards.
-
Healthcare Sector: Monitor patient satisfaction, error rates, and service efficiency.
-
Education: Measure student performance, feedback scores, and teaching quality.
-
Retail: Evaluate customer satisfaction, return rates, and order accuracy.
-
IT & Software: Track bug resolution time, testing coverage, and service uptime.
Best Practices for Using the Quality KPI Scorecard in Excel
-
Define Clear KPIs
-
Ensure KPIs are specific, measurable, and aligned with organizational goals.
-
-
Update Data Regularly
-
Keep the Input Data Sheet current to maintain accuracy.
-
-
Use Color Codes and Visuals
-
Apply conditional formatting for quick recognition of performance gaps.
-
-
Focus on Relevant KPIs
-
Avoid overloading the scorecard with too many metrics.
-
-
Review Trends, Not Just Numbers
-
Use the KPI Trend Sheet to identify patterns over time.
-
-
Train Teams
-
Provide training so that employees understand how to use the scorecard effectively.
-
Common Mistakes to Avoid
-
Entering incomplete or outdated data.
-
Using too many KPIs, which causes clutter.
-
Ignoring trend analysis.
-
Not aligning KPIs with business strategy.
-
Over-relying on visuals without verifying data accuracy.
Conclusion
A Quality KPI Scorecard in Excel is a powerful, practical, and cost-effective tool for any organization that wants to track quality performance. It consolidates data, simplifies reporting, and offers insights that drive improvement. With features like dropdown menus, conditional formatting, trend charts, and comprehensive KPI definitions, this template ensures clarity and efficiency.
By following best practices and updating data consistently, organizations can transform their quality management process, make informed decisions, and achieve sustainable growth.
Click to Purchases Quality KPI Scorecard in Excel
Frequently Asked Questions (FAQs)
1. What is a KPI Scorecard?
A KPI Scorecard is a tool used to measure and track performance indicators in an organized way. It compares actual values against targets and highlights gaps.
2. Why should I use Excel for a KPI Scorecard?
Excel is easy to use, affordable, and flexible. It allows customization and can handle complex data while providing powerful visualizations.
3. What kind of KPIs can I track with this scorecard?
You can track defect rates, rework percentages, customer satisfaction, service efficiency, compliance levels, and more.
4. How often should I update the Input Data Sheet?
Ideally, update the data daily or weekly, depending on your reporting cycle. Consistency ensures accuracy.
5. Can I add more KPIs to the template?
Yes, the template is fully customizable. You can add new KPIs, adjust formulas, and extend the dashboard as required.
6. Is this scorecard suitable for small businesses?
Absolutely. Small businesses can benefit from Excel scorecards because they are cost-effective and easy to manage.
7. What’s the difference between a KPI Dashboard and a KPI Scorecard?
A Dashboard is a real-time view of key data, while a Scorecard focuses on performance against targets and strategy alignment.
Click to Purchases Quality KPI Scorecard in Excel
Visit our YouTube channel to learn step-by-step video tutorials