In the fast-paced world of entertainment, managing films, TV shows, budgets, ratings, and production timelines can be overwhelming. Producers, studios, and streaming platforms deal with hundreds of moving parts — from budgets and genres to post-production timelines and regional distribution.
A Film & Television Dashboard in Excel simplifies this complexity. It brings together every critical piece of data into a single, interactive view. With this dashboard, industry professionals can monitor progress, analyze performance, and make data-driven decisions — all within a familiar Excel environment.
This article explores everything about this powerful dashboard: its structure, features, benefits, and best practices to help you manage your film and TV data efficiently.
Click to Purchases Film & Television Dashboard in Excel
What Is a Film & Television Dashboard in Excel?
A Film & Television Dashboard is an Excel-based analytical tool designed to track and visualize data related to film and television projects. It consolidates data from different departments — such as production, post-production, distribution, and marketing — into one easy-to-navigate interface.
This dashboard enables professionals to analyze metrics such as film ratings, genre performance, release percentages, platform distribution, and revenue trends across different regions or months. Instead of scrolling through multiple sheets or reports, users get a clear visual summary with charts, KPIs, and filters.
Structure of the Film & Television Dashboard in Excel
This dashboard template comes with five dynamic pages (sheets), each focusing on a different dimension of the entertainment data. A page navigator on the left side allows users to switch between sections effortlessly.
Overview Page
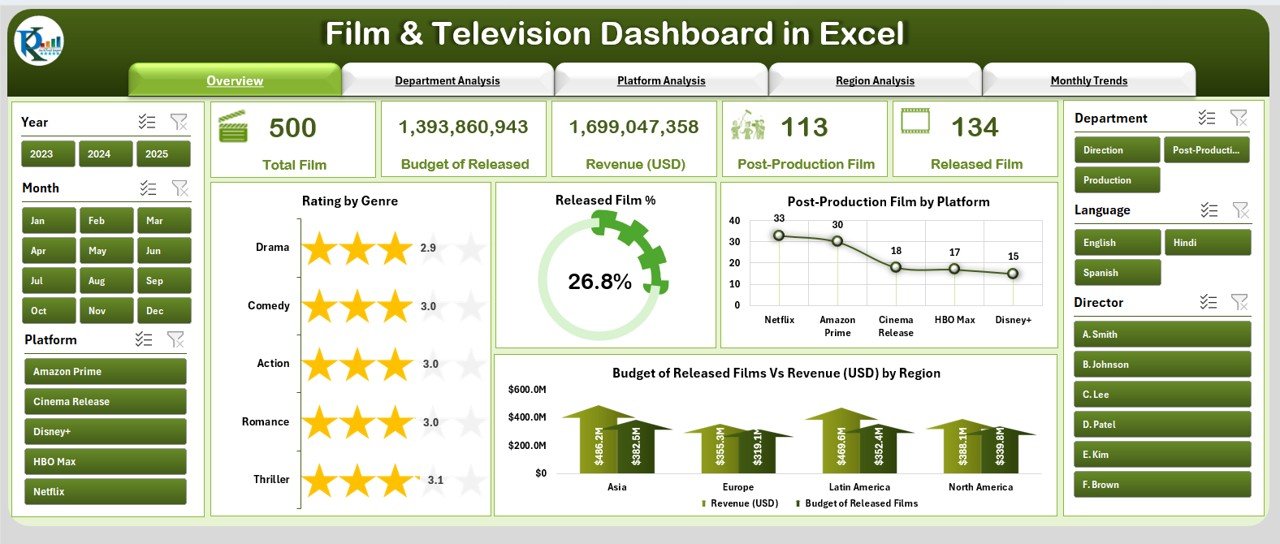
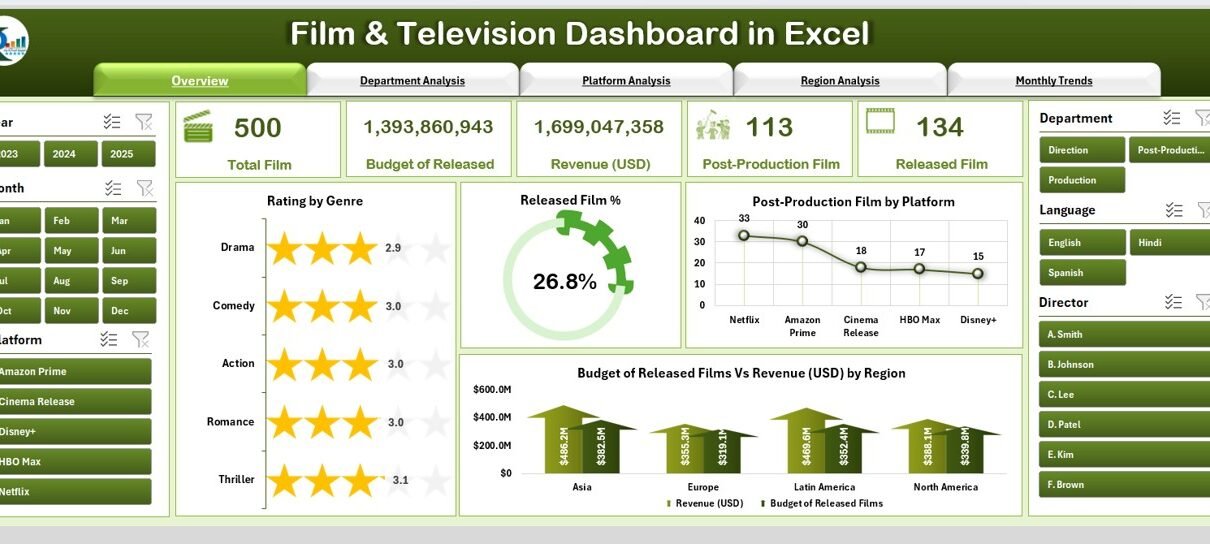
The Overview Page serves as the main dashboard hub. It provides a snapshot of overall film and television performance.
Key Highlights:
-
Right-side slicer panel: Enables users to filter data by year, region, platform, or genre.
-
Summary Cards: Displays total number of films, released films, ongoing post-production, total budget, and total revenue.
Charts Included:
- Rating by Genre: Shows which film genres have the highest audience approval.
- Released Film %: Illustrates the proportion of films successfully released vs. those still in production.
- Post-Production Film by Platform: Reveals where most post-production efforts are concentrated — for instance, Netflix vs. Disney+.
- Budget vs. Revenue by Region (USD): Compares regional spending against box-office or platform revenue, helping identify profitable markets.
This page gives executives a big-picture view of how projects are performing across the entertainment pipeline.
Department Analysis Page
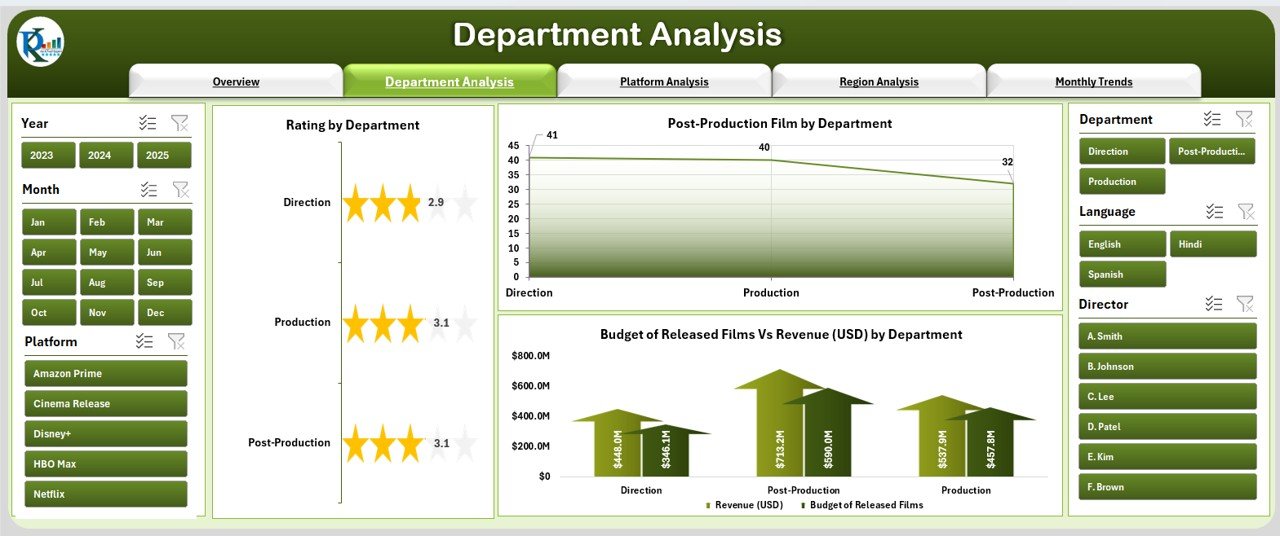
The Department Analysis page focuses on how each department contributes to success — from production and editing to marketing and distribution.
Key Highlights:
-
Right-side slicer panel: Lets you filter data for specific departments.
Charts Included:
- Rating by Department: Understand which departments’ outputs correlate with higher film ratings.
- Post-Production Film by Department: Track workloads and completion percentages in each department.
- Budget vs. Revenue by Department (USD): Evaluate financial efficiency by comparing departmental expenses to their generated outcomes.
This page helps identify strong performers and departments that may require additional resources or process improvement.
Platform Analysis Page
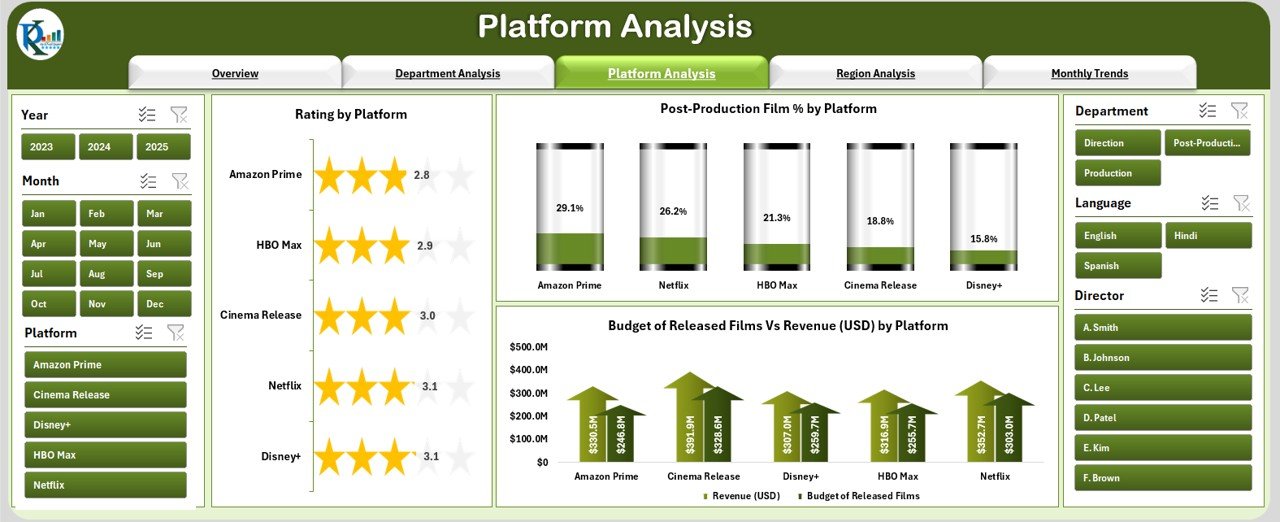
With the rise of streaming, knowing how your films perform across various platforms is essential. The Platform Analysis page helps track this performance effectively.
Key Highlights:
-
Right-side slicer panel: Enables filtering by OTT platform or network.
Charts Included:
- Rating by Platform: Measures viewer satisfaction across Netflix, Amazon Prime, Hulu, Disney+, and others.
- Post-Production Film % by Platform: Monitors how much work is currently in progress for each platform.
- Budget vs. Revenue by Platform (USD): Compares investment and return on each distribution platform.
This view is especially valuable for distribution and strategy teams who negotiate platform deals or allocate promotional budgets.
Region Analysis Page
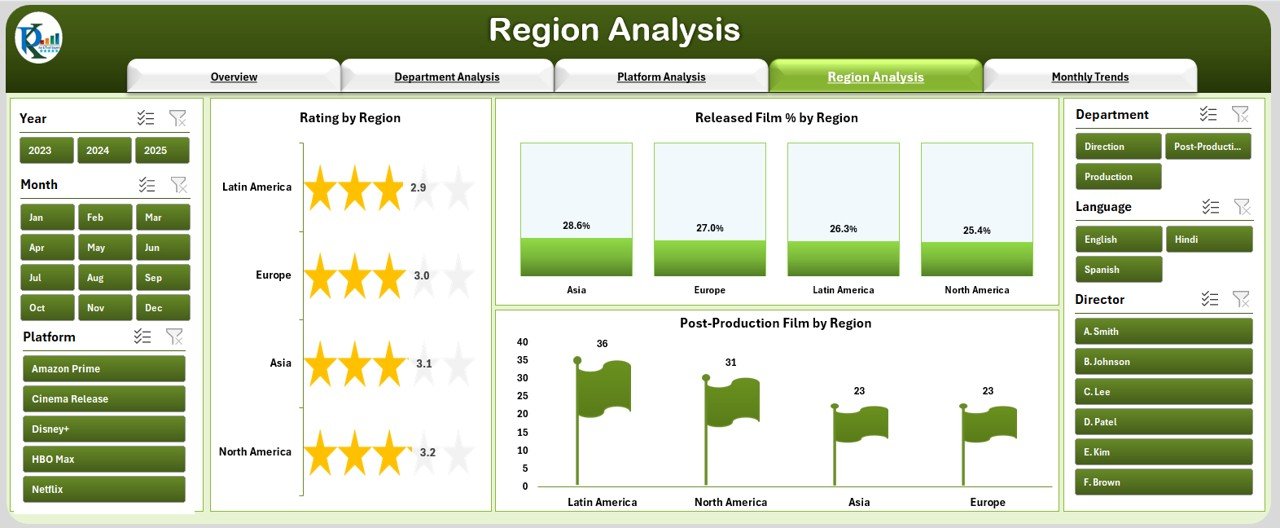
Global markets differ in audience behavior, budgets, and performance. The Region Analysis page helps analyze these geographic trends.
Key Highlights:
-
Right-side slicer panel: Filter by continent, country, or regional office.
Charts Included:
- Rating by Region: Displays regional audience ratings to highlight where content resonates best.
- Released Film % by Region: Identifies which regions have the highest film completion and release rates.
- Post-Production Film by Region: Shows the distribution of ongoing production efforts worldwide.
By comparing metrics region-wise, decision-makers can prioritize future production or marketing investments accordingly.
Monthly Trends Page
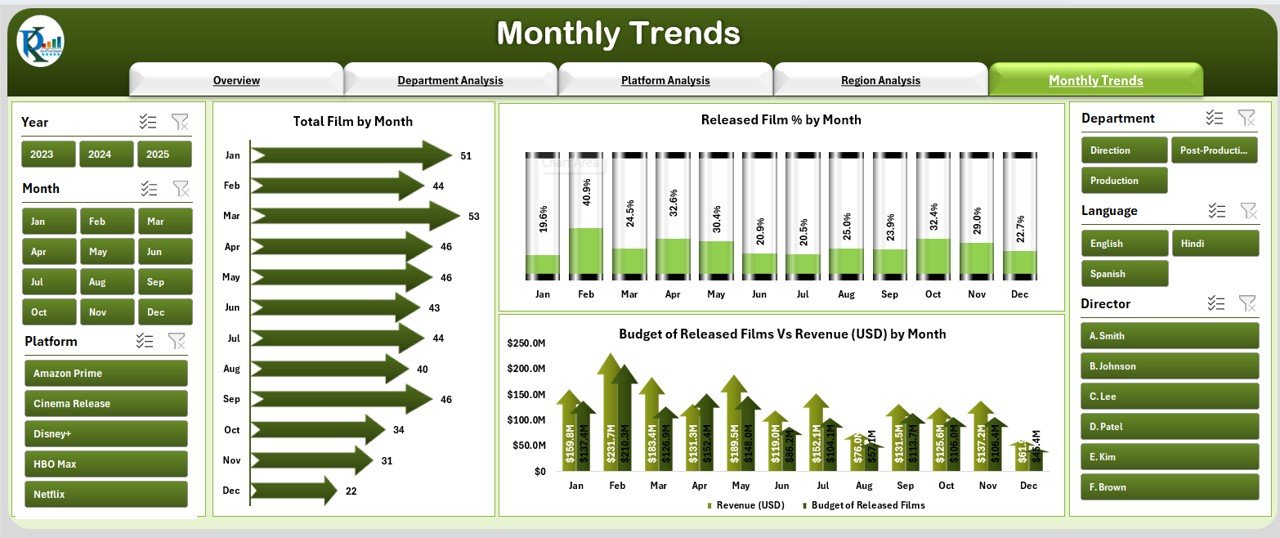
Consistency and timing are key to film success. The Monthly Trends page reveals how the industry’s activity and revenue evolve over time.
Key Highlights:
-
Right-side slicer panel: Filter data by month or quarter.
Charts Included:
- Total Film by Month: Tracks production and release volumes over time.
- Released Film % by Month: Evaluates how consistent release performance is throughout the year.
- Released Films vs. Revenue (USD) by Month: Examines whether higher release counts correlate with greater revenues.
This page gives insights into seasonality, audience trends, and budgeting cycles — essential for long-term forecasting.
Click to Purchases Film & Television Dashboard in Excel
Support Sheet
The Support Sheet serves as the foundation of the dashboard. It stores the raw data, lookup lists, and supporting calculations that power all visuals. You can easily update this sheet each time new data becomes available, ensuring the dashboard stays current.
Key Metrics Tracked in the Dashboard
This Film & Television Dashboard in Excel focuses on both creative and financial performance indicators. Some important KPIs include:
🎬 Total Number of Films and Shows
💰 Budget and Revenue by Department or Region
⭐ Average Rating by Genre, Platform, and Region
📊 Released vs. Post-Production Film Percentage
🗓️ Monthly Release Trends
🌍 Regional Revenue Contribution
🧑💼 Department Efficiency Index
📺 Platform Performance Comparison
These KPIs help users assess production efficiency, audience engagement, and financial outcomes in real time.
Benefits of Using a Film & Television Dashboard in Excel
Implementing a data dashboard transforms how production teams and executives operate. Here are some key benefits:
1. Centralized Data Management
Instead of managing separate spreadsheets for each department, this dashboard consolidates all data into a unified system, reducing duplication and confusion.
2. Improved Decision-Making
Visual summaries and charts make it easier to spot trends, patterns, and issues. Stakeholders can take immediate action based on real-time insights.
3. Time-Saving Automation
With slicers, pivot tables, and formulas, Excel automatically updates charts when new data is entered — no need for manual recalculations.
4. Enhanced Collaboration
Teams across production, finance, and distribution can access a single dashboard, improving communication and accountability.
5. Budget and Revenue Tracking
The dashboard helps monitor budget allocation and revenue generation, ensuring profitability across platforms and regions.
6. Flexibility and Customization
Unlike static reports, Excel dashboards can be customized easily — from color themes and slicer design to KPI selection.
Opportunities for Improvement
While the Film & Television Dashboard in Excel is powerful, it can be enhanced with the following improvements:
🔹 Integration with Power BI or Google Sheets: For real-time updates and cloud collaboration.
🔹 Automated Data Import: Connect Excel to data sources such as production CRMs or accounting systems.
🔹 Predictive Analytics: Add trend forecasting models for upcoming releases.
🔹 Advanced Visuals: Incorporate icons, conditional formatting, and sparkline charts for a more dynamic visual experience.
🔹 Data Validation: Strengthen input control to ensure data consistency and accuracy.
Best Practices for Using the Film & Television Dashboard in Excel
Follow these practices to maximize your dashboard’s performance and accuracy.
1. Keep Data Clean and Updated
Always update the Support Sheet regularly. Remove duplicates, correct errors, and ensure consistency in genre, region, and platform names.
2. Use Consistent Metrics
Standardize your KPIs so that everyone interprets data the same way — for example, always calculate revenue in USD and ratings on a 10-point scale.
3. Limit Manual Entry
Where possible, link the dashboard to structured data sources. This minimizes human error and saves time4. Utilize Conditional Formatting
Use icons or color codes (e.g., green for high performance, red for underperforming) to make insights easier to spot.
5. Simplify Navigation
Maintain a clean layout. The page navigator should clearly label each section for smooth movement between pages.
6. Protect Critical Formulas
Lock formulas and pivot ranges to prevent accidental editing by multiple users.
7. Back Up Regularly
Since Excel dashboards often involve large datasets, saving multiple versions ensures no data loss during updates.
Real-World Applications of the Dashboard
This dashboard is useful across multiple areas of the entertainment industry:
-
Film Studios: To track the production pipeline, post-production stages, and financial health.
-
Television Networks: To monitor ratings, schedules, and regional viewer engagement.
-
Streaming Platforms: To assess performance of original content and manage partnerships.
-
Production Houses: To plan budgets and analyze departmental efficiency.
-
Marketing Teams: To align promotional efforts with audience performance data.
The flexibility of Excel makes this dashboard adaptable for any scale — from indie production companies to major studios.
Tips to Make Your Dashboard Stand Out
Click to Purchases Film & Television Dashboard in Excel
-
Use interactive slicers for platform, genre, and region.
-
Add KPI cards with icons for instant visual appeal.
-
Include a summary section at the top of each sheet.
-
Apply consistent color themes aligned with your brand or studio style.
-
Create export buttons or macros to quickly generate reports.
These additions not only make your dashboard visually appealing but also enhance its functionality.
How to Build the Film & Television Dashboard in Excel
If you want to build it yourself, follow these steps:
-
Gather Data: Collect information on films, genres, departments, regions, and platforms.
-
Create the Support Sheet: Enter raw data and prepare tables for each category.
-
Design the Overview Page: Use pivot charts and slicers to visualize key metrics.
-
Add Navigation Buttons: Insert shapes and assign macros to switch pages easily.
-
Create Additional Pages: Replicate the structure for Department, Platform, Region, and Monthly Trends.
-
Add Conditional Formatting: Highlight key performance indicators.
-
Test and Refine: Check slicer functionality, chart responsiveness, and data accuracy.
In just a few hours, you can transform raw data into a professional dashboard ready for presentations or management review.
Conclusion
The Film & Television Dashboard in Excel is a game-changing tool for professionals in the entertainment industry. It simplifies complex datasets, turns numbers into visuals, and drives smarter decisions across every stage of production.
By integrating analytics into day-to-day management, studios and streaming platforms can monitor progress, improve coordination, and boost profitability. Whether you’re a filmmaker, producer, or analyst, this dashboard gives you the clarity and control you need to thrive in the dynamic world of entertainment.
Frequently Asked Questions (FAQs)
1. What is a Film & Television Dashboard in Excel?
It’s a visual management tool that consolidates key film and TV data — such as ratings, budgets, and revenues — into an interactive Excel dashboard.
2. Who can use this dashboard?
Producers, production managers, marketing teams, financial analysts, and streaming executives can all use it to track and analyze entertainment data.
3. Can I customize the dashboard?
Yes. You can easily modify charts, colors, KPIs, and slicers to match your specific needs or studio branding.
4. How often should I update the dashboard?
Ideally, update it weekly or monthly, depending on your production schedule and reporting frequency.
5. Does this dashboard require advanced Excel skills?
Not necessarily. Basic knowledge of pivot tables, charts, and slicers is enough to maintain and customize it.
6. Can I connect it with live data sources?
Yes. You can link Excel with databases or Power Query to automate data imports from production systems or financial records.
7. What’s the best way to share the dashboard with others?
You can export it as a PDF, share via OneDrive, or publish it on a shared network for real-time collaboration.
8. How does this dashboard improve project management?
It helps monitor every aspect of production — from departmental performance to platform revenue — enabling timely decisions and better planning.
Visit our YouTube channel to learn step-by-step video tutorials