In the fast-paced world of healthcare manufacturing, precision, quality, and efficiency are vital. Every piece of medical equipment produced directly impacts patient care, hospital operations, and public safety. Therefore, manufacturers in this industry must consistently monitor production, quality, cost, and delivery performance.
To achieve this, many organizations now rely on KPI (Key Performance Indicator) Dashboards in Excel — a simple yet powerful way to track performance across all departments. The Medical Equipment Manufacturing KPI Dashboard in Excel provides a data-driven approach to managing manufacturing operations efficiently, reducing waste, and improving overall product quality.
This article explores how the dashboard works, its key features, advantages, and best practices for effective implementation. You’ll also find answers to frequently asked questions at the end.
Click to Purchases Medical Equipment Manufacturing KPI Dashboard in Excel
🧩 What Is a Medical Equipment Manufacturing KPI Dashboard in Excel?
A Medical Equipment Manufacturing KPI Dashboard in Excel is a dynamic reporting tool that helps manufacturers measure, visualize, and analyze key performance indicators related to production, quality, costs, and compliance.
It consolidates data from various stages of the manufacturing process — from raw material sourcing to product inspection — into a centralized, easy-to-use Excel workbook. Users can monitor Month-to-Date (MTD) and Year-to-Date (YTD) performance, compare Actual vs Target values, and analyze historical trends.
Unlike complicated ERP systems, this Excel-based dashboard is lightweight, flexible, and perfect for small to mid-sized manufacturers aiming to build a culture of continuous improvement.
⚙️ Key Features of the Medical Equipment Manufacturing KPI Dashboard
This dashboard template includes seven well-organized worksheets, each designed for specific functionality. Let’s look at how each sheet contributes to performance management.
1️⃣ Home Sheet
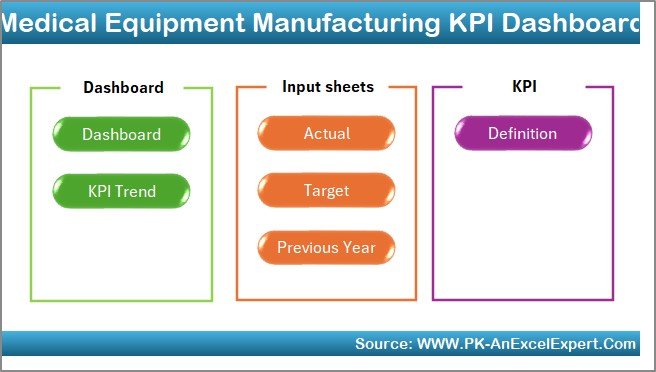
The Home Sheet serves as the central navigation hub. It provides quick access to all key sections of the dashboard through clickable buttons.
Key Highlights:
-
Interactive Buttons: Navigate to the Dashboard, Trend, Target, Input, or Definition sheets instantly.
-
Clean Layout: Easy-to-read design for new and experienced users alike.
-
Brand Customization: You can include your company logo and modify colors for a professional look.
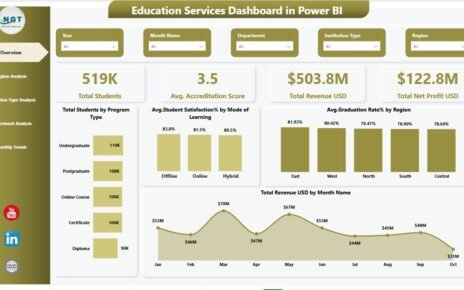
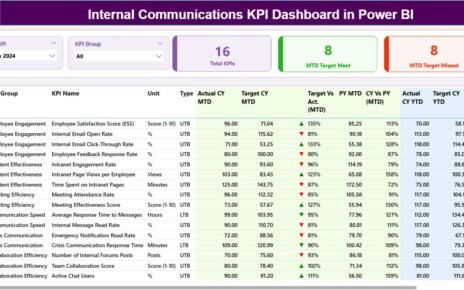
2️⃣ Dashboard Sheet
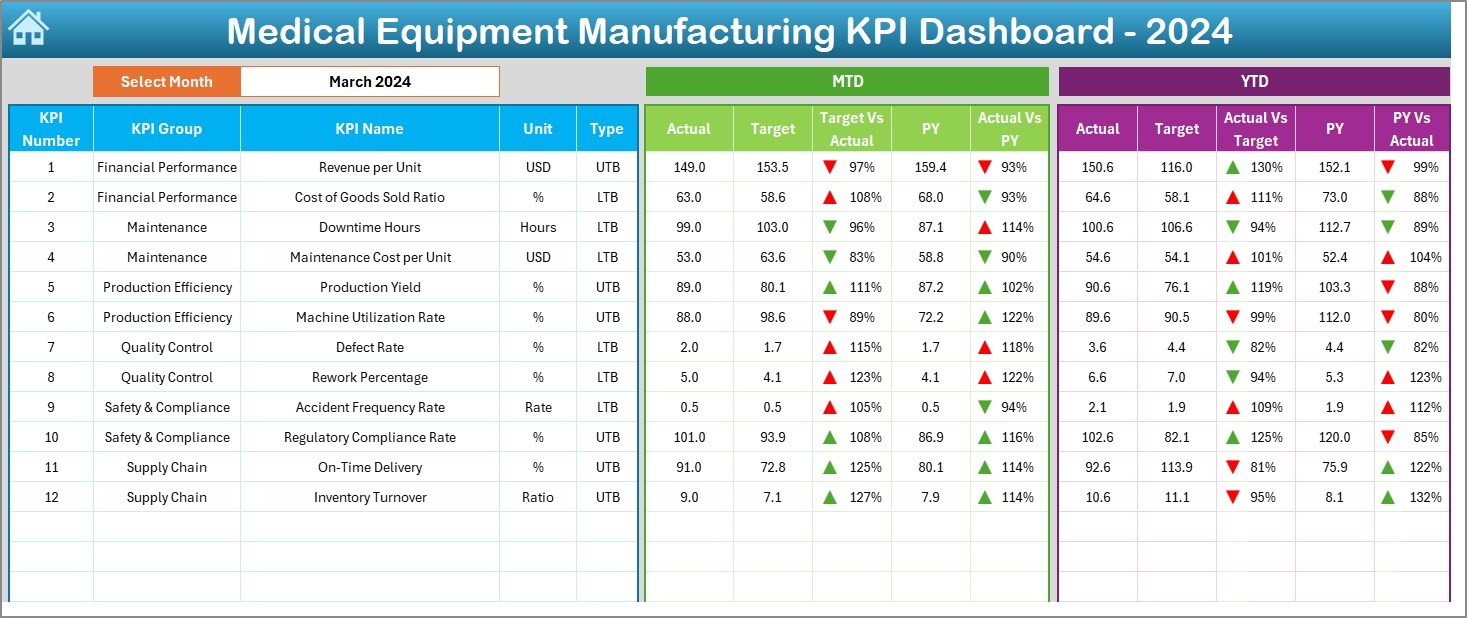
This is the heart of the template. It provides an interactive visual representation of your organization’s KPIs.
Core Features:
-
Month Selector (Cell D3): Choose the reporting month to view dynamic updates across the dashboard.
-
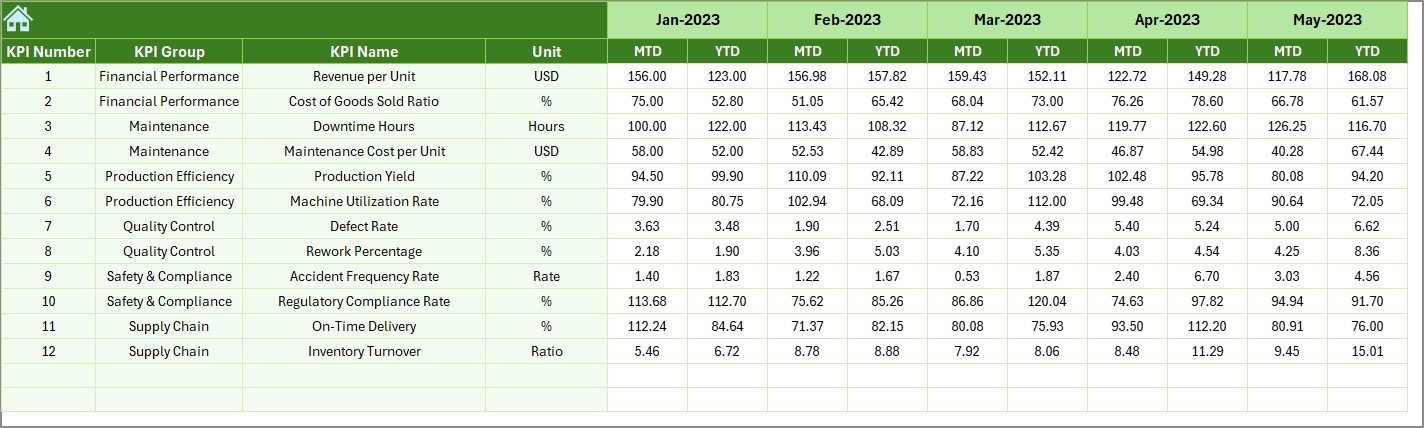
MTD and YTD Data: Displays both month-to-date and year-to-date actual, target, and previous-year values.
-
Conditional Formatting: Up and down arrows indicate performance trends (↑ improvement, ↓ decline).
-
KPI Comparison: View differences between Target vs Actual and PY vs Actual values.
With this sheet, you get a high-level snapshot of overall manufacturing performance, helping managers act quickly when issues arise.
3️⃣ KPI Trend Sheet
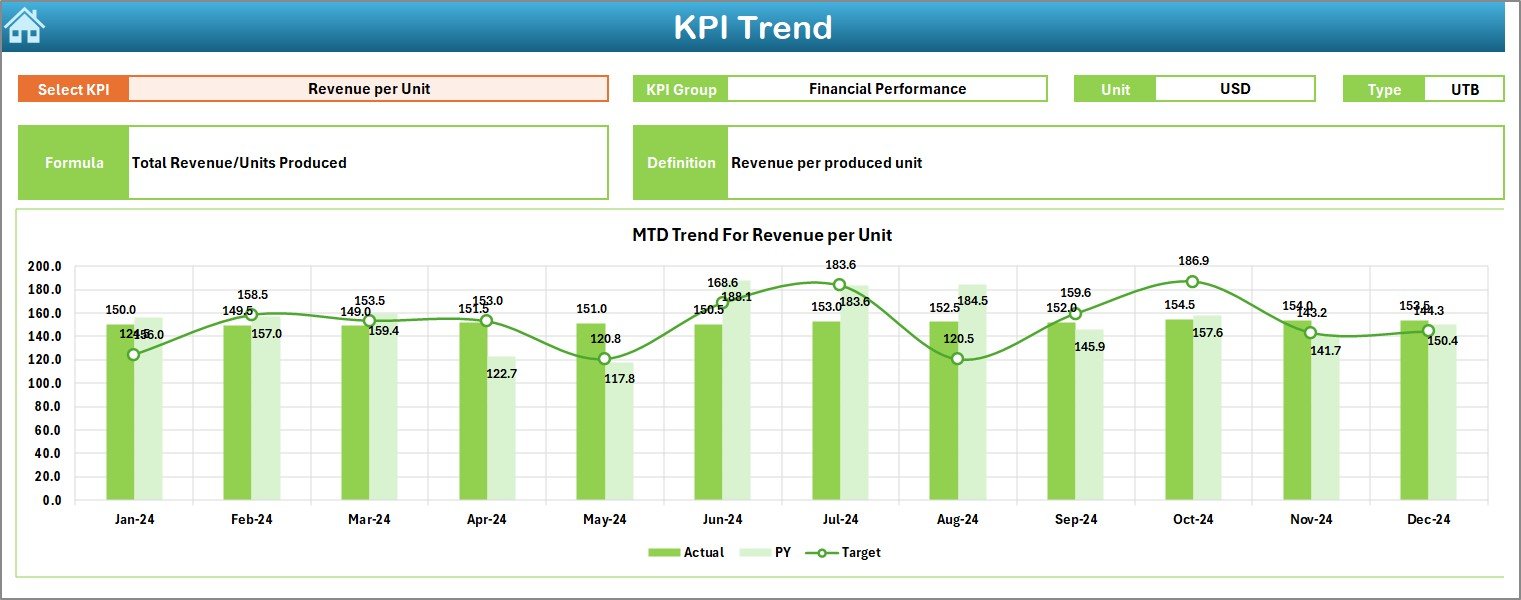
The KPI Trend Sheet provides detailed insights into each performance metric over time.
Features Include:
-
Dropdown for KPI Selection (Cell C3): Choose a specific KPI to analyze.
-
Details Displayed: KPI Group, Unit of Measure, Type (Lower the Better or Upper the Better), Formula, and Definition.
-
Trend Charts: Graphs for MTD and YTD values — Actual, Target, and Previous Year — displayed side by side for easy comparison.
This sheet enables deeper analysis, helping you spot production delays, quality issues, or cost variances early.
4️⃣ Actual Numbers Input Sheet
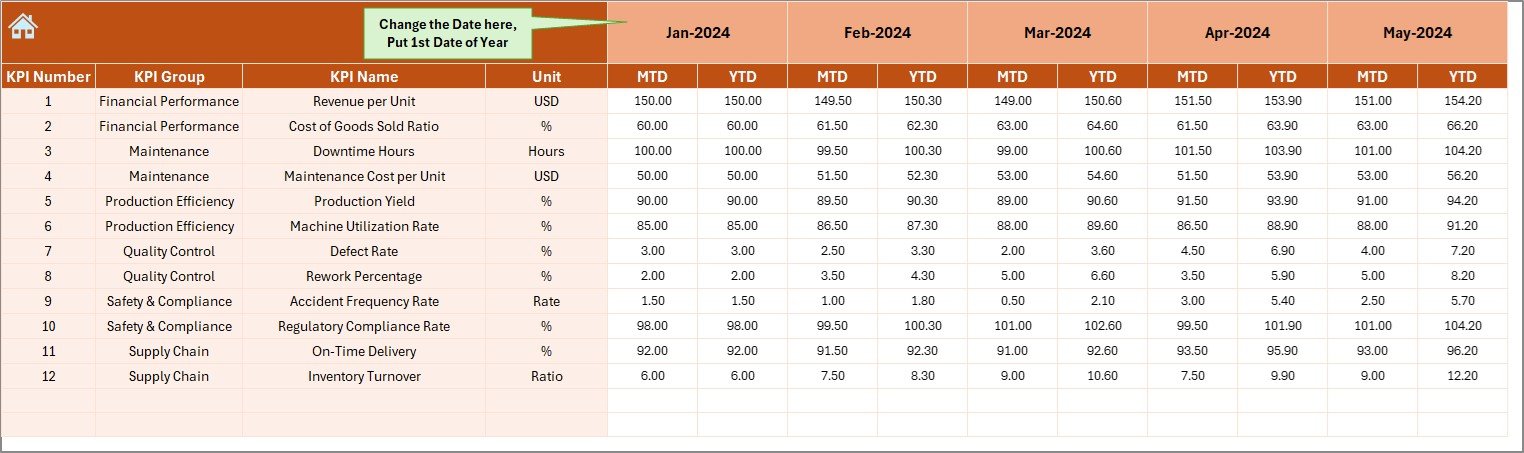
This sheet is designed for data entry and management of actual performance values.
How It Works:
-
Monthly Input: Enter MTD and YTD actual numbers for each KPI.
-
Auto-Update: The dashboard automatically reflects changes once new data is entered.
-
Month Selector (Cell E1): Choose the first month of the financial year to ensure proper data alignment.
It simplifies the data input process, ensuring you always have up-to-date information for reporting and analysis.
5️⃣ Target Sheet
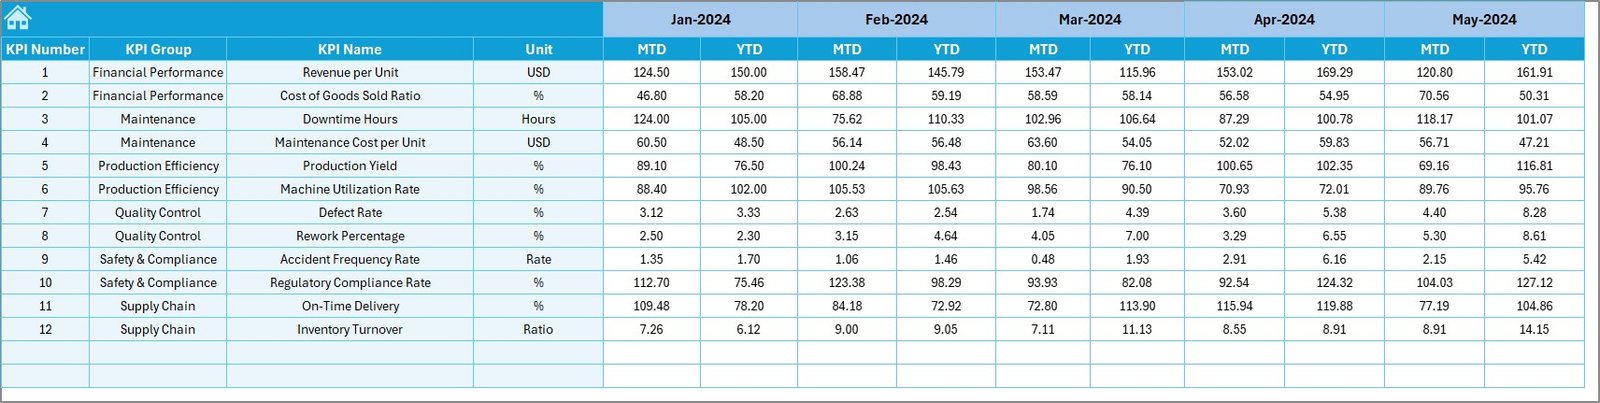
The Target Sheet defines the performance goals for each KPI.
Features:
-
Monthly Target Setup: Enter targets for each KPI for every month.
-
Dual Columns: Include both MTD and YTD targets for detailed tracking.
-
Performance Benchmarking: Compare actuals with targets directly on the dashboard to evaluate progress.
By setting realistic and measurable targets, you ensure that performance evaluation remains objective.
6️⃣ Previous Year Numbers Sheet
This sheet holds data from the previous year’s performance, enabling historical comparison.
Key Benefits:
-
Year-over-Year Analysis: See how current performance stacks up against last year.
-
Data Continuity: Helps maintain context for long-term performance improvements.
-
Strategic Planning: Identifies trends and supports forecasting for future periods.
7️⃣ KPI Definition Sheet
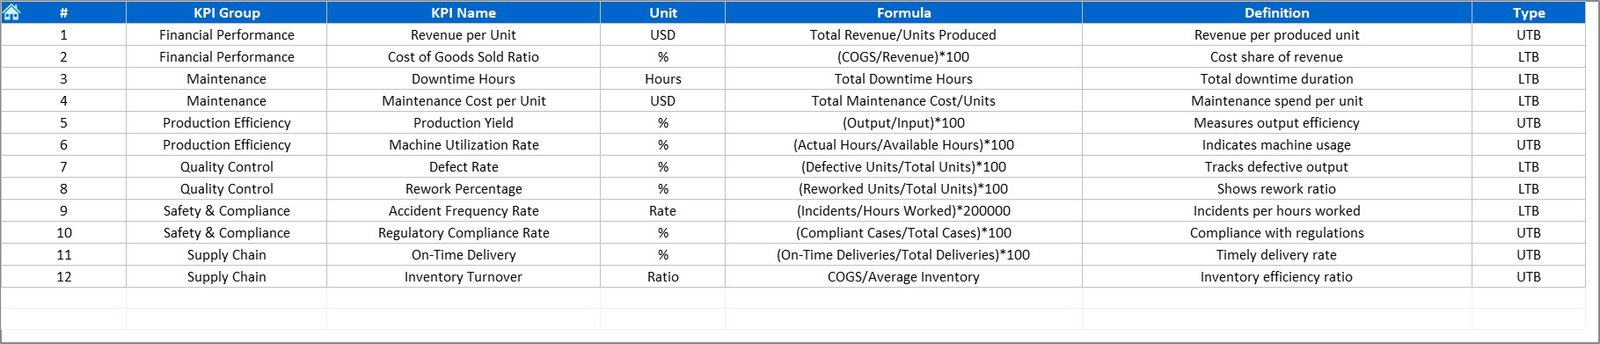
This sheet functions as a reference guide for all KPIs tracked in the dashboard.
Included Columns:
-
KPI Name
-
KPI Group
-
Unit of Measure
-
Formula
-
KPI Definition
Having this documentation ensures every team member interprets each metric correctly and maintains reporting consistency.
Click to Purchases Medical Equipment Manufacturing KPI Dashboard in Excel
🧠 Importance of KPI Dashboards in Medical Equipment Manufacturing
The medical equipment industry operates under strict regulations and demands high precision. A small production error can affect thousands of patients. Thus, tracking KPIs is not optional — it’s essential.
Here’s why this dashboard is so valuable:
-
Regulatory Compliance: Monitor metrics like defect rates and calibration timelines to meet industry standards.
-
Process Control: Identify inefficiencies early and take corrective action.
-
Quality Assurance: Ensure every product meets performance and safety specifications.
-
Cost Optimization: Detect waste in materials, labor, or energy usage.
-
Decision Support: Use real-time insights for production planning and resource allocation.
📊 Common KPIs for Medical Equipment Manufacturing
To make your dashboard comprehensive, include KPIs that reflect key aspects of production, quality, and operations.
1. Production Performance
-
Equipment Output (Units)
-
Production Downtime (Hours)
-
Yield Rate (%)
-
On-Time Delivery (%)
-
Capacity Utilization (%)
2. Quality Control
-
Defect Rate (%)
-
Rework Percentage (%)
-
Inspection Pass Rate (%)
-
Warranty Returns (%)
-
Compliance Audit Score (%)
3. Cost & Efficiency
-
Cost per Unit (USD)
-
Material Waste (%)
-
Energy Consumption (kWh)
-
Maintenance Cost (% of Revenue)
4. Supply Chain & Delivery
-
Supplier On-Time Performance (%)
-
Lead Time (Days)
-
Inventory Turnover Ratio
5. Safety & Compliance
-
Number of Safety Incidents
-
Equipment Calibration Compliance (%)
-
Employee Training Completion Rate (%)
These KPIs together give a 360° view of manufacturing performance.
🩺 How to Use the Medical Equipment Manufacturing KPI Dashboard in Excel
Follow these simple steps to get the best out of your dashboard:
-
Define KPIs: Start by finalizing KPIs relevant to your organization’s objectives.
-
Enter Data: Input Actual, Target, and Previous Year values in their respective sheets.
-
Select Month: Choose a month in the Dashboard tab to view real-time results.
-
Analyze Trends: Review the KPI Trend sheet for deeper insights into performance changes.
-
Take Action: Identify problem areas and make data-driven decisions to improve results.
-
Review Monthly: Update your dashboard at the end of each month for accurate YTD reporting.
⚡ Advantages of the Medical Equipment Manufacturing KPI Dashboard
✅ 1. Real-Time Monitoring
View your KPIs instantly and track progress month by month.
✅ 2. Data Accuracy
Automated formulas minimize human error, ensuring accurate insights.
✅ 3. Cost-Effective
Excel requires no extra software investment, making it perfect for small to medium manufacturers.
✅ 4. User-Friendly
The dashboard’s clean layout and dropdown filters make navigation simple.
✅ 5. Actionable Insights
Color-coded indicators show performance gaps, helping prioritize corrective actions.
✅ 6. Scalability
Add new KPIs or data columns as your business grows — the template adapts easily.
🚀 Opportunities for Improvement
While the Excel dashboard provides a solid foundation, you can enhance it further by:
-
⚙️ Integrating with IoT Data: Automate real-time machine data updates.
-
📈 Adding VBA Automation: Refresh dashboards and charts automatically.
-
💡 Connecting to Power BI: For advanced visualization and data storytelling.
-
🧩 Implementing Data Validation: Prevent incorrect entries during manual data input.
-
🌍 Cloud Collaboration: Use OneDrive or SharePoint for team-wide access and version control.
🧰 Best Practices for Using the Dashboard
To ensure consistent performance monitoring, follow these best practices:
🩺 1. Set Realistic Targets
Use historical data to define achievable monthly and yearly goals.
🩺 2. Standardize KPIs
Ensure all departments use the same calculation methods and definitions.
🩺 3. Update Data Regularly
Keep your data current to maintain reliable analytics.
🩺 4. Leverage Visual Indicators
Highlight high-risk areas using red/yellow/green conditional formatting.
🩺 5. Ensure Data Security
Protect sensitive manufacturing data with Excel’s password and access control features.
🩺 6. Conduct Monthly Reviews
Analyze trends during team meetings and assign corrective actions.
🩺 7. Document KPI Changes
Whenever a KPI formula or target changes, update the Definition Sheet for transparency.
🧪 Example: Using the Dashboard in Action
Imagine a medical equipment company manufacturing surgical tools.
In Q1, the dashboard shows that Production Downtime increased by 18%, while the On-Time Delivery rate dropped by 7%.
By reviewing the KPI Trend Sheet, managers discover that two machines required frequent maintenance, leading to the downtime spike.
After scheduling preventive maintenance and staff training, the next quarter’s data shows a 25% reduction in downtime and improved delivery rates.
This real-world example demonstrates how the dashboard drives timely, data-based decisions.
Click to Purchases Medical Equipment Manufacturing KPI Dashboard in Excel
🏁 Conclusion
The Medical Equipment Manufacturing KPI Dashboard in Excel is a game-changer for performance management in the healthcare manufacturing industry. It transforms raw production data into visual insights, enabling manufacturers to monitor quality, compliance, and efficiency in real time.
Whether you’re a production manager, quality controller, or operations head, this dashboard helps you track the right metrics, identify inefficiencies, and maintain excellence in every process.
By combining simplicity, flexibility, and precision, this Excel-based dashboard gives your business the competitive edge it needs in today’s regulated manufacturing environment.
💬 Frequently Asked Questions (FAQs)
1. What is a KPI dashboard in manufacturing?
It’s a visual reporting tool that tracks and compares key performance metrics such as quality, production, and efficiency.
2. Why is it important for medical equipment manufacturing?
It ensures compliance, reduces defects, and improves operational efficiency in a highly regulated industry.
3. Can I customize this Excel dashboard?
Yes. You can modify KPIs, formulas, charts, and color schemes to match your company’s needs.
4. How often should I update the dashboard?
Update it monthly or weekly depending on your production cycle.
5. Does it support multi-year data?
Yes. You can add additional sheets or expand columns for multi-year comparisons.
6. Can small manufacturers use this dashboard?
Absolutely. It’s simple, affordable, and scalable for all business sizes.
7. Is Excel secure for KPI tracking?
Yes. You can password-protect sheets and control access permissions.
8. What types of charts are best for KPIs?
Bar charts, line graphs, and conditional icons are effective for manufacturing metrics.
9. Can this dashboard integrate with ERP systems?
Yes, you can link Excel with ERP exports or APIs for automatic data updates.
10. What are the top KPIs for medical manufacturing?
Defect Rate, Yield %, On-Time Delivery, Downtime, and Cost per Unit are key metrics to monitor.
Click to Purchases Medical Equipment Manufacturing KPI Dashboard in Excel
Visit our YouTube channel to learn step-by-step video tutorials