In today’s digital economy, blockchain technology and cryptocurrency have transformed the way people trade, invest, and store value. Yet, tracking crypto performance, wallet balances, and blockchain transactions can be challenging without a structured system. To solve this, the Blockchain & Cryptocurrency Dashboard in Excel provides an all-in-one analytical solution for crypto professionals, traders, and enthusiasts.
This dynamic Excel-based dashboard brings together critical blockchain and cryptocurrency data into interactive visuals, simplifying performance monitoring and decision-making. Whether you manage multiple crypto wallets, analyze blockchain networks, or track transaction trends, this dashboard helps you visualize it all in a single file.
Blockchain & Cryptocurrency Dashboard in Excel
What Is a Blockchain & Cryptocurrency Dashboard in Excel?
A Blockchain & Cryptocurrency Dashboard in Excel is a data-driven analytical tool designed to track cryptocurrency transactions, wallet balances, blockchain network activity, and trading performance. It consolidates data from different crypto sources into a clean, interactive Excel interface — allowing you to make informed financial and operational decisions.
This dashboard helps you answer essential questions like:
-
How much value is held across wallets?
-
Which blockchain network performs best?
-
What percentage of transactions are completed successfully?
-
How do profits and losses trend by transaction type or region?
Unlike complex crypto analytics software, this Excel dashboard is fully customizable, offline-friendly, and easy to use — ideal for both beginners and professionals.
Key Features of the Blockchain & Cryptocurrency Dashboard
The Blockchain & Cryptocurrency Dashboard in Excel has five main pages and two support sheets, all connected through a smooth navigation panel for effortless movement between insights.
🔹 Page Navigator
Located on the left-hand side, the Page Navigator allows users to switch between the five analytical pages with a single click. This saves time and enhances the user experience by offering quick access to the Overview, Department, Blockchain Network, Transaction Type, and Monthly Trends pages.
1. Overview Page – The Command Center
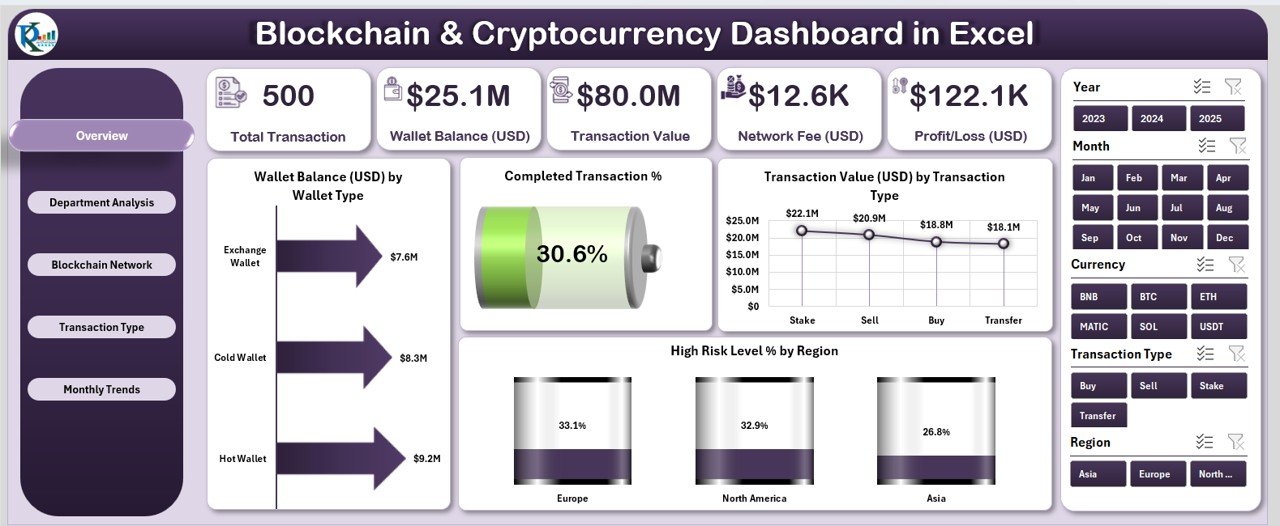
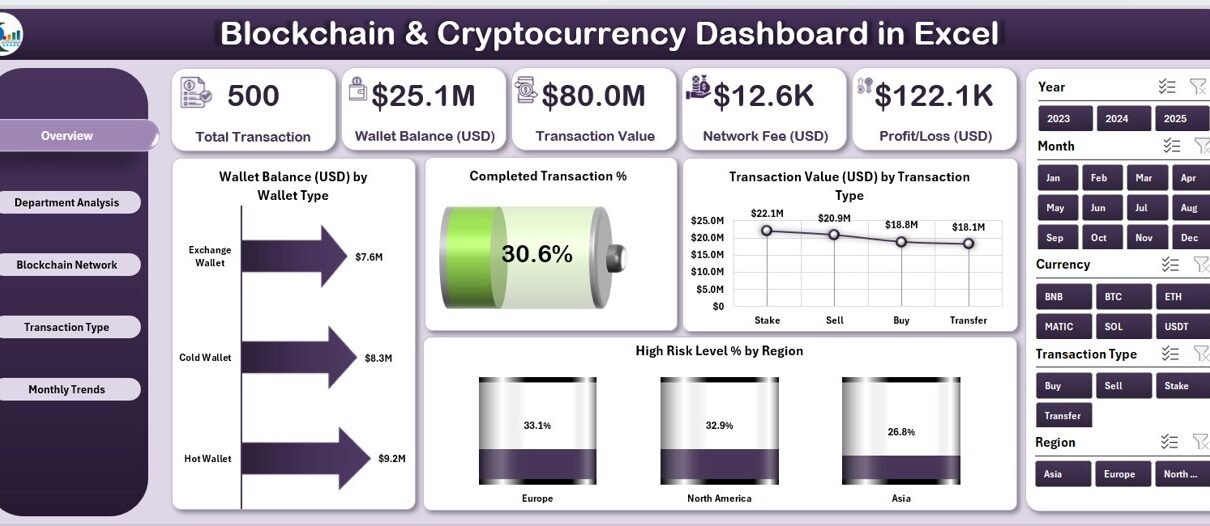
The Overview Page serves as the central hub of the dashboard. It provides a comprehensive summary of blockchain and cryptocurrency activities through intuitive visuals and KPIs.
Key Highlights:
-
Five Analytical Cards — Display key figures such as Total Wallet Balance, Number of Completed Transactions, Average Transaction Value, Network Fees, and Profit/Loss.
-
Slicer on the Right Side — Enables users to filter data by period, region, or wallet type.
Charts and Graphs:
- Wallet Balance (USD) by Wallet Type – Compares balances across hot wallets, cold wallets, and exchange accounts.
- Completed Transaction % – Shows the ratio of successful to failed transactions.
- Transaction Value (USD) by Transaction Type – Displays total value categorized by purchase, transfer, or staking transactions.
- High-Risk Level % by Region – Identifies geographical areas with higher transaction risk exposure.
This page gives a 360° view of performance metrics for quick and informed decision-making.
2. Department Analysis – Understanding Internal Performance
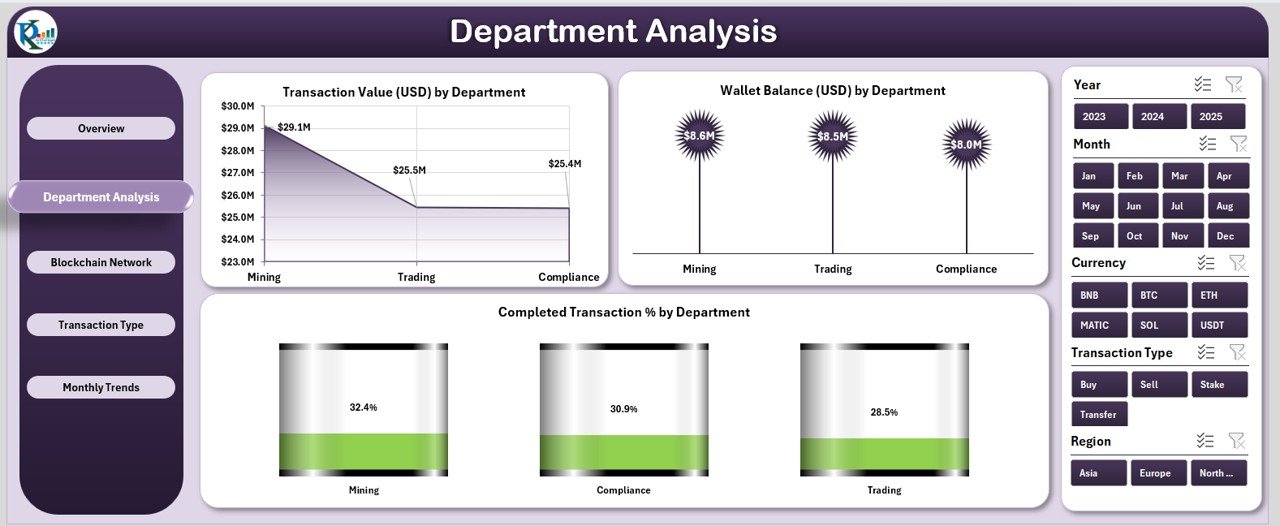
The Department Analysis page provides an in-depth view of how different business units or teams handle blockchain transactions and wallet activities. For organizations managing crypto assets across multiple departments, this analysis is vital.
Key Highlights:
-
Right-Side Slicer – Filters data by department name or transaction type.
Charts Included:
- Transaction Value (USD) by Department – Evaluates how much each department contributes to total transaction value.
- Wallet Balance (USD) by Department – Compares asset holdings across internal teams.
- Completed Transaction % by Department – Tracks operational efficiency across departments.
This section helps management identify high-performing teams and departments needing operational improvement.
3. Blockchain Network Analysis – Evaluating Network Efficiency
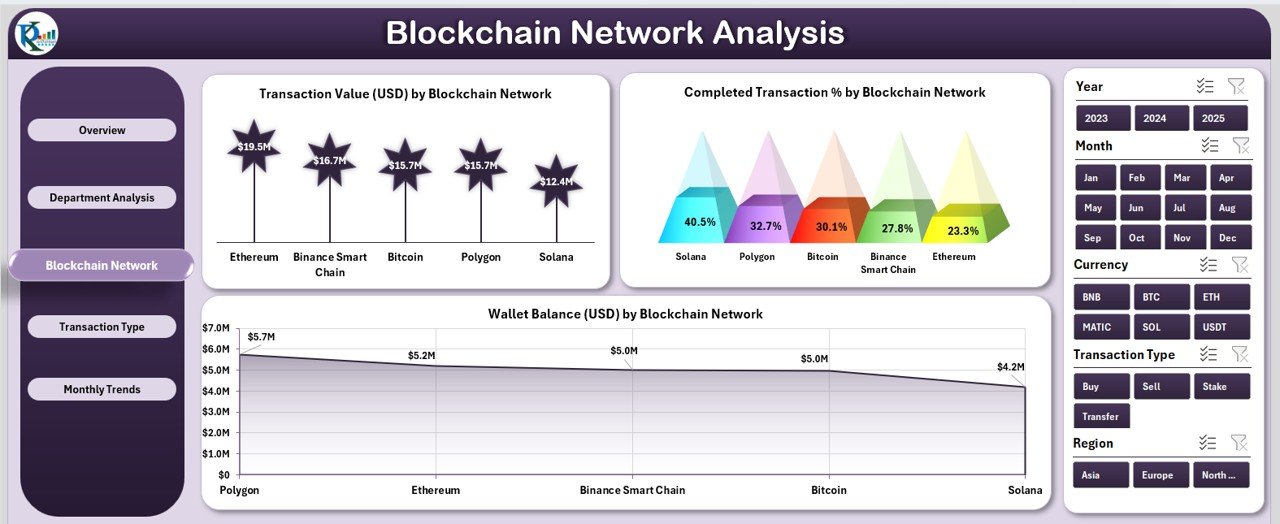
The Blockchain Network Analysis page focuses on comparing various blockchain networks such as Bitcoin, Ethereum, Solana, or Binance Smart Chain.
Key Highlights:
-
Right-Side Slicer – Enables users to choose specific blockchain networks for targeted analysis.
Charts Included:
- Days to Transaction Value (USD) by Blockchain Network – Highlights how transaction value changes over time across networks.
- Wallet Balance (USD) by Blockchain Network – Displays distribution of funds among different blockchains.
- Completed Transaction % by Blockchain Network – Evaluates reliability and completion rate of transactions per network.
By using this page, investors can identify the most efficient, cost-effective, and secure networks to allocate their assets.
4. Transaction Type Analysis – Analyzing Profitability and Performance
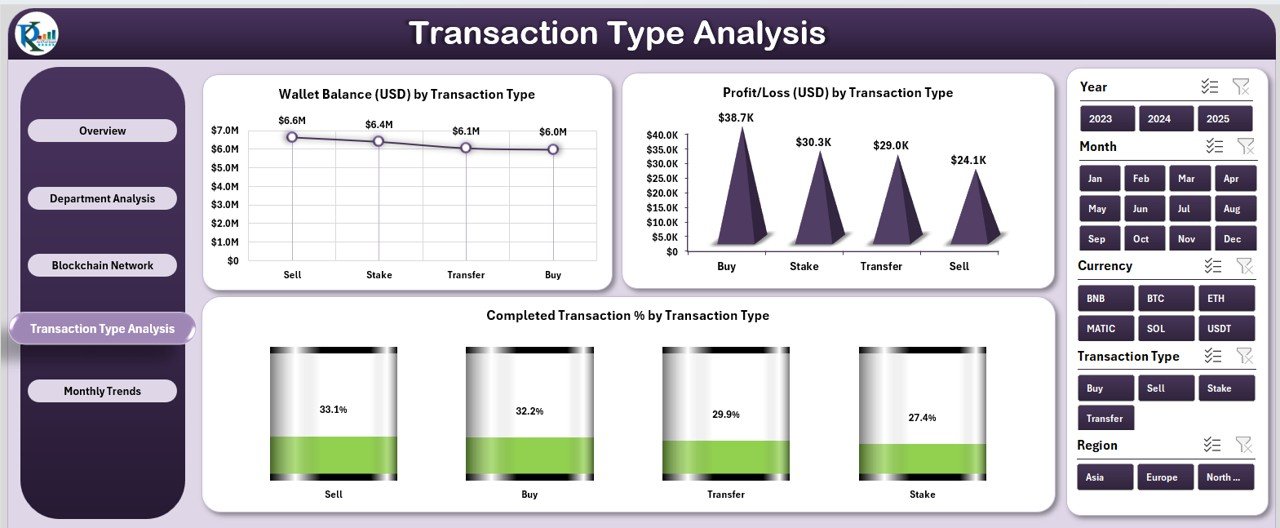
The Transaction Type Analysis page examines different transaction categories like buying, selling, transferring, staking, or lending.
Key Highlights:
-
Right-Side Slicer – Allows selection of specific transaction types.
Charts Included:
- Wallet Balance (USD) by Transaction Type – Analyzes how wallet balances vary across transaction categories.
- Completed Transaction % by Transaction Type – Tracks execution efficiency by transaction purpose.
- Profit/Loss (USD) by Transaction Type – Evaluates which activities generate the most profit or incur the highest losses.
This page is essential for financial analysts who want to optimize transaction strategies and improve profitability.
5. Monthly Trends – Tracking Performance Over Time
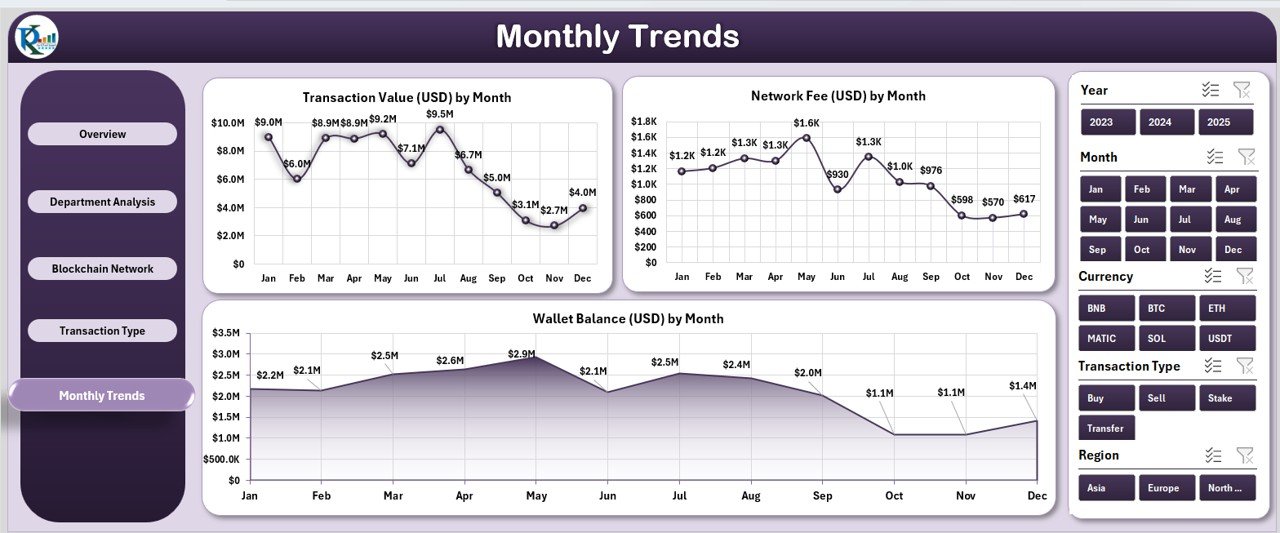
The Monthly Trends page visualizes how blockchain and cryptocurrency metrics evolve throughout the year.
Key Highlights:
-
Right-Side Slicer – Enables selection of months or quarters.
Charts Included:
- Transaction Value (USD) by Month – Shows how transaction volume changes each month.
- Network Fee (USD) by Month – Tracks the cost trend associated with blockchain transactions.
- Wallet Balance (USD) by Month – Visualizes total wallet value fluctuations over time.
This view helps users identify seasonal patterns, spot growth opportunities, and monitor performance trends.
Blockchain & Cryptocurrency Dashboard in Excel
Supporting Sheets
1. Data Sheet
The Data Sheet stores all raw data powering the visuals. Users can easily update this section with their own data to refresh the entire dashboard automatically.
2. Support Sheet
The Support Sheet maintains reference values, lists, and formulas used in drop-down menus, slicers, and calculations. It ensures that the dashboard runs smoothly and stays dynamic.
Why Use Excel for Blockchain & Cryptocurrency Tracking?
Although specialized crypto tracking tools exist, Excel offers unmatched flexibility and simplicity. Here’s why Excel remains a preferred platform for blockchain analytics:
✅ Offline Accessibility: No internet dependency; you can work securely offline.
✅ Customization: Tailor charts, colors, and formulas as per your unique crypto portfolio.
✅ Data Privacy: Sensitive wallet data stays under your control.
✅ Integration: Import data from exchanges or APIs and analyze directly.
✅ Cost-Effective: Eliminates the need for expensive analytics platforms.
With Excel, you can turn complex blockchain data into actionable insights with minimal effort.
Advantages of the Blockchain & Cryptocurrency Dashboard in Excel
The benefits of this Excel-based dashboard extend across professional and personal crypto use cases.
🌟 1. Real-Time Decision Support
View transaction trends, wallet balances, and network performance in real time to make smarter investment decisions.
🌟 2. Centralized Data Visibility
Get a unified view of all blockchain and cryptocurrency activities in one file instead of using multiple tools.
🌟 3. Simplified Analysis
Interactive slicers and pivot charts make data exploration fast and intuitive, even for non-technical users.
🌟 4. Improved Accuracy
The dashboard minimizes manual errors and provides consistent data calculations through automated formulas.
🌟 5. Strategic Planning
Use the insights to allocate resources, identify profitable transaction types, and plan investment strategies.
🌟 6. Performance Monitoring
Track how efficiently transactions are executed across networks and departments, helping to spot issues early.
How to Use the Blockchain & Cryptocurrency Dashboard
Using the dashboard is straightforward and intuitive:
-
Open the Excel File – Start with the Home page and explore the navigation menu.
-
Input or Import Data – Update your wallet balances, transaction records, or blockchain metrics in the Data Sheet.
-
Navigate Between Pages – Use the Page Navigator to move across Overview, Department Analysis, Network Analysis, Transaction Type, and Monthly Trends.
-
Use Slicers and Filters – Apply filters to view specific periods, transaction types, or regions.
-
Review Charts and KPIs – Analyze insights through dynamic visuals and performance metrics.
The dashboard automatically updates visuals as you modify or add new data.
Who Can Use This Dashboard?
The Blockchain & Cryptocurrency Dashboard in Excel suits a wide range of users, including:
🧑💼 Finance Analysts: Track crypto profitability and network efficiency.
💼 Businesses: Manage blockchain-based transactions and departmental performance.
👨💻 Developers: Monitor blockchain network reliability.
💰 Investors and Traders: Track wallet balances, profit/loss, and transaction fees.
🏦 Auditors: Review transaction records and compliance performance.
Its adaptability makes it an excellent tool for both individuals and organizations.
Blockchain & Cryptocurrency Dashboard in Excel
Best Practices for Using the Blockchain & Cryptocurrency Dashboard
To maximize the effectiveness of your dashboard, follow these best practices:
✅ 1. Keep Data Updated
Regularly refresh the Data Sheet to ensure your dashboard displays accurate and up-to-date metrics.
✅ 2. Use Consistent Naming
Maintain consistent wallet names, transaction types, and blockchain network labels for better clarity.
✅ 3. Validate Data Sources
Ensure that your input data (especially from APIs or exchanges) is accurate and verified.
✅ 4. Secure Your Workbook
Protect sensitive crypto data by locking sheets or enabling password protection in Excel.
✅ 5. Automate with Macros
Add simple VBA scripts to automate data refresh or generate PDF summaries.
✅ 6. Backup Regularly
Save backup copies of your Excel dashboard to avoid data loss.
✅ 7. Customize Visuals
Modify charts, KPIs, or slicer layouts to fit your analysis needs and presentation style.
Tips for Creating Powerful Crypto Dashboards in Excel
Here are a few additional recommendations to make your Excel dashboards more insightful and user-friendly:
-
Use Conditional Formatting to highlight key performance deviations.
-
Implement Dynamic Ranges for automated chart updates.
-
Create Pivot Tables for detailed drill-downs.
-
Add Color-Coded KPIs to emphasize success metrics.
-
Include Comparison Columns (Target vs Actual, MTD vs YTD, etc.) for contextual insights.
These techniques will help you transform your Excel file into a professional analytics solution.
Conclusion
The Blockchain & Cryptocurrency Dashboard in Excel is a powerful, versatile, and cost-effective way to track and analyze blockchain data, wallet balances, and transaction trends. It brings clarity, transparency, and efficiency to cryptocurrency management — without the need for advanced software or coding.
By consolidating multiple perspectives (department, network, transaction type, and monthly trends), this dashboard empowers users to make data-driven decisions with confidence. Whether you’re an investor, auditor, or analyst, this Excel dashboard can be your digital compass for navigating the complex world of blockchain analytics.
Frequently Asked Questions (FAQs)
1. Can I use this dashboard for multiple cryptocurrencies?
Yes. You can include multiple cryptocurrencies such as Bitcoin, Ethereum, Litecoin, or others by updating the Data Sheet.
2. Does this dashboard support live data import?
While the base version works on static data, you can integrate APIs or Power Query to automate live data refresh.
3. Is this dashboard suitable for beginners?
Absolutely. The dashboard has a user-friendly interface and clear visuals, making it perfect even for Excel beginners.
4. How can I analyze profit and loss using this dashboard?
You can view the “Profit/Loss by Transaction Type” chart in the Transaction Type Analysis page to track profitability over time.
5. Can this dashboard be shared with team members?
Yes. You can easily share the Excel file through OneDrive or email while maintaining access control.
6. What Excel versions support this dashboard?
It works best in Microsoft Excel 2016 or later (Windows and Mac versions).
7. How do I customize the dashboard for my organization?
You can change chart labels, color themes, slicers, and data categories from the Support Sheet or Excel design options.
8. Is my cryptocurrency data safe in this dashboard?
Yes. Since it’s an offline Excel file, your sensitive data stays secure on your local system.
Visit our YouTube channel to learn step-by-step video tutorials