Managing a supply chain is no easy task. Businesses deal with multiple suppliers, product categories, warehouse locations, and delivery timelines. Keeping track of performance across all these dimensions requires a clear, visual, and data-driven approach. That’s where the Supply Chain Management Dashboard in Power BI comes in — a powerful analytical tool that transforms complex supply chain data into actionable insights.
In this article, we’ll explore what the dashboard is, how it works, its structure, key features, benefits, best practices, and how organizations can use it to enhance operational efficiency.
Click to Purchases Supply Chain Management Dashboard in Power BI
What Is a Supply Chain Management Dashboard in Power BI?
A Supply Chain Management Dashboard in Power BI is an interactive reporting solution that consolidates and visualizes supply chain data in real time.
It provides a unified platform where users can track, analyze, and improve every aspect of supply chain operations — from supplier performance and product delivery to inventory and logistics trends.
By connecting Power BI with an Excel data source, businesses can automatically refresh data, monitor key performance indicators (KPIs), and make faster decisions based on facts rather than assumptions.
The dashboard empowers supply chain managers to:
-
Track order fulfillment, returns, and on-time deliveries.
-
Monitor supplier reliability and warehouse performance.
-
Identify bottlenecks and areas of improvement.
-
Compare monthly and category-wise performance trends.
With a few clicks, decision-makers can uncover the entire health of their supply chain ecosystem.
Structure of the Supply Chain Management Dashboard in Power BI
This dashboard contains five interactive pages — each designed to focus on a specific dimension of supply chain performance.
Let’s explore them in detail.
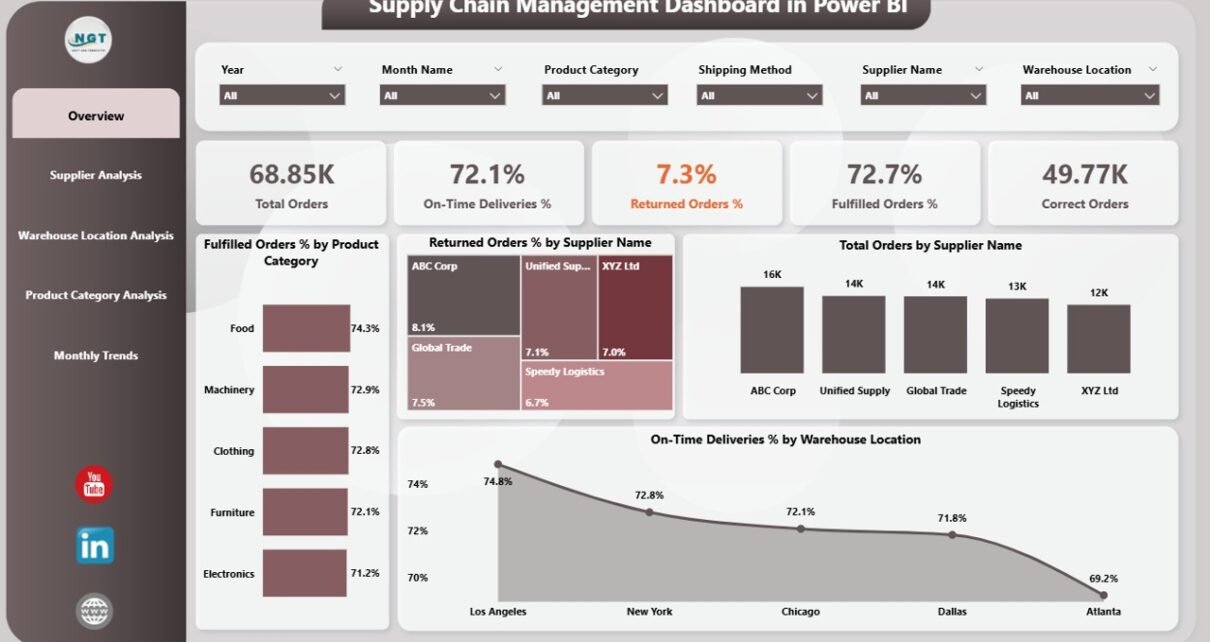
Overview Page
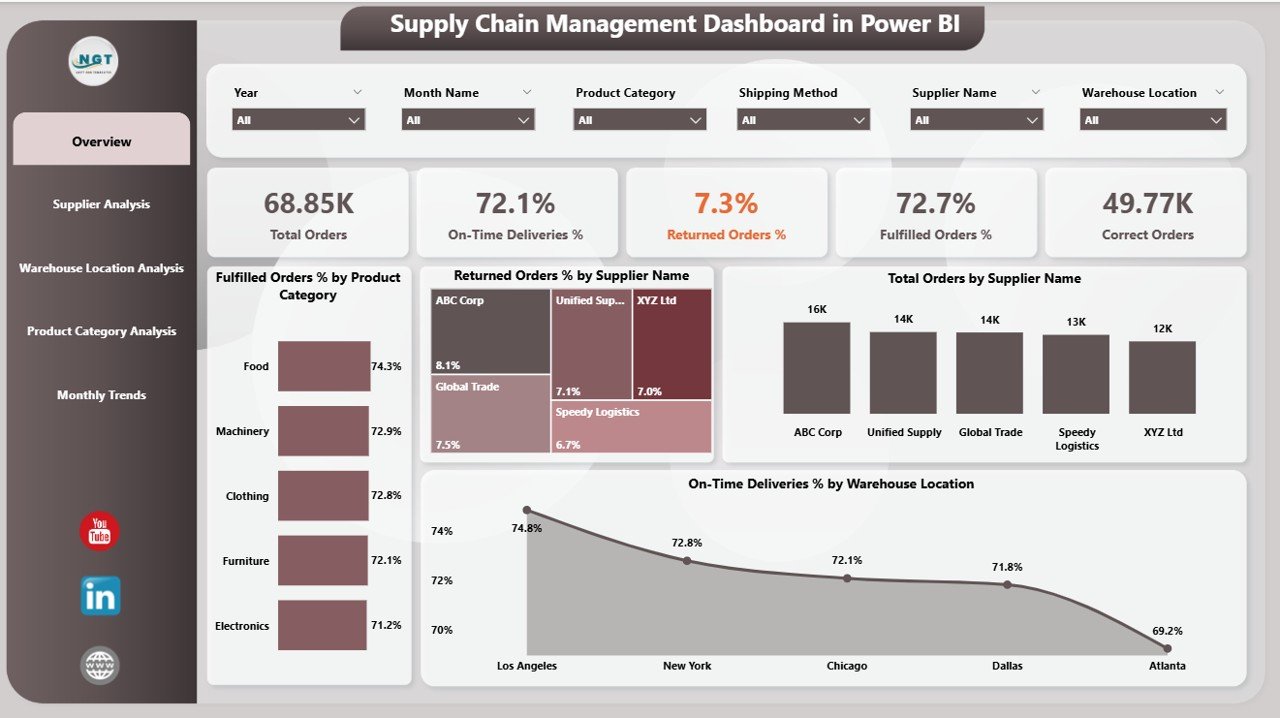
The Overview Page acts as the control center of the entire dashboard.
It summarizes high-level performance metrics and provides a snapshot of overall supply chain efficiency.
Key Components:
-
5 KPI Cards showing critical metrics such as total orders, fulfilled orders, return percentage, on-time delivery rate, and correct order rate.
Charts and Visuals:
- Fulfilled Order % by Product Category
- Return Order % by Supplier Name
- Total Order by Supplier Name
- On-Time Deliveries % by Warehouse Location
With these visuals, users can quickly identify performance gaps and top-performing suppliers or warehouses.
Supplier Analysis Page
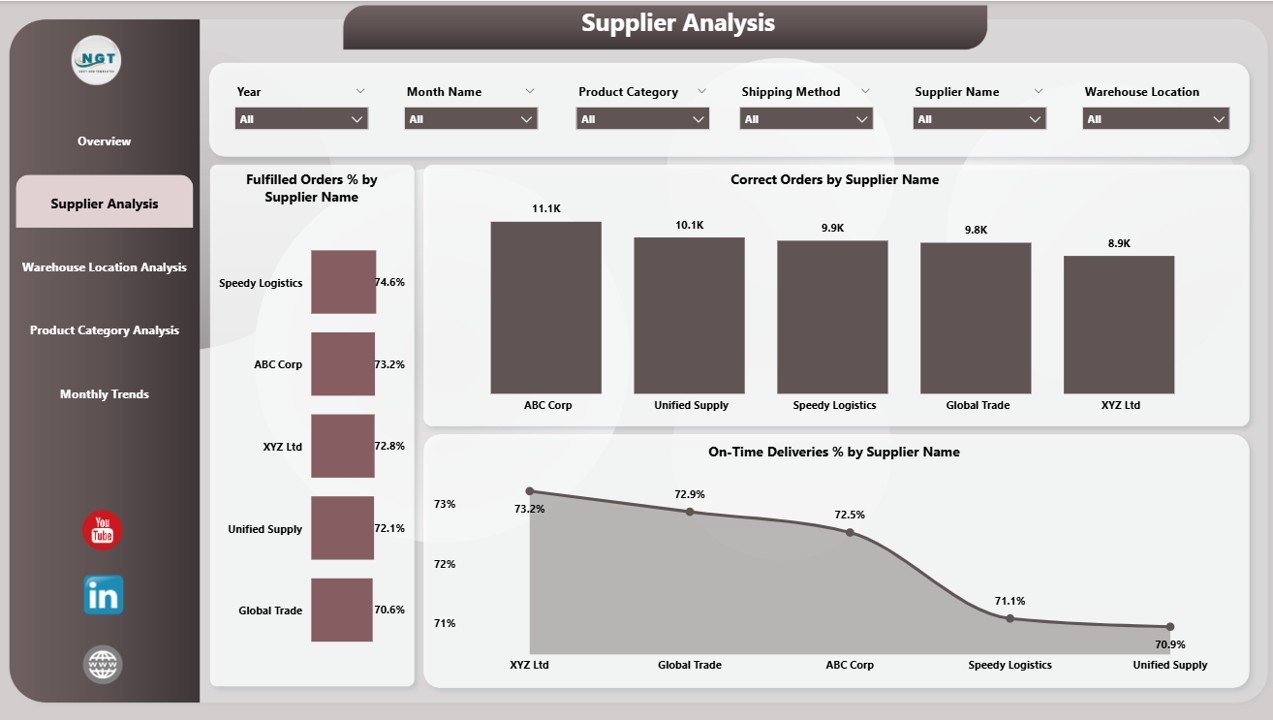
The Supplier Analysis Page focuses on evaluating how each supplier contributes to supply chain performance.
Main Charts:
-
Fulfilled Order % by Supplier Name
-
Correct Order % by Supplier Name
-
On-Time Deliveries % by Supplier Name
Purpose:
This page helps managers identify reliable suppliers, detect recurring quality issues, and optimize procurement strategies. By filtering data through slicers, users can compare supplier performance across different months, regions, or product categories.
Warehouse Location Analysis Page
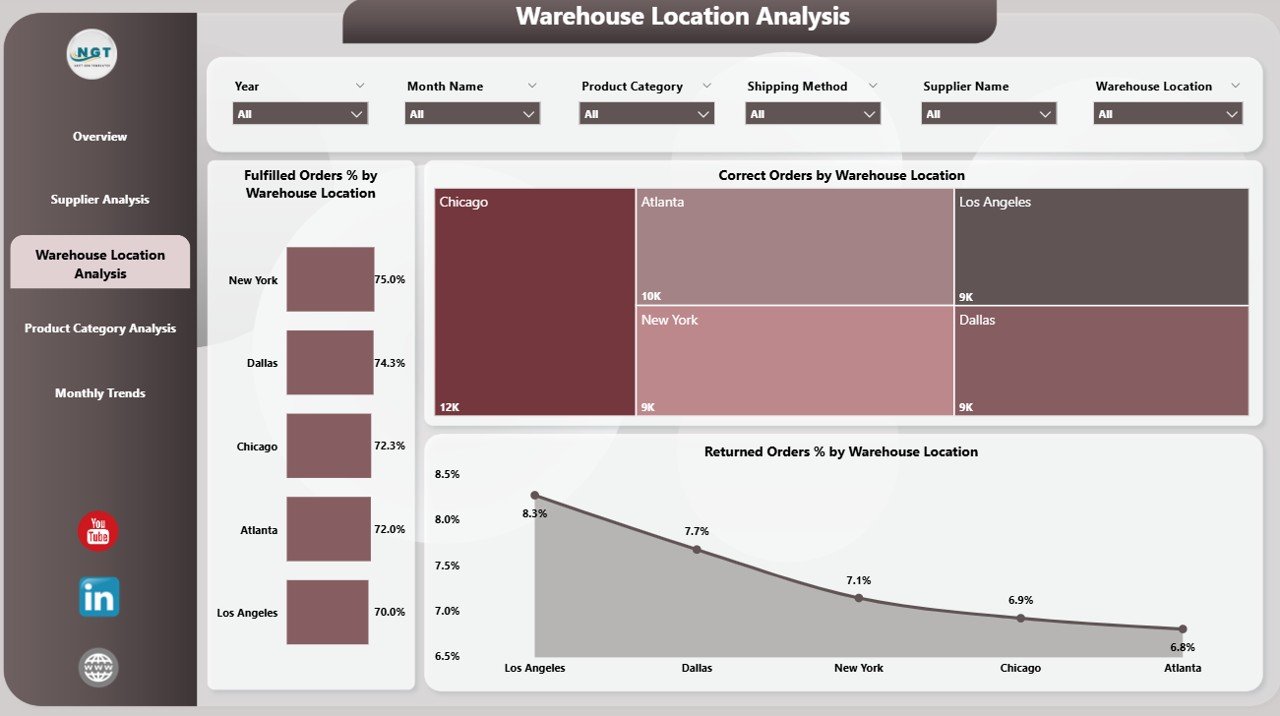
Warehouse operations directly impact delivery performance and cost efficiency.
Key Visuals:
-
Fulfilled Order % by Warehouse Location
-
Correct Order % by Warehouse Location
-
Returned Order % by Warehouse Location
Insight Generated:
This analysis helps identify which warehouses are consistently performing well and which ones face delays or higher return rates.
By visualizing data geographically, managers can take corrective actions to improve regional efficiency.
Click to Purchases Supply Chain Management Dashboard in Power BI
Product Category Analysis Page
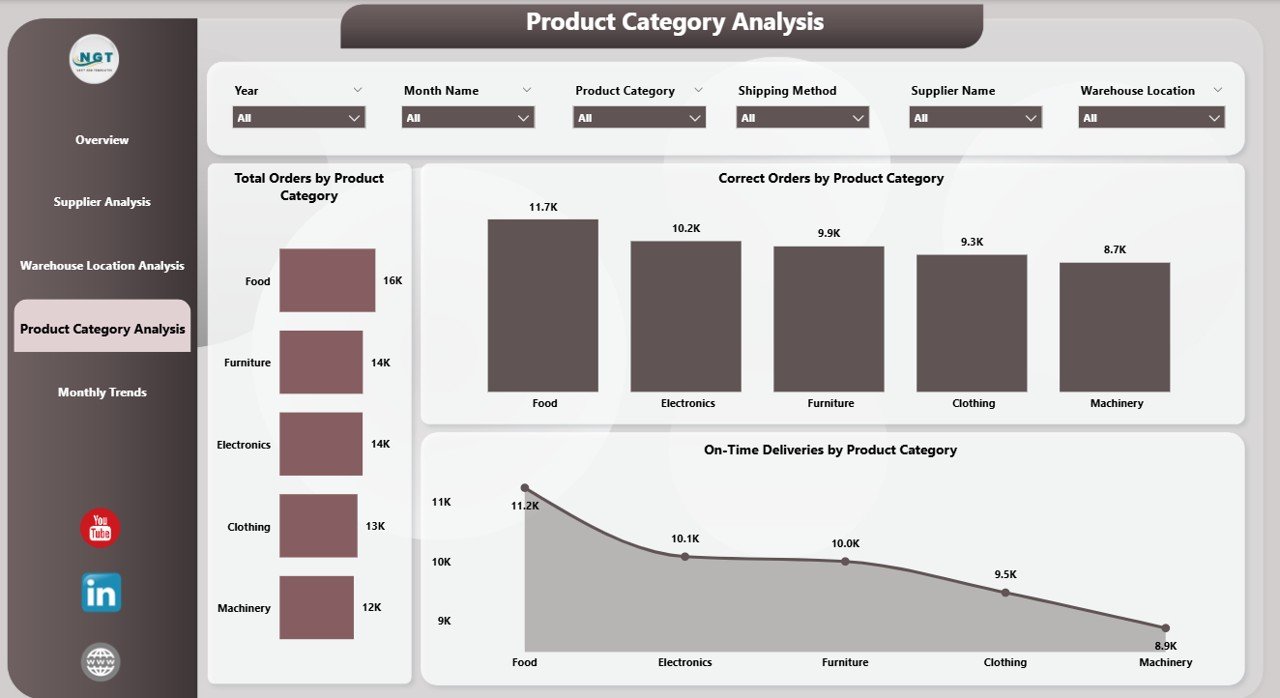
This page dives deep into product-wise performance, helping the business understand which categories are driving success and which need improvement.
Charts Included:
-
Total Orders by Product Category
-
Correct Orders by Product Category
-
On-Time Deliveries by Product Category
Use Case:
This insight allows companies to optimize stock levels, prioritize high-demand categories, and maintain quality consistency across all product lines.
Monthly Trends Page
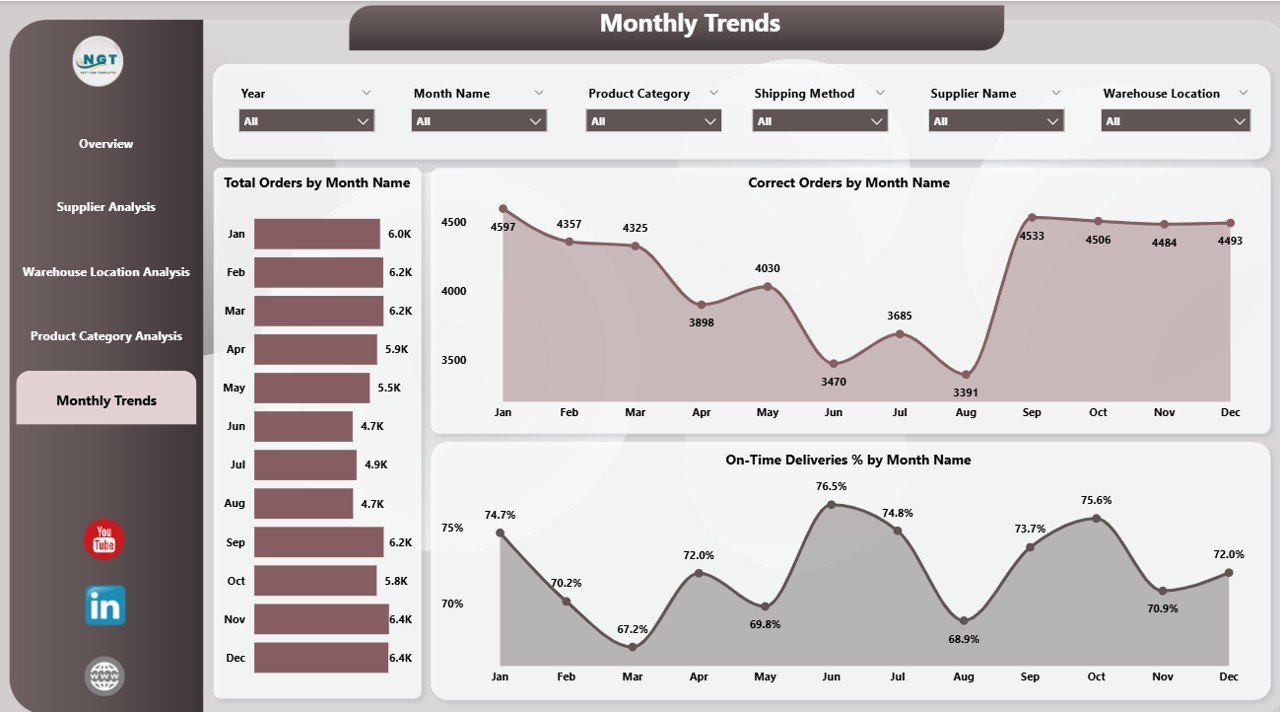
The Monthly Trends Page presents time-based analysis that reveals how supply chain performance evolves month by month.
Charts Featured:
-
Total Orders by Month
-
Correct Orders by Month
-
On-Time Deliveries % by Month
Why It Matters:
Trend analysis allows managers to spot seasonal fluctuations, assess process improvements, and forecast upcoming challenges.
For example, a spike in return rates during certain months might indicate supplier or quality issues that need immediate attention.
Why Use Power BI for Supply Chain Management?
Microsoft Power BI is one of the most effective tools for visualizing large datasets and deriving meaningful insights.
Here’s why it fits perfectly in supply chain management:
-
Data Integration: It connects seamlessly with Excel, ERP systems, and databases.
-
Real-Time Monitoring: Dashboards update automatically as new data is uploaded.
-
Interactivity: Filters and slicers allow users to explore data dynamically.
-
Accessibility: Teams can access the dashboard anywhere, on desktop or mobile.
-
Visualization: It converts rows of data into easy-to-understand charts and KPIs.
These advantages make Power BI the go-to choice for modern supply chain analytics.
How to Use the Dashboard Effectively
To make the most of this Power BI dashboard:
-
Load the Excel Data File: Connect your Excel sheet containing order, supplier, warehouse, and delivery data.
-
Refresh Data Automatically: Schedule data refreshes to get updated KPIs daily or weekly.
-
Apply Slicers: Use filters for Month, Supplier, Product Category, or Warehouse to analyze specific areas.
-
Interpret KPIs: Track performance variances between targets and actuals.
-
Export Insights: Share visual reports and snapshots with management or vendors.
This structured approach ensures smooth analysis and continuous improvement.
Advantages of the Supply Chain Management Dashboard in Power BI
A well-designed dashboard brings numerous benefits to an organization.
Here are the major advantages:
1. Real-Time Visibility
The dashboard offers live updates, allowing teams to monitor KPIs in real time. Managers can instantly detect supply delays, stockouts, or fulfillment errors.
2. Improved Decision-Making
Instead of relying on static spreadsheets, the dashboard transforms data into visual trends. Decision-makers can quickly identify inefficiencies and make data-backed choices.
3. Enhanced Supplier Relationships
By comparing supplier performance transparently, businesses can recognize top performers and engage underperforming vendors with factual feedback.
4. Streamlined Warehouse Management
Warehouse performance analytics help optimize logistics, staffing, and delivery schedules, leading to faster operations and reduced costs.
5. Cost Reduction
With visibility into return rates, delivery errors, and incorrect orders, companies can pinpoint costly issues and take preventive measures.
6. Better Forecasting
Monthly trend analysis helps forecast demand patterns, helping businesses prepare inventory, procurement, and staffing plans accordingly.
Challenges in Supply Chain Data Management
Click to Purchases Supply Chain Management Dashboard in Power BI
Despite its benefits, managing supply chain data effectively requires careful attention.
Common Challenges:
-
Data Accuracy: Inconsistent or incomplete Excel data can distort insights.
-
Integration: Merging data from multiple sources (ERP, CRM, logistics) needs setup.
-
User Adoption: Teams must be trained to use Power BI slicers and visuals.
-
Change Management: Implementing analytics culture requires continuous support.
By addressing these challenges through process discipline, businesses can unlock the full value of their dashboards.
Best Practices for the Supply Chain Management Dashboard in Power BI
To maximize the effectiveness of this dashboard, follow these best practices:
1. Maintain Clean Data
Ensure that Excel data sheets are error-free, consistently formatted, and updated regularly.
Use data validation to prevent duplicate or missing records.
2. Define Clear KPIs
Choose KPIs that align with business goals — such as fulfillment rate, return percentage, and delivery timeliness. Avoid overloading the dashboard with unnecessary metrics.
3. Use Visual Hierarchies
Design visuals to show summary KPIs first (cards), followed by detailed charts. This makes interpretation intuitive and efficient.
4. Automate Data Refresh
Schedule automatic data refresh in Power BI Service to keep dashboards up to date without manual effort.
5. Encourage Collaboration
Allow multiple stakeholders — procurement, logistics, finance — to access and comment on shared dashboards.
6. Review Regularly
Review dashboards weekly or monthly to identify trends and take timely actions.
7. Customize for Each Department
Tailor visuals for different users — supplier managers may prefer supplier analysis, while logistics teams may focus on warehouse data.
Implementing these practices ensures the dashboard remains accurate, relevant, and actionable.
How This Dashboard Supports Business Growth
A strong supply chain directly contributes to customer satisfaction, profitability, and competitiveness.
By using this Power BI dashboard, companies gain:
-
Operational Efficiency: Fewer bottlenecks and smoother processes.
-
Customer Retention: Consistent on-time delivery builds trust.
-
Strategic Insights: Management can forecast trends and optimize resources.
-
Sustainability: Reduced wastage and optimized logistics lower costs and emissions.
In short, this dashboard serves as a digital command center for continuous improvement.
Conclusion
The Supply Chain Management Dashboard in Power BI revolutionizes how organizations monitor and manage their supply chain performance.
By connecting Excel data to Power BI’s dynamic visualizations, it offers transparency, accuracy, and efficiency.
From supplier performance to warehouse reliability, and from product category insights to monthly trends — every key metric is presented clearly for data-driven decision-making.
For organizations seeking to strengthen their operations, improve delivery timelines, and enhance collaboration, this dashboard is not just a reporting tool — it’s a strategic asset for business excellence.
Frequently Asked Questions (FAQs)
1. What is the purpose of a Supply Chain Management Dashboard in Power BI?
The dashboard helps businesses track and analyze key metrics such as fulfilled orders, return rates, and delivery performance in real time.
2. Can the dashboard connect to live data sources?
Yes. Power BI allows connections to Excel, SQL, and cloud-based systems to enable live or scheduled data updates.
3. How often should I update the dashboard data?
You can refresh it daily, weekly, or monthly depending on business needs. Power BI Service supports automated refresh schedules.
4. Is this dashboard suitable for small and medium enterprises (SMEs)?
Absolutely. SMEs benefit from Power BI’s affordability, ease of use, and integration with Excel-based data.
5. What KPIs should I focus on for supply chain optimization?
The most important KPIs include Fulfilled Order %, On-Time Delivery %, Returned Order %, and Correct Order %.
6. Can I customize visuals or add new KPIs?
Yes. Power BI allows full customization — you can add visuals, filters, or calculated KPIs anytime.
7. Does it help in reducing supply chain costs?
Yes. By identifying inefficiencies and highlighting error trends, it supports cost-reduction and process improvement.
8. Is Power BI better than Excel for supply chain reporting?
Power BI enhances Excel by offering interactivity, automation, and real-time visualization capabilities.
9. Can I share the dashboard with my team?
Yes. You can publish and share Power BI dashboards through secure cloud links or embed them in internal portals.
10. What are the prerequisites to use this dashboard?
All you need is Power BI Desktop (or Service) and a well-structured Excel data file with supplier, product, and delivery information.
Visit our YouTube channel to learn step-by-step video tutorials