In the fast-moving retail environment, supermarkets must continuously monitor performance to maintain efficiency, profitability, and customer satisfaction. The Supermarkets KPI Dashboard in Excel is a ready-to-use tool that allows retail managers to track all key performance indicators (KPIs) in one interactive and data-driven dashboard.
This powerful Excel solution provides insights into sales, inventory, customer behavior, and operational efficiency, helping supermarket owners make smarter, faster decisions.
Click to Purchases Supermarkets KPI Dashboard in Excel
What Is a Supermarkets KPI Dashboard in Excel?
A Supermarkets KPI Dashboard is an analytical tool built in Microsoft Excel that tracks and visualizes performance metrics across multiple areas — such as sales, inventory management, profitability, and customer engagement.
It allows you to:
-
Measure progress against defined business targets.
-
Identify underperforming departments or categories.
-
Analyze month-to-month and year-to-date performance.
-
Optimize operations through data-driven decisions.
With Excel’s powerful formulas and charting capabilities, this dashboard converts raw supermarket data into clear visuals and meaningful trends.
Click to Purchases Supermarkets KPI Dashboard in Excel
Why Use Excel for Supermarket Performance Tracking?
Excel remains one of the most versatile and cost-effective tools for business reporting. For supermarket management, it offers:
-
Flexibility: Customize calculations, layouts, and visuals without coding.
-
Accessibility: Easy to share and update by multiple teams.
-
Automation: Use formulas and conditional formatting for real-time updates.
-
Visualization: Create interactive dashboards with dropdowns and charts.
-
Affordability: No additional software cost — ideal for businesses of any size.
With the Supermarkets KPI Dashboard in Excel, you can monitor daily operations, sales trends, and inventory efficiency effortlessly.
Key Features of the Supermarkets KPI Dashboard in Excel
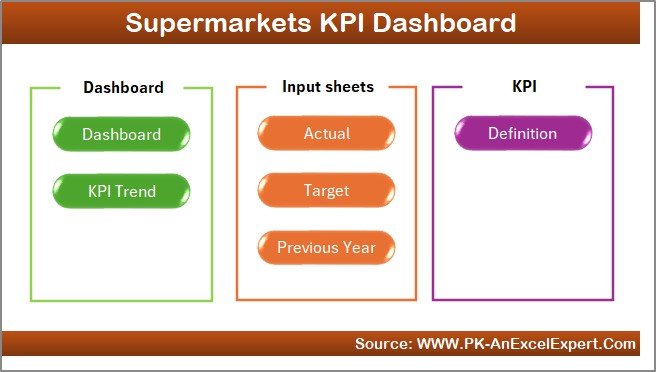
The template includes seven structured worksheet tabs, each designed for a specific purpose — from data entry to performance analysis and visualization.
1. Home Sheet – The Navigation Hub
The Home Sheet acts as the dashboard’s control center. It includes six interactive buttons that allow quick navigation to other sheets.
This sheet gives a clean, professional interface and ensures users can easily jump between sections such as Dashboard, KPI Trend, Targets, and more.
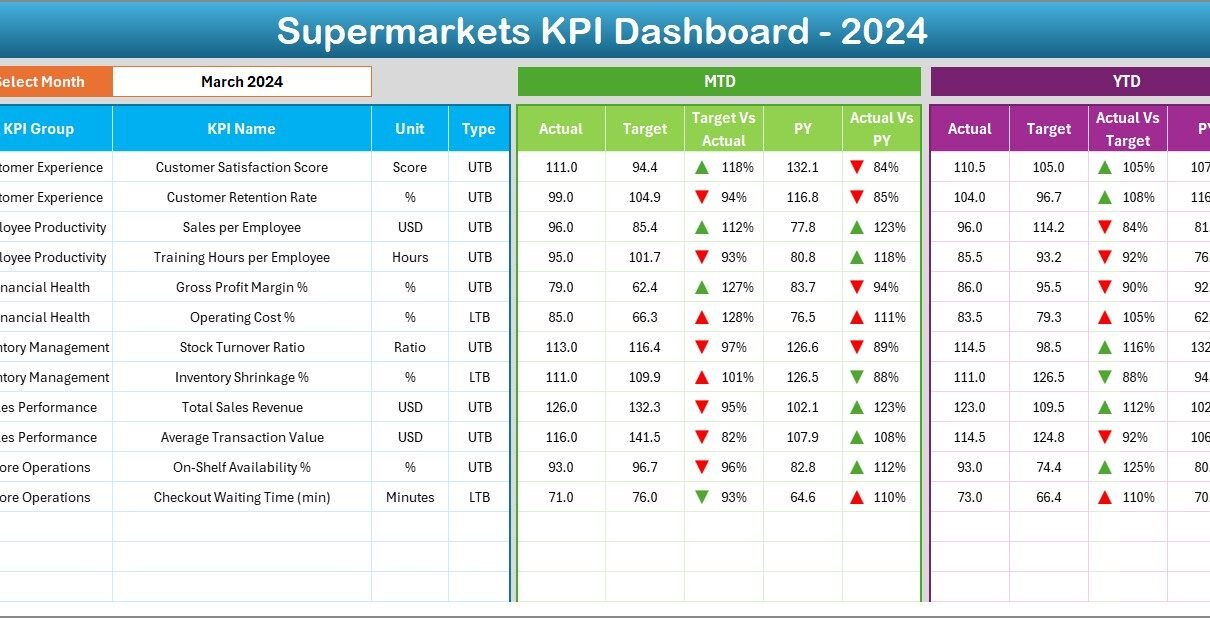
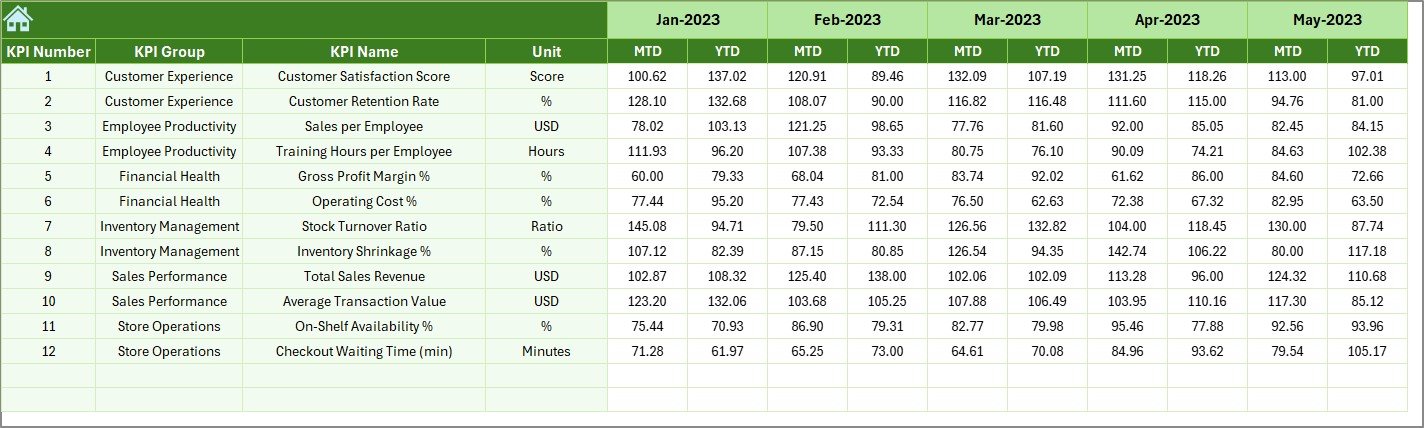
2. Dashboard Sheet – The Main Performance View
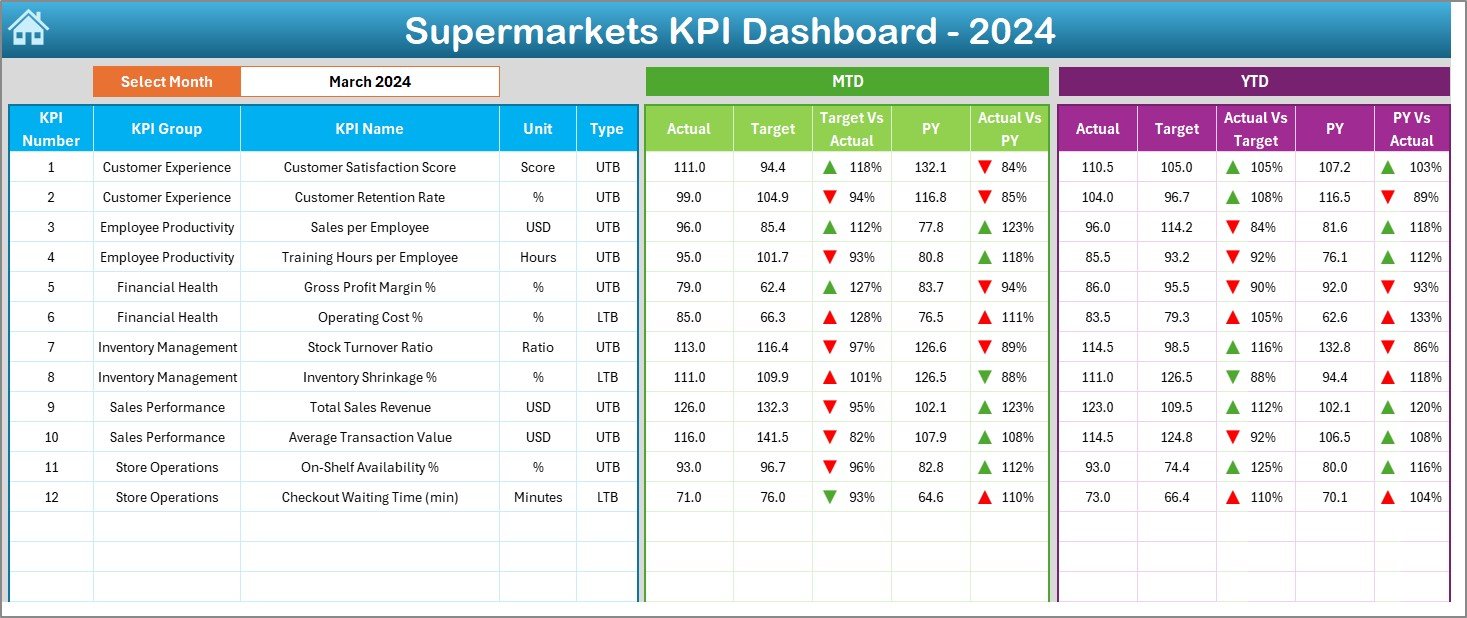
This is the heart of the entire system — where real insights come alive.
Main Features:
-
Month Selection (Cell D3): Choose a month from the dropdown menu to instantly update all metrics.
-
Dynamic Calculations: Automatically display MTD (Month-to-Date) and YTD (Year-to-Date) figures for each KPI.
-
Target vs Actual Comparison: Evaluate whether the current performance meets or exceeds goals.
-
Previous Year Comparison: See how current results stack up against last year’s performance.
-
Conditional Formatting: Arrows and color codes visually highlight improvement (↑) or decline (↓).
This sheet provides a comprehensive business overview, showing sales, revenue, customer count, and operational metrics at a glance.
3. KPI Trend Sheet – Track Progress Over Time
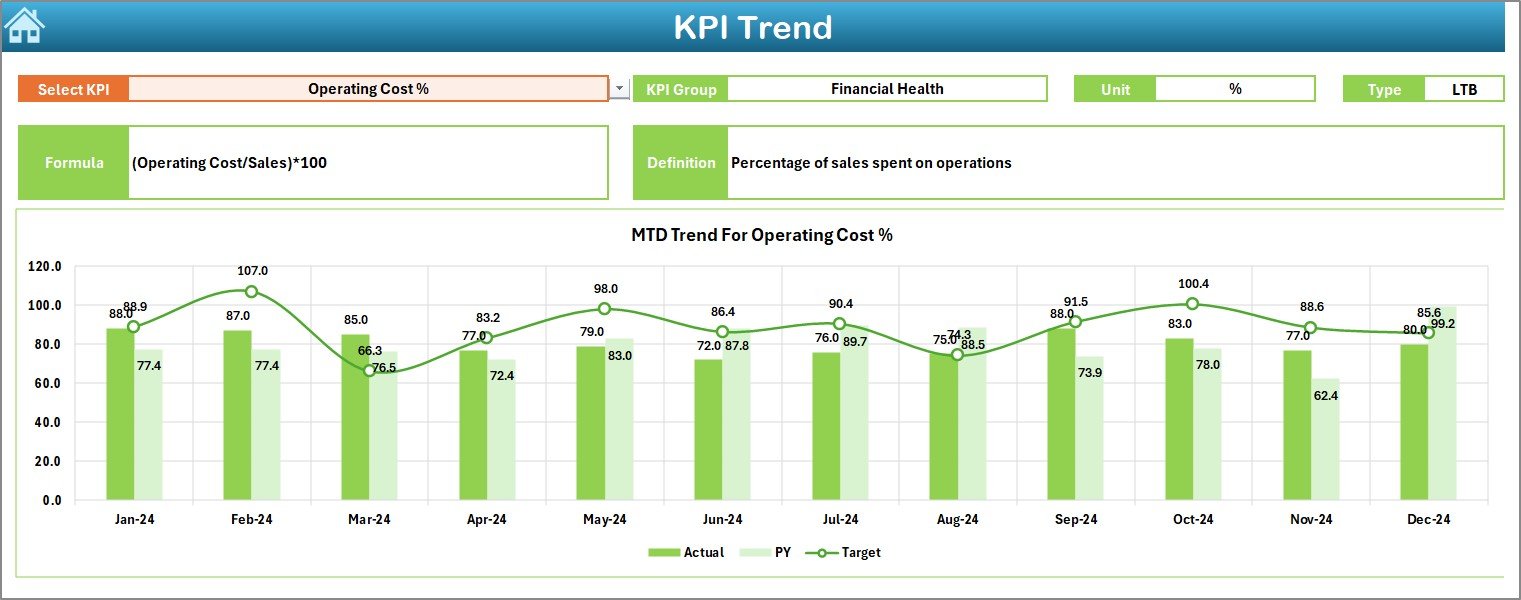
The KPI Trend Sheet is your go-to section for performance analysis over time.
Key Highlights:
-
Dropdown Selection (Cell C3): Choose a KPI to view its details dynamically.
-
Displayed Information: Automatically shows KPI Group, Unit, Formula, and Type (UTB or LTB).
-
Visual Charts: Compare Actual, Target, and Previous Year data through interactive MTD and YTD charts.
This sheet helps management identify growth patterns, seasonal changes, and long-term performance trends — crucial for forecasting and planning.
4. Actual Numbers Input Sheet – Record Current Data
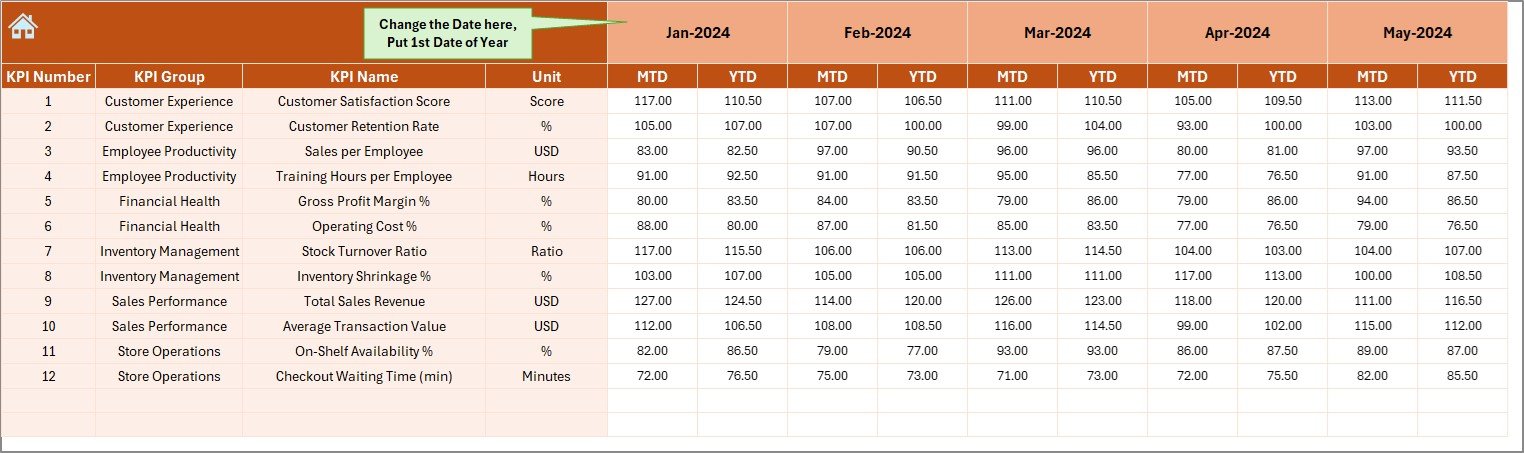
The Actual Numbers Input Sheet is where you enter the real-world performance figures for each month.
How It Works:
-
Input MTD and YTD Actual data for each KPI.
-
The sheet uses cell E1 to define the first month of the year — ensuring all time-based formulas update automatically.
-
Once data is entered, it instantly reflects across the entire dashboard.
This ensures consistency and real-time updates throughout the workbook.
5. Target Sheet – Define Your Performance Goals
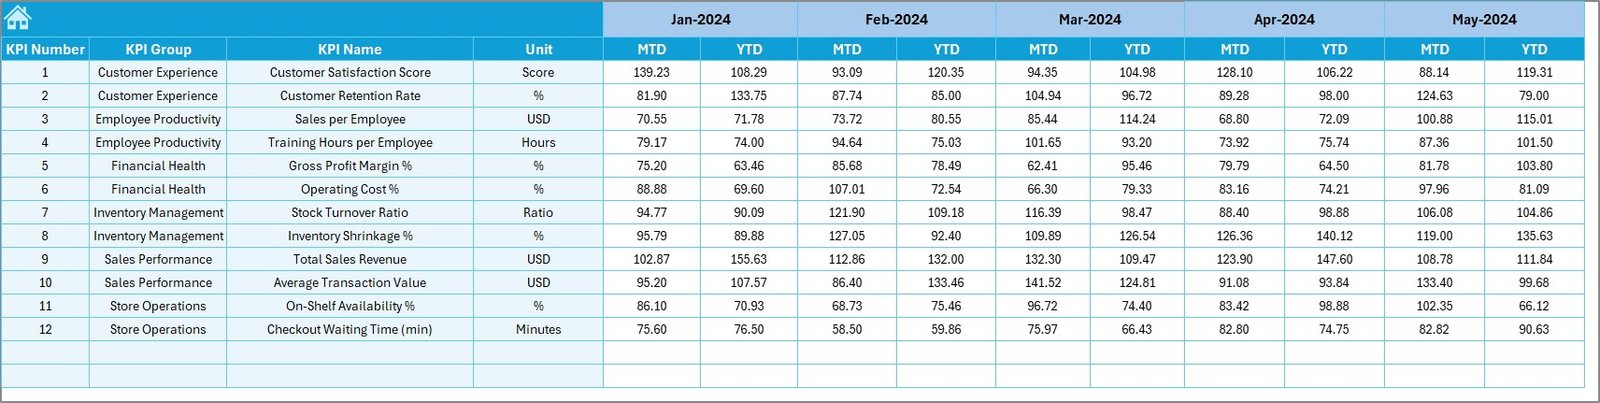
The Target Sheet stores monthly and yearly goals for each KPI.
Here, you enter:
-
MTD Targets for short-term objectives.
-
YTD Targets for cumulative goals.
The dashboard automatically compares Actual vs Target to measure performance — empowering managers to make timely adjustments.
6. Previous Year Numbers Sheet – Benchmarking Performance
The Previous Year Numbers Sheet helps you track historical performance.
By entering last year’s actual results, you can compare them directly with current data to evaluate year-on-year growth or decline.
This is invaluable for identifying improvement areas and setting more realistic future targets.
7. KPI Definition Sheet – Maintain Clarity
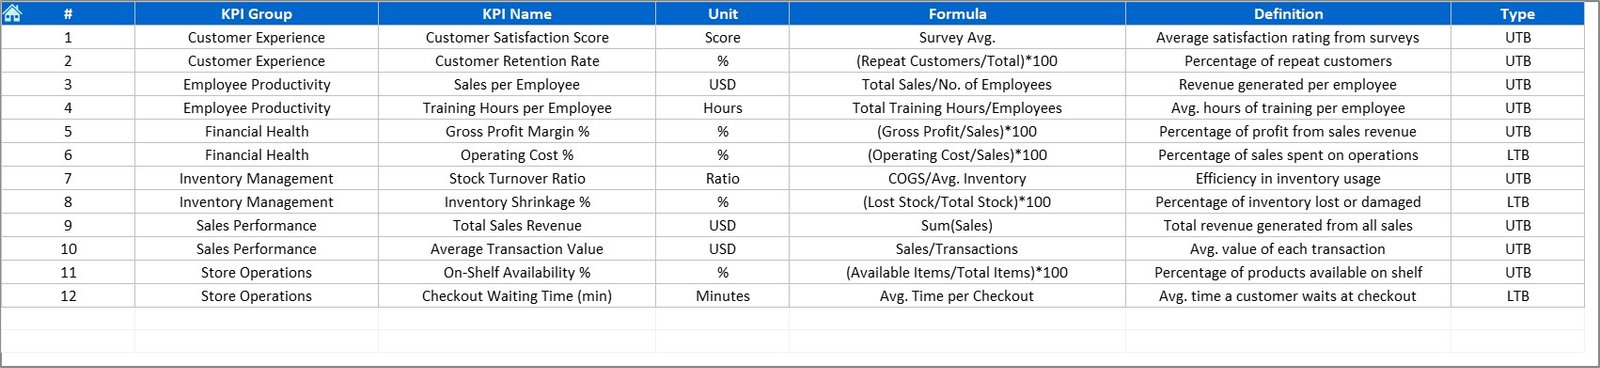
This sheet acts as your internal KPI dictionary — ensuring everyone understands each metric the same way.
Columns Include:
-
KPI Name – The measurable performance indicator.
-
KPI Group – The category such as Sales, Operations, or Finance.
-
Unit – The measurement unit (%, USD, Count, etc.).
-
Formula – The calculation method.
-
Definition – A clear description of what the KPI measures.
This sheet guarantees transparency, accuracy, and standardization across all performance reports.
How to Use the Supermarkets KPI Dashboard in Excel
Follow these simple steps to get started:
-
Open the Template: Download and open the Excel dashboard file.
-
Update KPI Definition Sheet: Customize KPI names, formulas, and units as per your business.
-
Enter Data: Fill the Actual Numbers, Target, and Previous Year sheets.
-
Choose a Month: On the Dashboard sheet, select a month from the dropdown in cell D3.
-
View Insights: Review MTD and YTD comparisons, visual trends, and performance arrows.
-
Track Trends: Use the KPI Trend sheet to study monthly progress.
-
Refine Strategy: Identify which KPIs need improvement and take action accordingly.
Advantages of Using the Supermarkets KPI Dashboard
🛒 1. Complete Performance Visibility
Access real-time metrics for sales, finance, and operations in one place.
🛒 2. Data-Driven Decisions
Identify areas that need focus and take proactive measures to boost profitability.
🛒 3. Easy to Use and Customize
The Excel format ensures you can add, remove, or adjust KPIs as your business evolves.
🛒 4. Cost-Effective
No extra software required — all insights delivered within Excel.
🛒 5. Time-Saving Automation
Formulas, dropdowns, and conditional formatting automate calculations and visuals.
🛒 6. Enhanced Accountability
Each KPI can be assigned to a department, increasing ownership and accountability.
How This Dashboard Boosts Retail Operations
By regularly tracking performance with this dashboard, supermarkets can:
-
Identify best-selling products and underperforming categories.
-
Optimize pricing and promotional strategies.
-
Improve stock management and reduce wastage.
-
Increase customer retention through data insights.
-
Monitor cost and profit margins to enhance financial health.
This approach creates a sustainable cycle of monitor, analyze, and improve — the core of data-driven retail management.
Click to Purchases Supermarkets KPI Dashboard in Excel
Best Practices for the Supermarkets KPI Dashboard
To maximize the impact of your dashboard, follow these best practices:
✅ 1. Keep KPIs Relevant
Focus on KPIs that align with your supermarket’s strategic goals.
✅ 2. Ensure Data Accuracy
Verify all inputs and maintain consistent units across sheets.
✅ 3. Review Monthly
Hold monthly review meetings to discuss key findings and next steps.
✅ 4. Update Targets Annually
Refresh targets based on last year’s performance and new objectives.
✅ 5. Protect Formulas
Lock key cells and formulas to avoid accidental editing.
✅ 6. Visualize Clearly
Use color codes and arrows for quick interpretation of results.
✅ 7. Backup Your File
Maintain historical versions for trend analysis and audits.
Common Mistakes to Avoid
-
Entering inconsistent month or year formats.
-
Forgetting to update the KPI Definition sheet when adding new KPIs.
-
Overloading the dashboard with too many indicators.
-
Ignoring trend data when making business decisions.
-
Deleting linked formulas accidentally.
Avoiding these ensures your dashboard remains accurate and reliable.
Conclusion
The Supermarkets KPI Dashboard in Excel is an all-in-one solution for retail performance monitoring. It simplifies complex data into actionable insights, empowering supermarket owners and managers to make smarter business decisions.
From tracking sales and customer satisfaction to monitoring profitability and operations, this Excel dashboard transforms performance management into a clear, structured, and data-driven process.
Start using the Supermarkets KPI Dashboard in Excel today and experience how easy it is to analyze, measure, and grow your retail business.
Click to Purchases Supermarkets KPI Dashboard in Excel
Frequently Asked Questions (FAQs)
1. What is a Supermarkets KPI Dashboard in Excel?
It’s an Excel-based tool that tracks key performance indicators across various supermarket functions like sales, finance, and inventory.
2. Who can use this dashboard?
Retail store owners, managers, and data analysts in supermarkets can use it for operational tracking and reporting.
3. Can I add more KPIs?
Yes, you can easily add more KPIs in the KPI Definition sheet and update related data sheets.
4. How often should I update it?
Update the dashboard monthly to keep MTD and YTD performance current.
5. Do I need advanced Excel skills?
No. The dashboard uses simple dropdowns, charts, and formulas — accessible to all users.
6. Can I use it for multiple stores?
Yes, with minor modifications, you can include store-wise filters for comparison.
7. Can I connect it to Power BI?
Yes, the data structure supports Power BI integration for enhanced visual dashboards.
Click to Purchases Supermarkets KPI Dashboard in Excel
Visit our YouTube channel to learn step-by-step video tutorials