The personal care and beauty industry runs on details — every client appointment, every service, and every sale contributes to business growth. Whether you manage a salon, spa, or beauty studio, understanding your performance metrics can help you stay ahead of competition and delight customers.
However, tracking all this information manually can quickly become overwhelming. That’s where the Personal Care & Beauty Dashboard in Excel steps in — a smart, easy-to-use, and data-driven solution that turns raw data into actionable insights.
In this article, we will explore everything about this Excel-based dashboard — including its structure, benefits, and best practices — so you can make smarter business decisions with confidence.
Click to Purchases Personal Care & Beauty Dashboard in Excel
What Is a Personal Care & Beauty Dashboard in Excel?
A Personal Care & Beauty Dashboard in Excel is an interactive tool designed to help salon owners, spa managers, and beauty professionals monitor their performance metrics.
It combines multiple aspects of business performance — from profitability and customer satisfaction to service analysis and monthly trends — all in one Excel workbook.
With this dashboard, users can track metrics such as:
-
Planned Service Percentage
-
Profit by Service Type
-
Cancelled Services by Category
-
Cost vs Revenue across Regions
-
Customer Ratings by Department and Category
All data updates automatically as you input new numbers, giving you real-time performance tracking without needing any external software.
Why Use an Excel Dashboard for Personal Care & Beauty Businesses?
Excel remains one of the most flexible and accessible platforms for business analysis. When customized properly, it can rival expensive analytics tools.
Here’s why Excel is ideal for a beauty industry dashboard:
-
Ease of Use: No coding or complex setup needed.
-
Full Customization: You can modify charts, formulas, and filters anytime.
-
Offline Access: No internet dependency — access your performance data anytime.
-
Automation Features: Dynamic formulas and slicers update visuals automatically.
-
Affordability: No subscription fees like other BI tools.
With these advantages, Excel becomes not just a spreadsheet tool — but a full-scale analytics system for your personal care business.
Key Features of the Personal Care & Beauty Dashboard in Excel
This dashboard template includes five major analytical pages and several support sheets. Each page is designed to present insights in a clear, visually appealing, and interactive manner.
Let’s explore each page in detail:
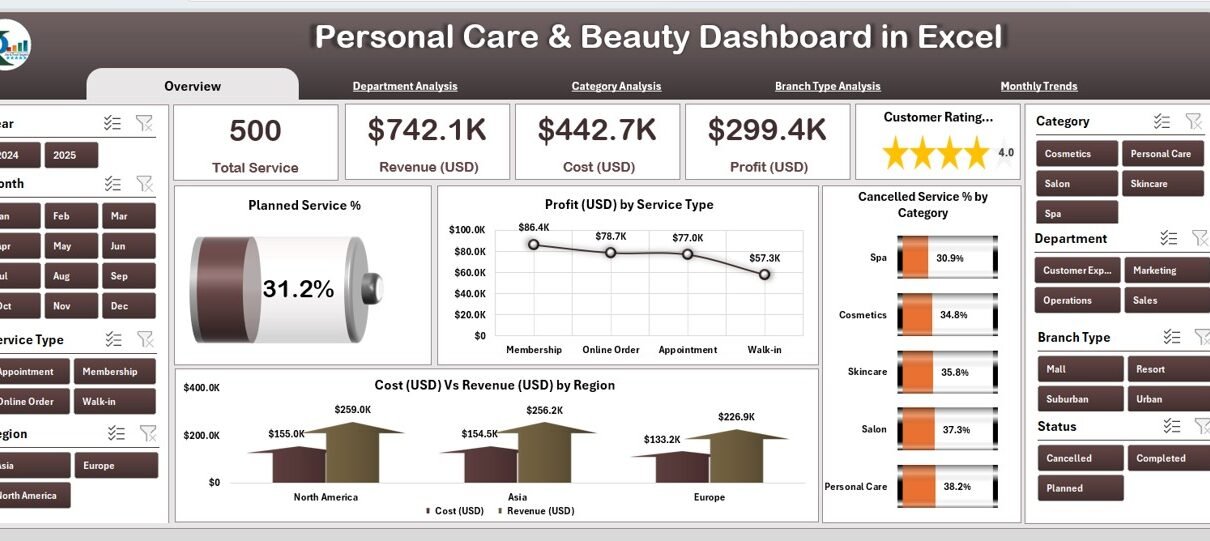
1. Overview Page
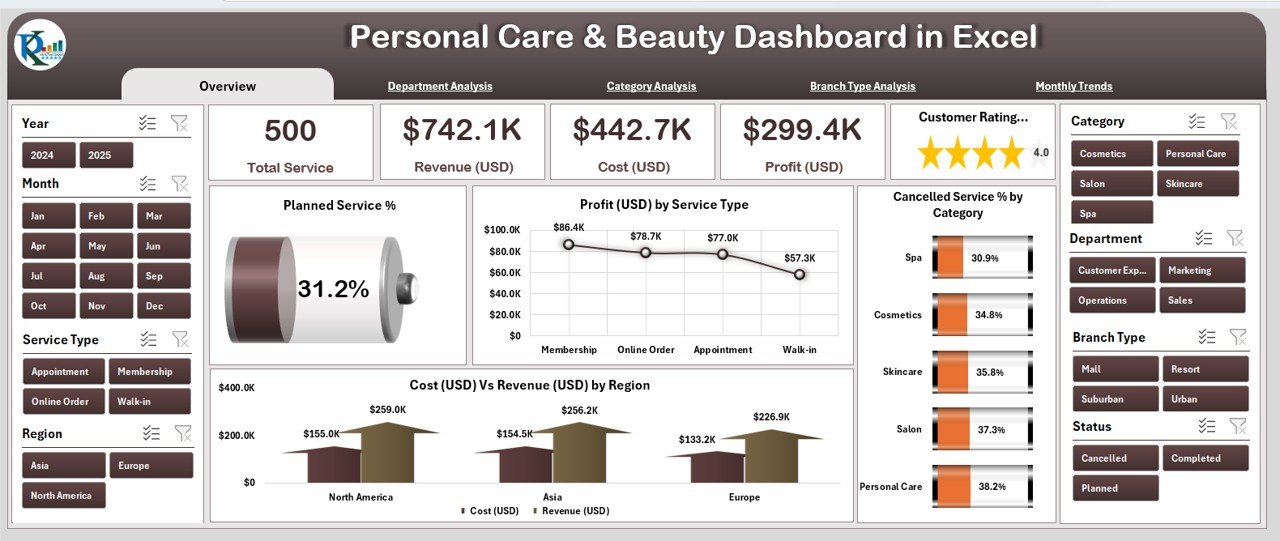
The Overview Page serves as the control center of the dashboard. It displays high-level business performance and quick summaries.
Features include:
-
Page Navigator: Located on the left side for quick movement between dashboard pages.
-
Five Cards: Highlighting key metrics such as Total Services, Planned Services %, Total Profit (USD), Revenue (USD), and Cost (USD).
Interactive Charts:
- Planned Service %
- Profit (USD) by Service Type
- Cancelled Service % by Category
- Cost (USD) vs Revenue (USD) by Region
The slicer on the right side lets you filter results by month, branch, or service category for focused analysis.
2. Department Analysis Page
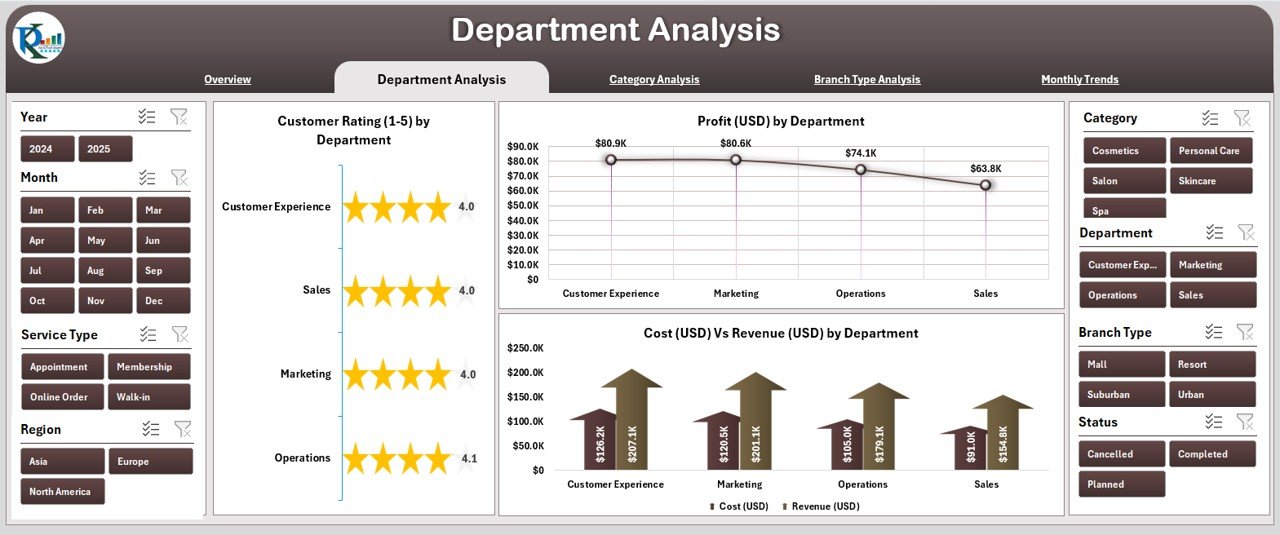
Every department — from Hair Styling to Skincare — contributes differently to overall performance. This page provides a detailed department-wise breakdown.
Charts on this page include:
-
Customer Rating (1–5) by Department
-
Profit (USD) by Department
-
Cost (USD) vs Revenue (USD) by Department
The slicer allows filtering by time period or location. Managers can easily identify which department delivers the best ratings and which needs improvement.
3. Category Analysis Page
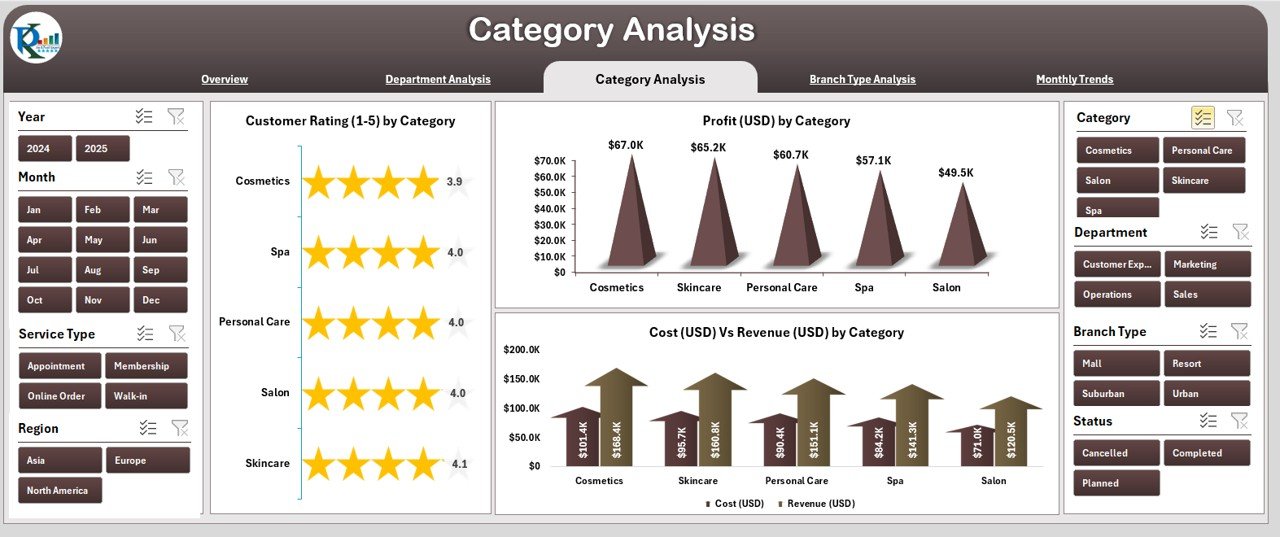
The Category Analysis page focuses on understanding which product or service categories drive maximum profit or satisfaction.
Visuals include:
-
Customer Rating (1–5) by Category
-
Profit (USD) by Category
-
Cost (USD) vs Revenue (USD) by Category
By reviewing this data, decision-makers can plan targeted promotions or allocate more resources to top-performing service categories.
Click to Purchases Personal Care & Beauty Dashboard in Excel
4. Branch Type Analysis Page
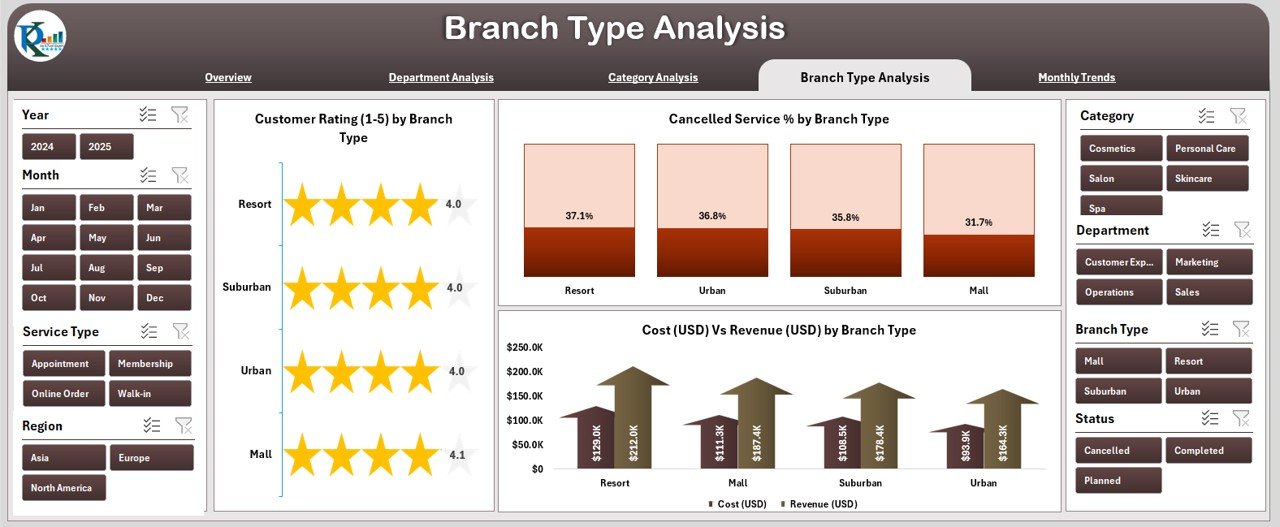
If your business has multiple branches — such as mall outlets, standalone stores, or franchise units — the Branch Type Analysis page helps compare their performance.
Charts included:
-
Customer Rating (1–5) by Branch Type
-
Cancelled Service % by Branch Type
-
Cost (USD) vs Revenue (USD) by Branch Type
This helps in understanding which branch model performs best in terms of profitability, customer satisfaction, and cost efficiency.
5. Monthly Trends Page
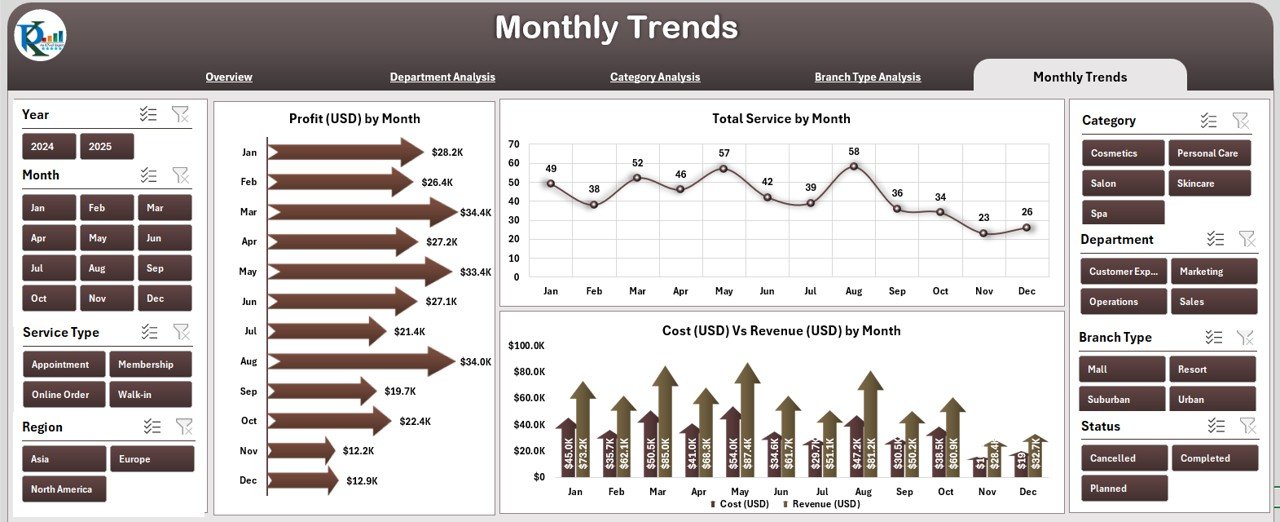
Trends tell the real story of growth. The Monthly Trends Page shows how performance changes month-by-month.
Charts include:
-
Profit (USD) by Month
-
Total Services by Month
-
Cost (USD) vs Revenue (USD) by Month
This page helps you monitor seasonality — for example, revenue spikes during festive seasons or dips during off-months.
Support and Data Sheets
-
Data Sheet: This is the backbone of the dashboard where all data entries are recorded. You can easily import your sales, cost, and service data here.
-
Support Sheet: Contains predefined lists for dropdowns and filters, ensuring clean and consistent data entry.
Advantages of the Personal Care & Beauty Dashboard in Excel
The Personal Care & Beauty Dashboard offers numerous benefits for business owners and analysts alike. Let’s explore some of the key advantages:
1. Centralized Data Management
Click to Purchases Personal Care & Beauty Dashboard in Excel
All critical data — from customer feedback to service performance — stays in one Excel file. You no longer need multiple spreadsheets or systems.
2. Real-Time Performance Tracking
The dashboard updates automatically as soon as you input new data. Managers can instantly see changes in profits, ratings, and cancellations.
3. Visual Representation of KPIs
Colorful charts, trend lines, and comparison visuals make it easier to interpret data. You can quickly spot growth opportunities and areas of concern.
4. Enhanced Decision-Making
With all KPIs available in one place, it becomes simpler to plan strategies for pricing, staffing, and marketing campaigns.
5. Customizable and Scalable
You can easily add new charts, departments, or categories as your business expands.
6. Cost-Effective Analytics
Unlike Power BI or Tableau, Excel dashboards have no ongoing costs. You only pay once and can use it indefinitely.
How to Use the Personal Care & Beauty Dashboard in Excel
Using this dashboard is simple, even for non-technical users. Follow these easy steps:
-
Open the Excel File: Launch the dashboard in Microsoft Excel (Desktop version preferred for full functionality).
-
Go to the Data Sheet: Enter your latest performance data such as revenue, costs, ratings, and service counts.
-
Use the Page Navigator: Quickly switch between pages to view different analytical perspectives.
-
Apply Slicers: Use the slicers on the right to filter by month, department, or region.
-
Analyze Trends: Observe visual patterns to identify areas for improvement or growth.
Within minutes, you’ll have a complete performance snapshot of your beauty business.
Who Can Benefit from This Dashboard?
The Personal Care & Beauty Dashboard in Excel is useful for anyone involved in beauty and wellness management, including:
-
Salon and Spa Owners
-
Beauty Chain Managers
-
Franchise Operators
-
Cosmetic Product Retailers
-
Business Analysts and Consultants
-
Financial Controllers
Whether you run a single outlet or multiple branches, this dashboard gives you complete control over business metrics.
Best Practices for the Personal Care & Beauty Dashboard in Excel
To make the most of your Excel dashboard, follow these best practices:
1. Keep Your Data Clean
Ensure that data entries are consistent. For example, use uniform names for service categories and departments to avoid chart duplication.
2. Update Data Regularly
Update your Data Sheet daily or weekly for accurate tracking. Stale data can lead to misleading results.
3. Use Filters Wisely
The slicers on each page allow powerful filtering. Use them to focus on specific months, regions, or branches when analyzing results.
4. Monitor Key Metrics
Prioritize metrics that align with your business goals — such as profit margins, customer ratings, and cancellation rates.
5. Customize When Needed
Every business is unique. Feel free to modify charts, KPI cards, or sheet names to suit your company’s needs.
6. Secure Sensitive Data
If your Excel file contains financial or customer data, protect it with a password or use Excel’s “Protect Sheet” feature.
7. Review Trends Monthly
Compare month-to-month progress to identify seasonality, recurring costs, or dips in customer satisfaction.
Tips to Get More Insights from the Dashboard
-
Combine Data Sources: Import POS data or booking details for a richer analysis.
-
Visualize Goals: Add target lines on charts to compare actual vs expected outcomes.
-
Automate Updates: Use Excel formulas or Power Query to pull data from other sheets automatically.
-
Add Conditional Formatting: Highlight top-performing branches or departments visually.
-
Export Charts: Copy visuals directly into reports or presentations for quick business reviews.
How the Dashboard Improves Business Decision-Making
With structured visuals and KPIs, decision-making becomes more data-driven and less guesswork-based.
For example:
-
If Cancelled Service % rises in one department, you can investigate reasons and retrain staff.
-
If Profit by Region shows consistent growth, you can plan expansion in that area.
-
If Customer Rating dips, it signals an immediate service quality review.
This proactive approach helps you maintain brand reputation and financial health simultaneously.
Real-Life Use Case
Let’s imagine “Glow & Shine Beauty Spa” uses this Excel dashboard.
-
They enter weekly data into the Data Sheet.
-
Managers notice a high cancellation rate in the “Nail Care” department.
-
Using the Category Analysis page, they find the issue linked to long wait times.
-
After adjusting staff schedules, the cancellation rate drops by 25%.
This demonstrates how simple data visualization can lead to actionable improvements and real business growth.
Common Mistakes to Avoid
Even though the dashboard is easy to use, many users make small mistakes that reduce accuracy. Avoid these pitfalls:
-
Entering inconsistent text (e.g., “Facial” vs “Facials”)
-
Forgetting to refresh pivot tables or charts after updating data
-
Deleting formulas accidentally while editing sheets
-
Overloading visuals with too many categories
-
Ignoring data validation lists on the Support Sheet
Being cautious about these aspects ensures smoother performance and cleaner analytics.
Advantages of Using Excel Dashboards Over Other Tools
While platforms like Power BI and Google Data Studio are popular, Excel offers unmatched accessibility and customization.
Excel Dashboard Benefits:
-
Works on all computers without installation
-
Easier for staff to understand
-
Allows offline data entry
-
No recurring costs
-
Quick to modify and duplicate
For small to mid-sized beauty businesses, Excel is both affordable and powerful.
Conclusion
The Personal Care & Beauty Dashboard in Excel is more than a reporting tool — it’s your all-in-one business companion.
By combining profit analysis, customer feedback, and performance tracking in one place, it simplifies how you manage operations.
Whether you run a single salon or an entire chain, this Excel dashboard empowers you to make data-driven decisions, improve service quality, and maximize profitability.
With regular use, this dashboard becomes an essential part of your growth strategy — keeping your beauty business both beautiful and profitable.
Frequently Asked Questions (FAQs)
1. What is a Personal Care & Beauty Dashboard in Excel?
It is an Excel-based analytical tool that helps track KPIs like profit, customer ratings, and service performance using interactive visuals.
2. Do I need advanced Excel skills to use it?
No. The dashboard is beginner-friendly. You only need basic Excel knowledge to enter data and read charts.
3. Can I customize this dashboard for my salon or spa?
Yes, you can easily rename sheets, change colors, or add your own KPIs to match your brand.
4. How often should I update the data?
For best results, update the data weekly or monthly to maintain accurate insights.
5. Does this dashboard work in Google Sheets?
It’s designed for Excel, but a simplified version can be imported into Google Sheets with limited interactivity.
6. Can I track multiple branches with this dashboard?
Absolutely. The Branch Type Analysis page is designed specifically for multi-branch performance comparison.
7. Is the dashboard suitable for freelancers or small beauty studios?
Click to Purchases Personal Care & Beauty Dashboard in Excel
Yes, it’s perfect for solo beauty professionals who want to monitor performance without investing in expensive software.
8. How do I secure my data in Excel?
You can use the “Protect Sheet” or “Encrypt with Password” option under File > Info > Protect Workbook.
9. Can I print charts or export them to presentations?
Yes. All visuals can be copied or exported as images for reports or business meetings.
Visit our YouTube channel to learn step-by-step video tutorials