In today’s fast-moving logistics industry, success depends on how well you manage fleet utilization, shipping accuracy, and delivery costs. Without a clear view of performance, it’s impossible to improve operations or reduce expenses.
That’s why the Shipping & Cargo KPI Dashboard in Excel is a must-have tool for every logistics professional. This ready-to-use dashboard brings together all your performance indicators into a single, dynamic Excel file — helping you monitor efficiency, costs, and service quality in real time.
Click to Purchases Shipping & Cargo KPI Dashboard in Excel
🎯 What Is a Shipping & Cargo KPI Dashboard in Excel?
A Shipping & Cargo KPI Dashboard is a performance-tracking solution that helps shipping companies, freight forwarders, and cargo operators monitor their KPIs across departments like fleet management, delivery performance, fuel efficiency, and customer satisfaction.
It transforms raw operational data into meaningful insights with charts, conditional formatting, and auto-calculated performance metrics such as MTD (Month-to-Date), YTD (Year-to-Date), and Previous Year comparisons.
With just a few clicks, managers can identify trends, spot inefficiencies, and make informed decisions that improve profitability and service delivery.
🧩 Structure of the Shipping & Cargo KPI Dashboard
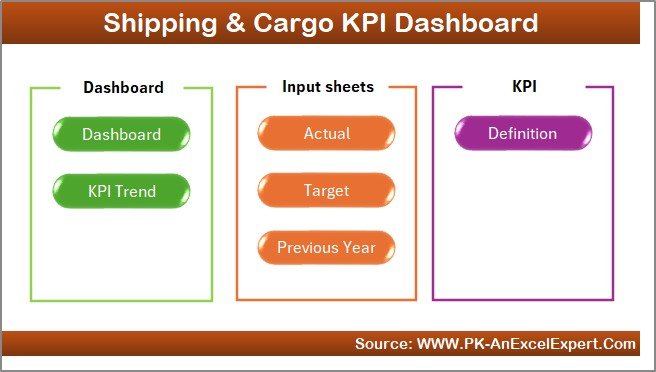
This Excel-based dashboard contains seven structured worksheets that work together to create a complete analytical system.
Let’s explore each sheet:
1️⃣ Home Sheet — The Control Panel
The Home Sheet serves as your index page.
It includes six navigation buttons that instantly take you to different sections of the dashboard — making it easy to explore without scrolling through multiple tabs.
This layout ensures that even first-time users can access reports quickly.
2️⃣ Dashboard Sheet — The Main Performance View
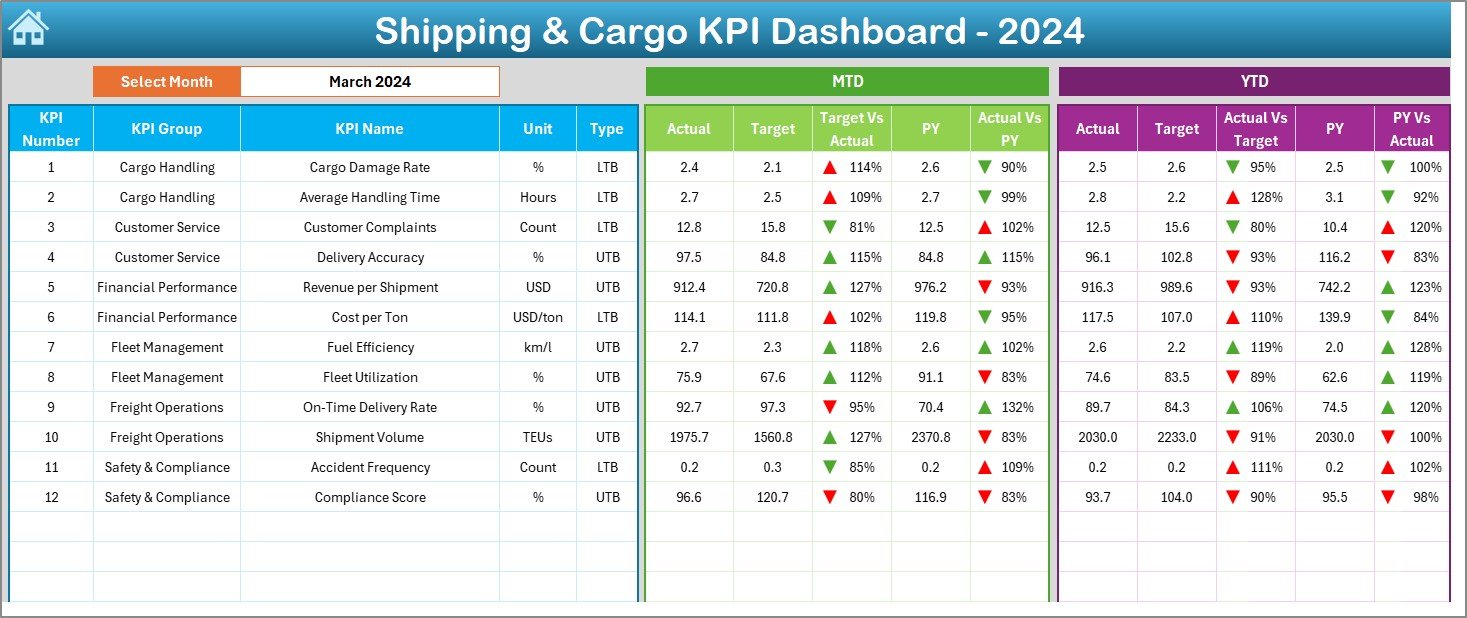
The Dashboard Sheet is the heart of the template, showing a summarized view of all key metrics for the selected month.
Key Features:
-
📅 Month Dropdown (Cell D3): Choose any month to view real-time KPI data.
-
📊 MTD & YTD Analysis: See Actual, Target, and Previous Year (PY) numbers for each KPI.
-
🟢 Conditional Formatting Arrows:
-
Green ▲ = Above Target
-
Red ▼ = Below Target
-
-
⚖️ Comparative Ratios:
-
Target vs Actual (%)
-
PY vs Actual (%)
-
This main sheet acts as your visual cockpit for operational and financial health.
3️⃣ KPI Trend Sheet — Analyze Progress Over Time
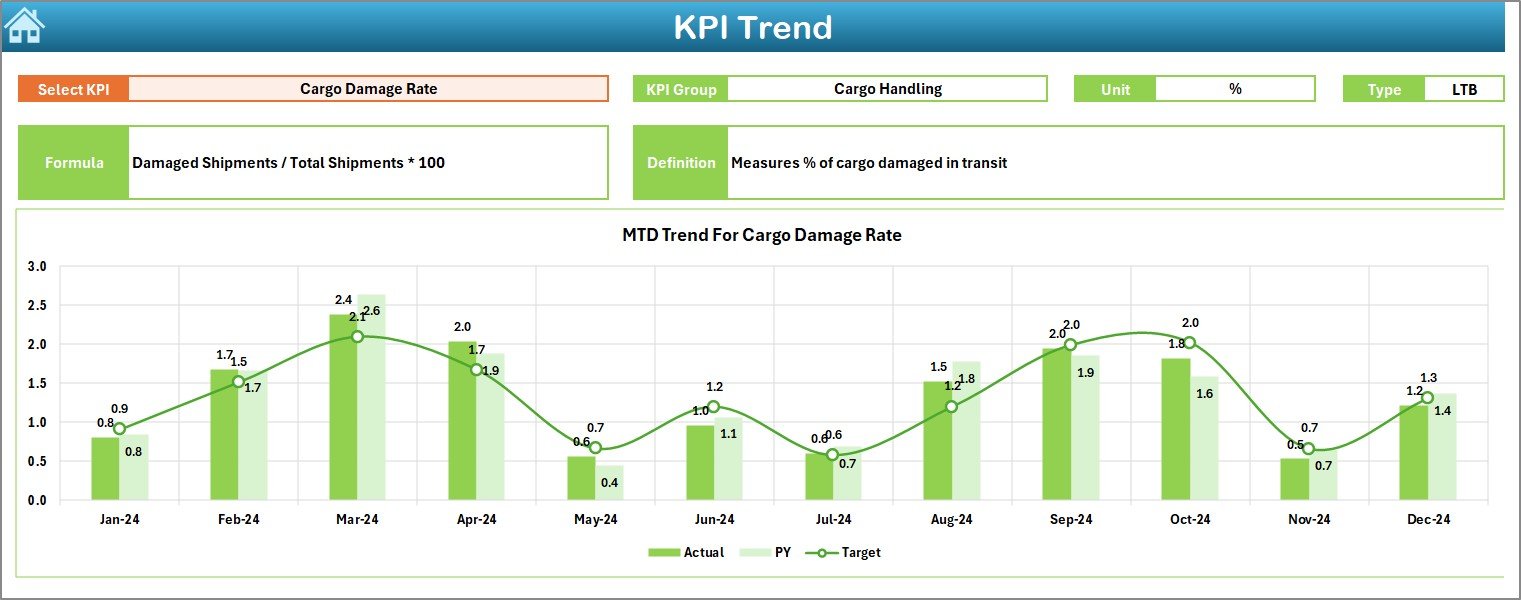
The KPI Trend Sheet lets you analyze how each KPI changes across months or years.
Highlights:
-
🎯 Select any KPI from the dropdown in cell C3.
-
📖 Displays KPI Group, Unit, Type (UTB / LTB), Formula, and Definition.
-
📈 Shows MTD and YTD trend charts for Actual, Target, and PY values.
This helps logistics analysts identify seasonal trends, efficiency issues, or improvements over time.
4️⃣ Actual Numbers Input Sheet — Enter Real Performance
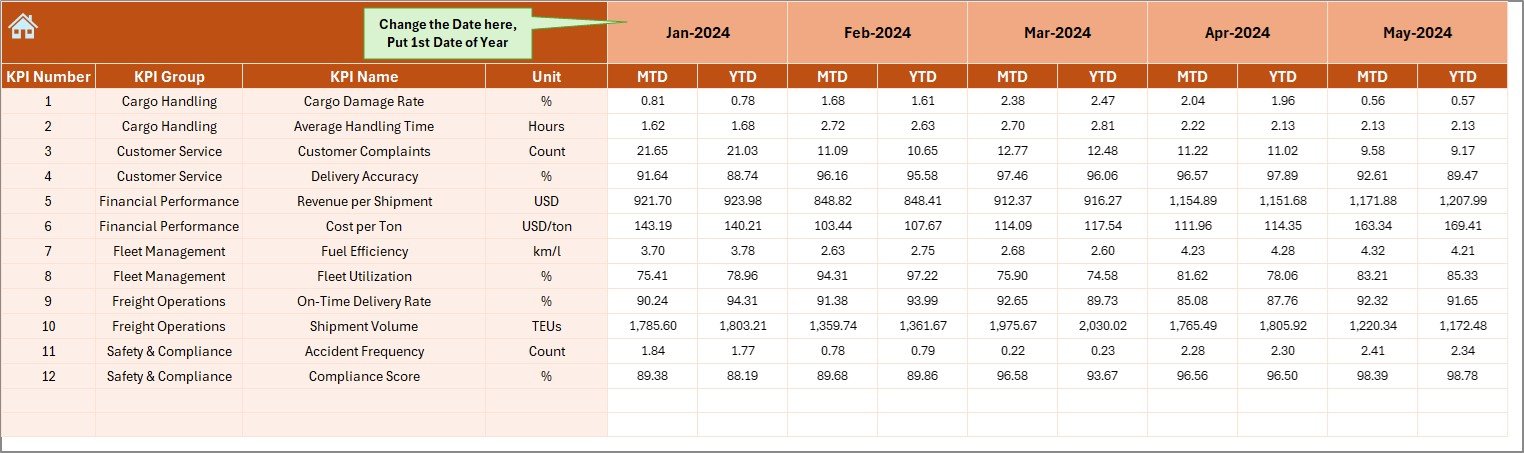
In the Actual Numbers Input Sheet, users record monthly operational data.
-
📅 Change the first month of the year in cell E1.
-
✍️ Enter MTD and YTD values for each KPI.
-
🔄 The dashboard updates automatically once new data is added.
5️⃣ Target Sheet — Define Your Goals
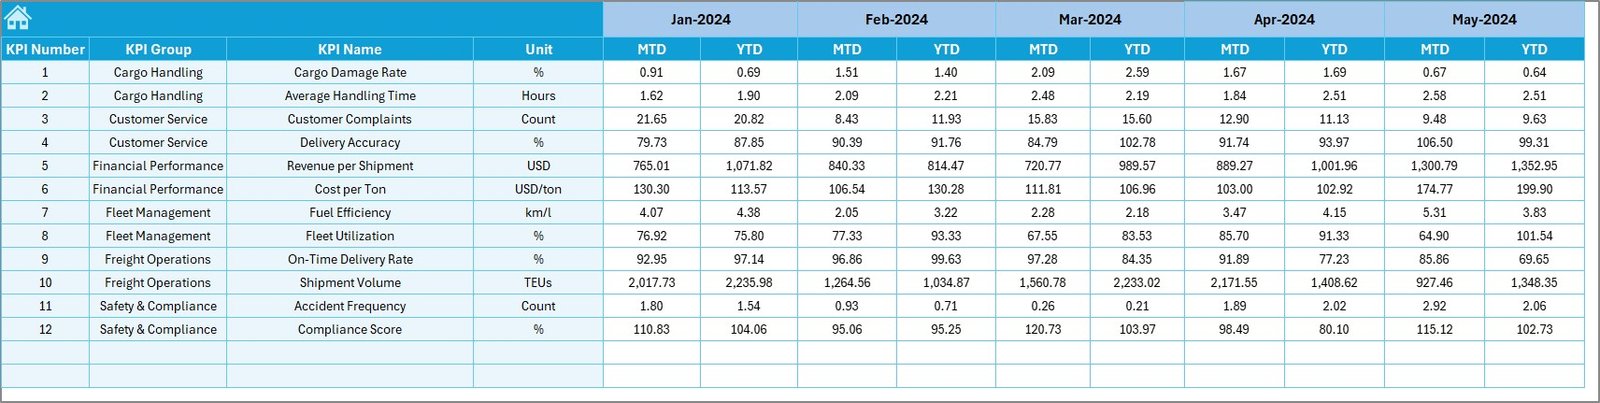
The Target Sheet allows you to input benchmark values for all KPIs.
You can record both MTD and YTD targets to measure progress toward strategic objectives.
Clear targets motivate teams and make variance analysis easier.
6️⃣ Previous Year Sheet — Year-over-Year Comparison
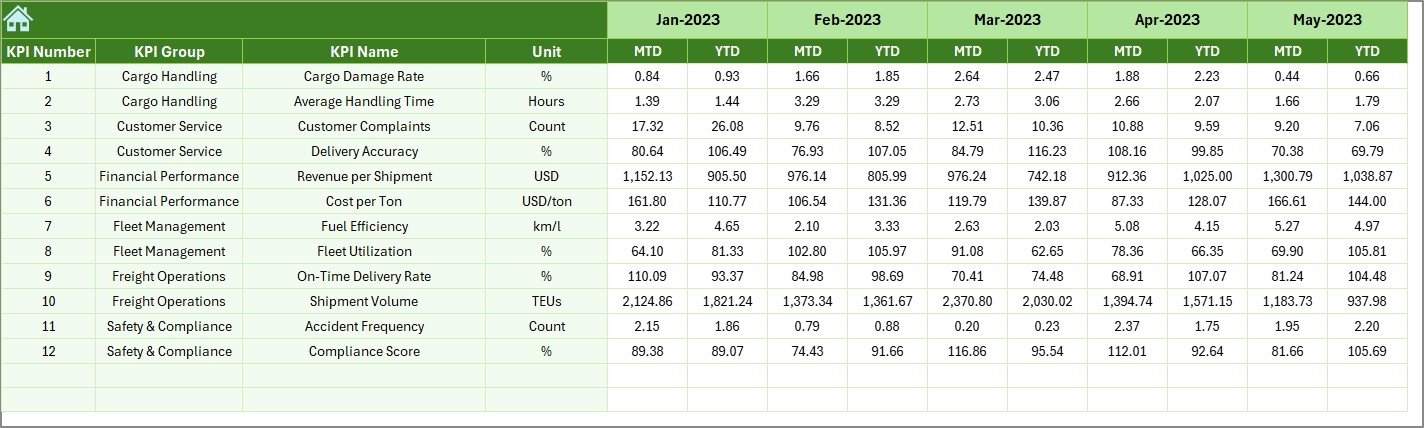
The Previous Year Sheet stores historical data from last year.
By comparing current results against PY numbers, the dashboard calculates growth, improvement, or decline across every KPI.
7️⃣ KPI Definition Sheet — The Reference Guide
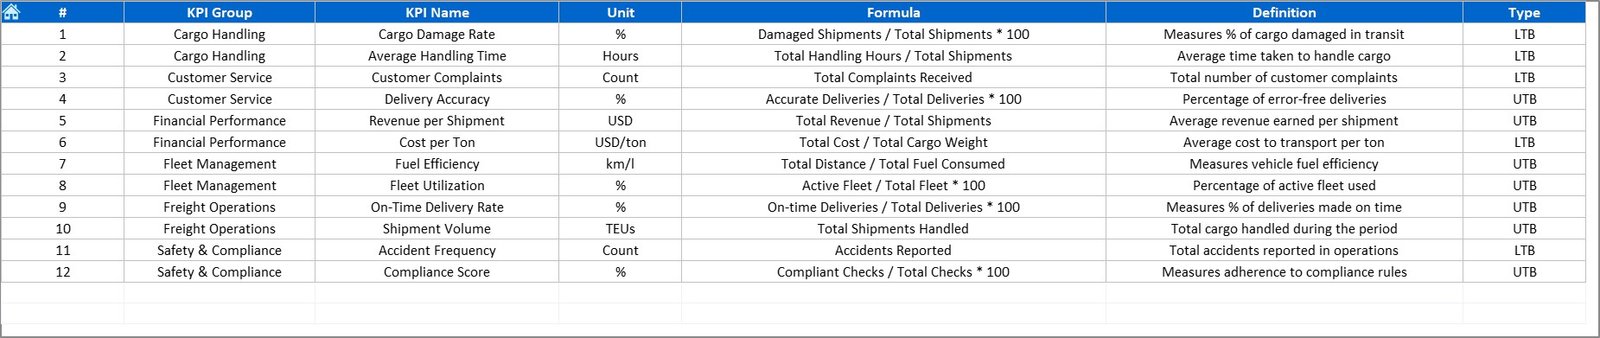
The KPI Definition Sheet lists all KPI names, groups, units, formulas, and definitions.
This ensures that everyone in the organization uses the same logic and understands what each metric means.
Click to Purchases Shipping & Cargo KPI Dashboard in Excel
⚓ Why Shipping & Cargo Companies Need KPI Tracking
Running a shipping or cargo business means managing multiple moving parts — vessels, trucks, containers, fuel, and clients. A single delay or miscalculation can affect costs and customer satisfaction.
A KPI Dashboard in Excel provides:
-
📊 Centralized reporting of all metrics in one place.
-
⚡ Real-time performance monitoring for quick decision-making.
-
💰 Cost visibility across routes and resources.
-
🎯 Data-driven goal tracking.
-
🚀 Continuous improvement through trend analysis.
⚙️ Advantages of the Shipping & Cargo KPI Dashboard
-
✅ No Coding Required: Built entirely in Excel.
-
📈 Automated Calculations: All ratios update instantly.
-
🎨 Interactive Design: Dropdowns and charts for easy navigation.
-
💼 Departmental Visibility: Supports operations, finance, and management.
-
🧭 Standardized KPIs: Ensures teamwide consistency.
-
💡 Affordable and Flexible: Ideal for any size business.
💡 Best Practices for Using This Dashboard
-
Keep Data Updated — Enter new Actuals and Targets each month.
-
Set SMART Targets — Specific, Measurable, Achievable, Relevant, Time-bound.
-
Validate Entries — Use data validation to prevent input errors.
-
Monitor YTD vs PY Trends — Spot long-term changes early.
-
Use Color Codes — Green for on-target, Red for under-performance.
-
Collaborate — Share the file with key departments for alignment.
-
Simplify Charts — Focus on clarity over decoration.
🧮 What Analysis Can You Perform?
-
Target vs Actual Performance
-
Year-over-Year Growth
-
Route Efficiency Analysis
-
Fuel Usage Trends
-
Maintenance Cost Breakdown
-
Customer Satisfaction Trends
Each analysis helps improve efficiency, reliability, and profitability.
🚢 Example Scenario
Suppose your company runs cargo operations across five ports.
-
In April, the On-Time Shipment Rate drops from 92 % to 86 %.
-
The dashboard shows a red ▼ icon indicating underperformance.
-
You review route data and discover delays due to fuel supply issues.
-
After adjusting supplier schedules, the metric rebounds to 93 % next month.
That’s data-driven optimization at its best — made possible by a simple Excel tool.
Click to Purchases Shipping & Cargo KPI Dashboard in Excel
🏁 Conclusion — Streamline Shipping Operations with Excel KPIs
The Shipping & Cargo KPI Dashboard in Excel gives you the power to track, analyze, and improve every aspect of logistics operations.
It combines automation, visual reporting, and structured data entry to simplify decision-making.
With real-time insights and trend tracking, you can reduce costs, increase on-time deliveries, and enhance service quality — all within Excel.
No complex software, no extra cost — just smart data management for smarter shipping.
Click to Purchases Shipping & Cargo KPI Dashboard in Excel
❓ Frequently Asked Questions (FAQs)
1️⃣ What is a Shipping & Cargo KPI Dashboard in Excel?
It’s an Excel-based tool that tracks operational, financial, and customer KPIs for shipping and cargo businesses.
2️⃣ How many worksheets does it include?
Seven — Home, Dashboard, KPI Trend, Actual Numbers, Target, Previous Year, and KPI Definition.
3️⃣ What kind of analysis does it support?
MTD vs Target, YTD vs PY, and trend comparisons with visual indicators.
4️⃣ Can I customize the KPIs?
Yes, simply update the KPI Definition sheet and add new metrics.
5️⃣ Who can use this dashboard?
Operations managers, fleet coordinators, finance teams, and logistics executives.
6️⃣ Does it require advanced Excel skills?
No — it’s user-friendly and completely formula-based.
7️⃣ How often should I update the data?
Monthly updates keep the dashboard accurate and relevant.
8️⃣ What are the main benefits?
Better visibility, cost control, and faster decision-making.
Click to Purchases Shipping & Cargo KPI Dashboard in Excel
Visit our YouTube channel to learn step-by-step video tutorials