Managing a hospitality business requires constant attention to detail — from tracking guest check-ins and bookings to monitoring profit, cost, and customer satisfaction. For resorts, hotels, and luxury stays, making data-driven decisions is the key to staying profitable and competitive.
That’s exactly where the Hospitality & Resorts Dashboard in Excel becomes a game changer. This ready-to-use dashboard offers an integrated way to track performance across departments, resorts, and room types — all within one easy-to-navigate Excel file.
In this article, we’ll explore everything you need to know about this dashboard — including its structure, key features, benefits, use cases, and best practices to get the most out of it.
Click to Purchases Hospitality & Resorts Dashboard in Excel
What Is a Hospitality & Resorts Dashboard in Excel?
A Hospitality & Resorts Dashboard in Excel is a performance-tracking tool designed specifically for the hotel and resort industry. It transforms complex operational data into simple, interactive visuals.
By using Excel’s built-in charts, formulas, and slicers, this dashboard helps managers monitor critical KPIs such as:
-
Guest check-in percentage
-
Profit and revenue trends
-
Customer satisfaction ratings
-
Departmental performance
-
Booking patterns and room utilization
The dashboard provides a comprehensive view of business health, allowing hospitality professionals to make timely, data-backed decisions that enhance customer experience and financial performance.
Structure of the Hospitality & Resorts Dashboard in Excel
The dashboard is divided into five analytical pages and two supporting sheets. Each page serves a specific analytical purpose, helping users drill down into various performance areas.
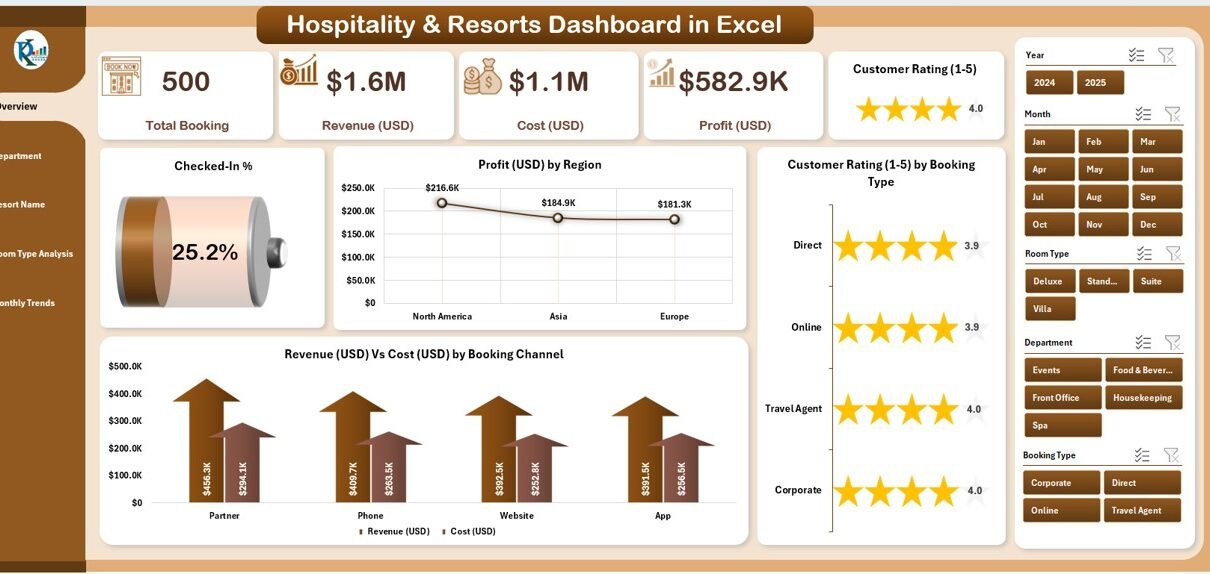
1️⃣ Overview Page
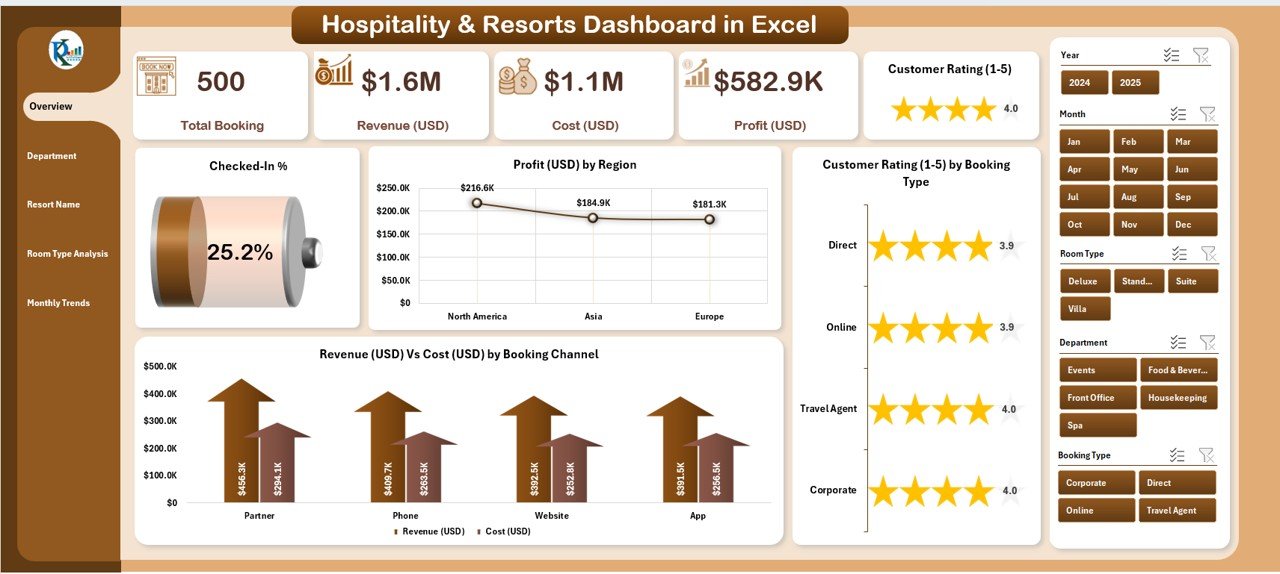
The Overview Page is the command center of the dashboard. It provides a top-level summary of performance indicators with five key cards and four analytical charts.
Cards include:
-
Total Guests
-
Total Revenue (USD)
-
Total Profit (USD)
-
Check-In %
-
Customer Rating Average
Charts featured on this page:
-
✅ Check-In %
-
💰 Profit (USD) by Region
-
⭐ Customer Rating (1–5) by Booking Type
-
📊 Revenue (USD) Vs Cost (USD) by Booking Channel
With slicers on the right side, users can filter data by time period, region, or booking type for quick comparative analysis.
2️⃣ Department Analysis Page
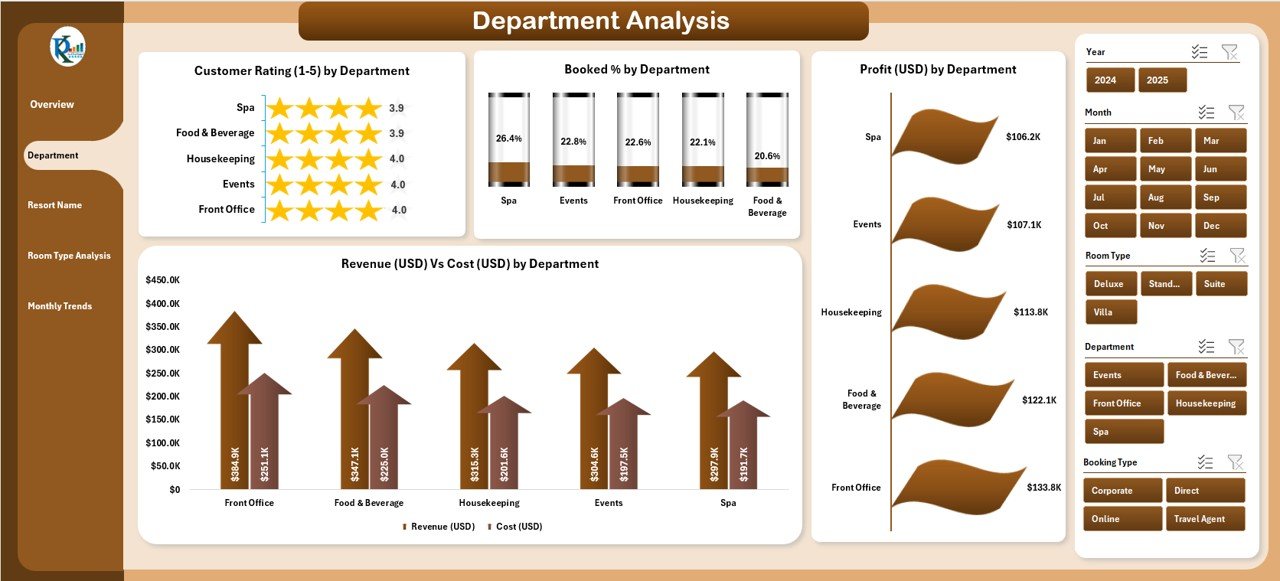
The Department Analysis Page focuses on performance by internal units like Front Desk, Housekeeping, Food & Beverage, and Spa.
Charts on this page include:
-
⭐ Customer Rating (1–5) by Department
-
🏨 Booked % by Department
-
💵 Profit (USD) by Department
-
📈 Revenue (USD) Vs Cost (USD) by Department
This page helps identify which departments are driving profits and which need operational improvements. Managers can easily compare customer satisfaction scores against departmental efficiency.
Click to Purchases Hospitality & Resorts Dashboard in Excel
3️⃣ Resort Name Analysis Page
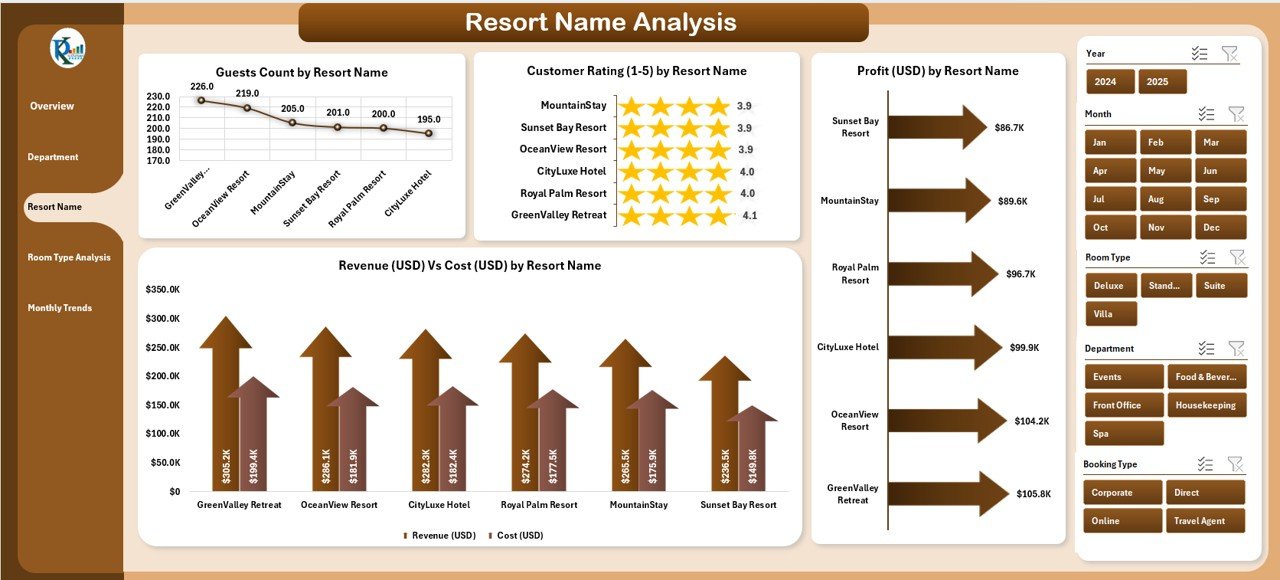
For multi-location hospitality chains, tracking performance by resort is crucial. The Resort Name Analysis Page provides exactly that.
Charts featured here:
-
👥 Guest Count by Resort Name
-
⭐ Customer Rating (1–5) by Resort Name
-
💰 Profit (USD) by Resort Name
-
📊 Revenue (USD) Vs Cost (USD) by Resort Name
This page allows users to identify top-performing resorts and regions with higher profitability or customer ratings, enabling targeted marketing or operational adjustments.
4️⃣ Room Type Analysis Page
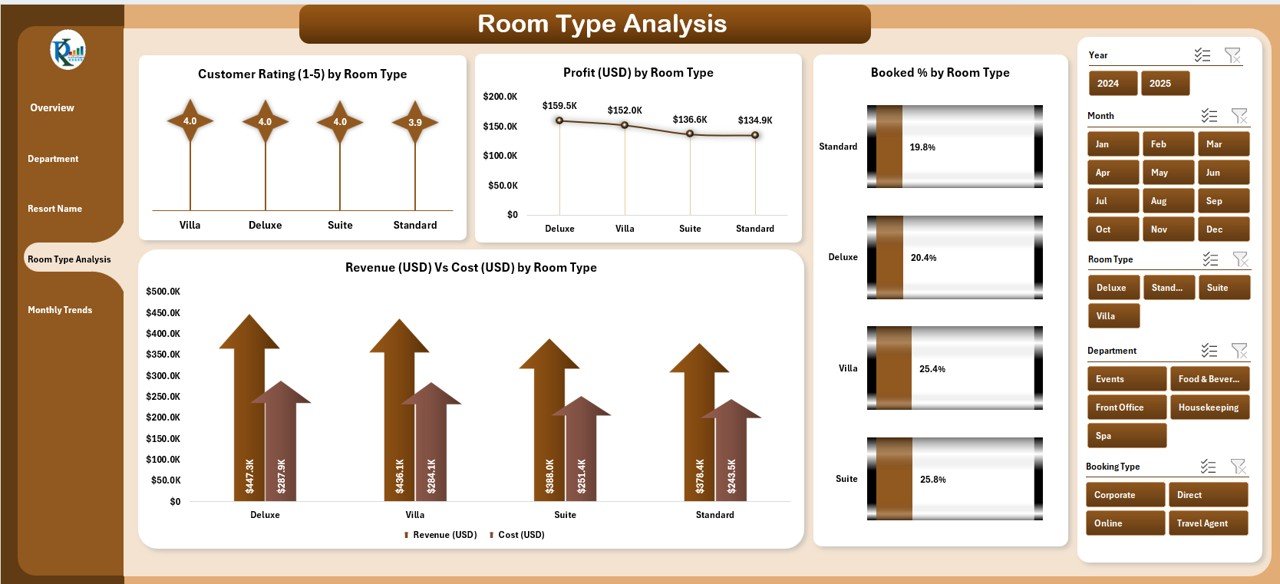
Different room categories — Deluxe, Suite, Villa, or Standard — often have varying profitability. The Room Type Analysis Page gives insights into which room types perform best.
Charts on this page include:
-
⭐ Customer Rating (1–5) by Room Type
-
💵 Profit (USD) by Room Name
-
📊 Revenue (USD) Vs Cost (USD) by Room Name
-
🛏️ Booked % by Room Type
This data helps managers optimize pricing, improve occupancy rates, and design packages that align with guest preferences.
5️⃣ Monthly Trends Page
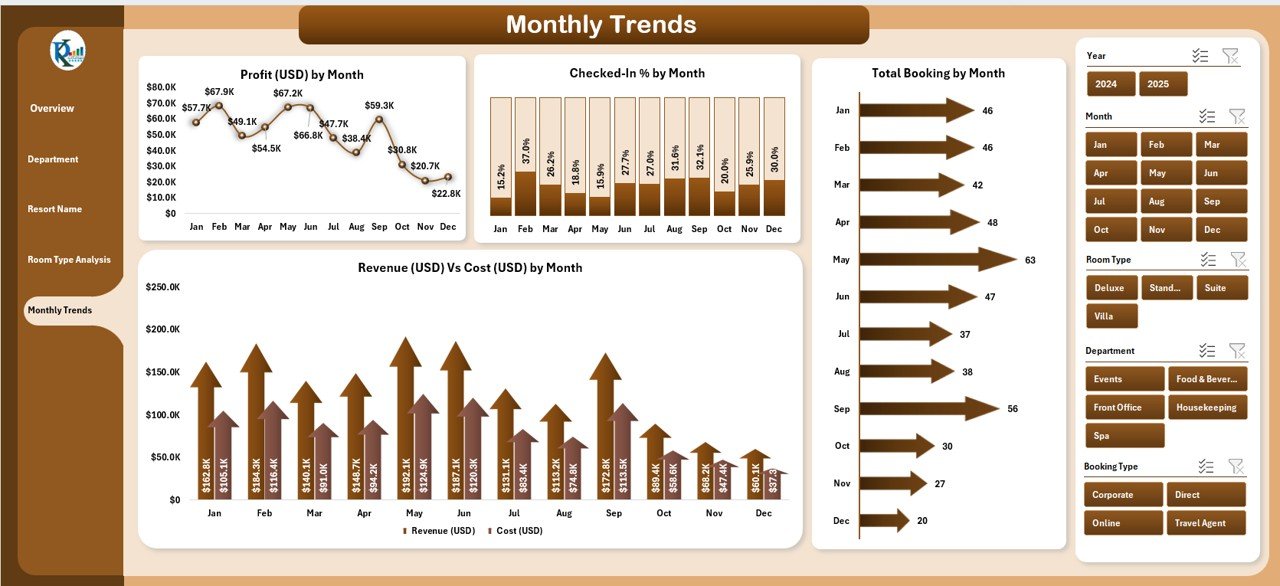
Seasonality plays a big role in hospitality. The Monthly Trends Page captures year-round performance, highlighting patterns in revenue, check-ins, and profit.
Charts on this page include:
-
💰 Profit (USD) by Month
-
🏨 Check-In % by Month
-
📅 Total Bookings by Month
-
📊 Revenue (USD) Vs Cost (USD) by Month
With these visual trends, managers can plan promotions during low-occupancy periods and maximize revenue during peak seasons.
🧾 Support Sheet and Data Sheet
-
Support Sheet: Contains dropdown lists and reference data such as department names, booking channels, room types, and regions.
-
Data Sheet: Stores raw transactional data — including booking details, customer ratings, costs, and revenue — which power all visuals in the dashboard.
Why Use a Dashboard for Hospitality and Resorts?
Click to Purchases Hospitality & Resorts Dashboard in Excel
Hospitality businesses handle multiple data streams daily — reservations, check-ins, payments, guest feedback, and service costs. Without proper visualization, it’s easy to lose track of performance metrics.
Using a dashboard in Excel allows hotel managers to:
-
Track key performance metrics visually
-
Identify profit-driving departments or locations
-
Spot underperforming areas in real time
-
Simplify decision-making with automated charts
-
Reduce manual data analysis and reporting time
The result? Better decisions, happier guests, and improved profitability.
How the Dashboard Simplifies Hotel Management
Let’s explore how each aspect of this dashboard simplifies operations and drives performance improvement.
🔹 Centralized Data Visualization
All hotel performance data — from guest satisfaction to departmental profit — appears in one file. This eliminates the need to open multiple reports or systems.
🔹 Instant Insights
With Excel slicers, managers can filter data by time, region, or booking channel. Instant results appear in dynamic charts, offering actionable insights.
🔹 Better Decision-Making
The dashboard uses color-coded visuals (green for good, red for poor) to signal performance levels. This helps management focus on problem areas quickly.
🔹 Easy Customization
Because it’s built in Excel, even non-technical users can add KPIs, modify charts, or adjust filters without needing advanced BI tools.
How to Use the Hospitality & Resorts Dashboard in Excel
Here’s a step-by-step guide to using the dashboard effectively:
-
Input Data: Add all booking, cost, and rating data into the Data Sheet.
-
Update Lists: Ensure dropdown lists in the Support Sheet are complete.
-
Refresh Dashboard: Use Excel’s refresh feature to update all visuals.
-
Use Slicers: Filter by month, region, or resort for focused analysis.
-
Analyze Trends: Visit each page to study trends across departments, resorts, and room types.
-
Export Reports: Use Excel’s export feature to create PDFs for management review.
Advantages of Hospitality & Resorts Dashboard in Excel
Here are the top reasons why businesses in the hospitality sector love this dashboard:
✅ 1. Real-Time Performance Tracking
Managers can instantly monitor bookings, revenue, and customer satisfaction without waiting for monthly reports.
✅ 2. Improved Profitability
By comparing costs and revenue across resorts and departments, the dashboard identifies areas that need cost control.
✅ 3. Enhanced Customer Experience
Tracking customer ratings by department or booking type helps focus on quality improvement initiatives.
✅ 4. Quick Decision-Making
The dashboard enables faster decision-making with automatically calculated KPIs and clear visuals.
✅ 5. Cost-Effective Analytics
Unlike paid analytics tools, Excel dashboards are free, customizable, and easy to maintain.
Best Practices for Using the Hospitality & Resorts Dashboard
To make the most of this dashboard, follow these best practices:
-
Keep data updated regularly: Add new booking and revenue entries weekly or monthly.
-
Standardize data inputs: Use dropdowns to prevent typos or inconsistent names.
-
Backup files: Save copies periodically to avoid data loss.
-
Review trends monthly: Analyze profit, rating, and occupancy patterns to plan strategic decisions.
-
Train staff: Ensure department heads understand how to interpret dashboard insights.
-
Use color codes wisely: Keep visual indicators (green/red) consistent across charts.
These practices ensure the dashboard remains accurate, insightful, and easy to use over time.
Who Can Benefit from This Dashboard?
The Hospitality & Resorts Dashboard in Excel is ideal for a wide range of professionals:
-
Hotel and Resort Managers
-
Department Heads (Housekeeping, F&B, Operations)
-
Revenue Managers
-
Hospitality Analysts
-
Business Owners
-
Financial Controllers
Even small boutique hotels or homestays can benefit from this tool, as it scales easily with growing data.
How This Dashboard Enhances Business Performance
Implementing this Excel dashboard can transform daily hotel management in the following ways:
-
Reduces reporting time by automating manual summaries
-
Highlights profit drivers and underperforming departments
-
Improves transparency across teams and branches
-
Enables strategic planning with accurate monthly and yearly insights
When used consistently, the dashboard becomes a reliable performance compass for any hospitality business.
Why Excel Is Perfect for Hospitality Dashboards
Many people wonder why Excel is still relevant when there are so many advanced BI tools. The reason is simple — Excel remains universal, flexible, and efficient.
Key advantages of using Excel:
-
Widely available and user-friendly
-
Works offline and online
-
Easily customizable with formulas and charts
-
Supports automation with macros and VBA
-
Integrates seamlessly with Power BI or Google Sheets
Thus, for businesses that want to balance simplicity with power, Excel dashboards offer the perfect solution.
Conclusion
The Hospitality & Resorts Dashboard in Excel is more than just a reporting tool — it’s a complete business intelligence solution for the hospitality industry. It brings together financial, operational, and customer insights into one unified view, helping teams make smarter, faster, and more profitable decisions.
With this dashboard, hoteliers can visualize their performance, identify trends, improve guest satisfaction, and optimize revenue — all without expensive software or technical complexity.
If you’re managing a hotel, resort, or hospitality chain, this Excel-based dashboard can become your most powerful ally in achieving data-driven excellence.
❓ Frequently Asked Questions (FAQs)
1. What is the Hospitality & Resorts Dashboard in Excel used for?
It’s used to track and analyze hotel performance metrics like revenue, profit, guest satisfaction, and booking trends across resorts, departments, and room types.
2. Can I customize this dashboard for my hotel chain?
Yes. You can easily add or modify KPIs, charts, and slicers based on your hotel’s specific reporting needs.
3. Do I need advanced Excel skills to use it?
No. Basic Excel knowledge is enough. The dashboard includes ready-made formulas and charts that update automatically.
4. How often should I update the data?
For accurate insights, update your data at least once a week or whenever new booking information is available.
5. Is this dashboard suitable for small hotels or boutique resorts?
Absolutely! The dashboard is scalable and works perfectly for small, medium, and large hospitality businesses.
6. Can this dashboard integrate with Power BI or Google Sheets?
Yes. You can export the data to Power BI or Google Sheets for advanced analysis and visualization.
7. What makes this Excel dashboard better than manual reports?
Manual reports are time-consuming and error-prone. The dashboard automates calculations and visualizations, saving time while improving accuracy.
Visit our YouTube channel to learn step-by-step video tutorials