Managing and analyzing operations in a religious or faith-based organization requires compassion, precision, and accountability. Whether it’s tracking donations, organizing events, or monitoring volunteer participation, every activity matters. However, manually compiling data from multiple sources can become overwhelming and prone to errors.
That’s where the Religious & Faith-Based Organizations Dashboard in Excel steps in. This ready-to-use template simplifies your data management, provides visual insights, and helps faith leaders make informed decisions based on accurate information.
In this article, you’ll explore what this dashboard is, how it works, its features, advantages, best practices, and frequently asked questions — all designed to help you make the most out of this efficient tool.
Click to Purchases Religious & Faith-Based Organizations Dashboard in Excel
What Is a Religious & Faith-Based Organizations Dashboard in Excel?
A Religious & Faith-Based Organizations Dashboard is a dynamic Excel-based tool designed to monitor the key performance areas of religious institutions, charities, temples, mosques, churches, or non-profit faith-based organizations.
This dashboard provides real-time visibility into donations, expenses, events, satisfaction ratings, and other critical metrics. With interactive visuals and slicers, users can instantly view performance trends by month, region, category, and department — all in one centralized place.
Because it’s built in Excel, the dashboard is:
-
💡 Easy to use: Anyone familiar with Excel can navigate and operate it effortlessly.
-
☁️ Completely offline: No need for complex software installations or online subscriptions.
-
🔄 Customizable: You can adapt KPIs, charts, and filters to fit your organization’s needs.
-
📈 Visually powerful: View actionable data using charts, cards, and summary visuals that tell your story clearly.
⚙️ Key Features of the Religious & Faith-Based Organizations Dashboard
This Excel template is thoughtfully designed to provide a clear and structured view of all important performance indicators. Below are its key features:
🧭 1. Page Navigator
Located on the left side of the interface, the page navigator allows seamless switching between different analytical pages with just one click. It simplifies the user experience and saves time when moving between insights.
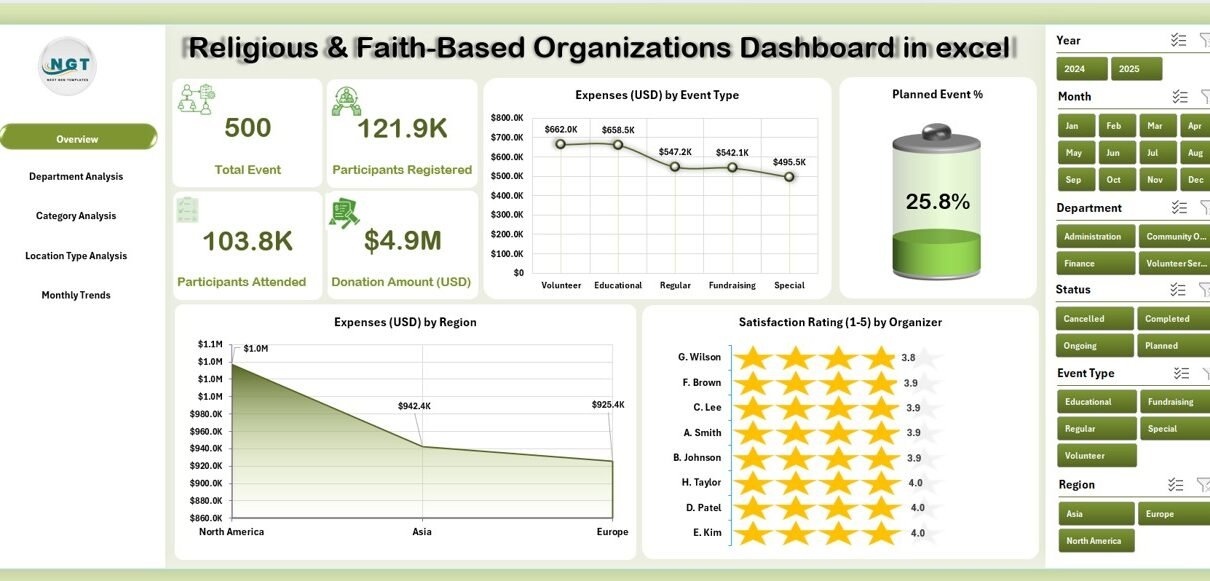
📊 2. Overview Page
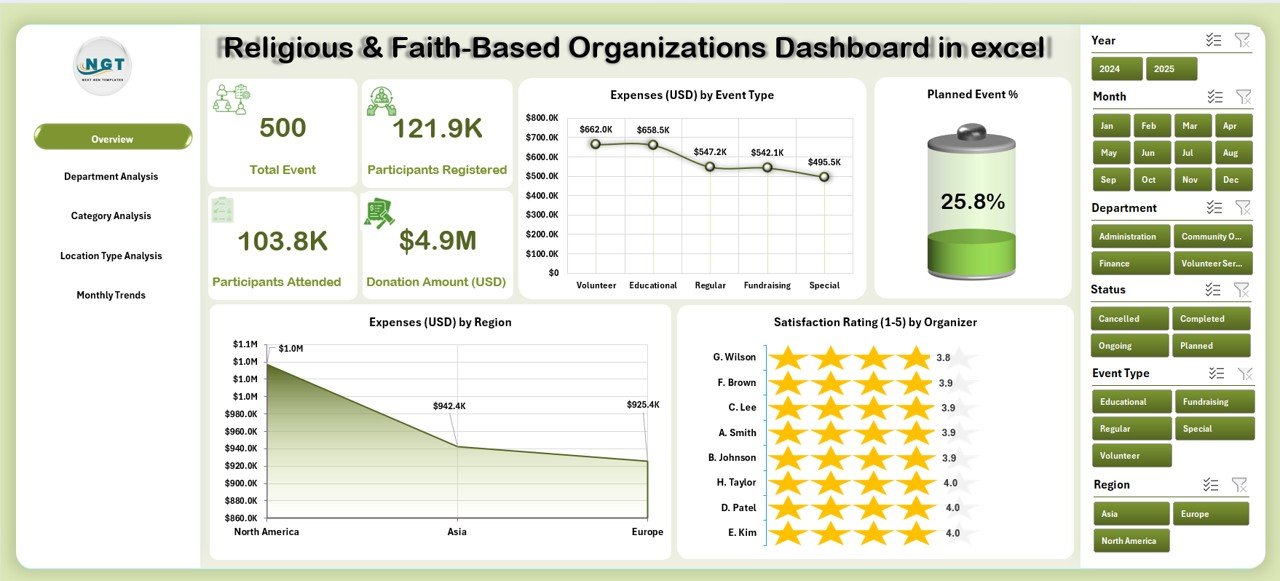
This is the main page of the dashboard where you get a quick snapshot of the organization’s performance.
Key Elements on the Overview Page:
-
Four cards: Display summary metrics such as total expenses, planned event percentage, satisfaction rating, and donation totals.
Charts included:
- Expenses (USD) by Event Type
- Planned Event %
- Expenses (USD) by Region
- Satisfaction Rating (1–5) by Organizer
This page provides a real-time overview of how well the organization is managing its finances and events.
🏛️ 3. Department Analysis Page
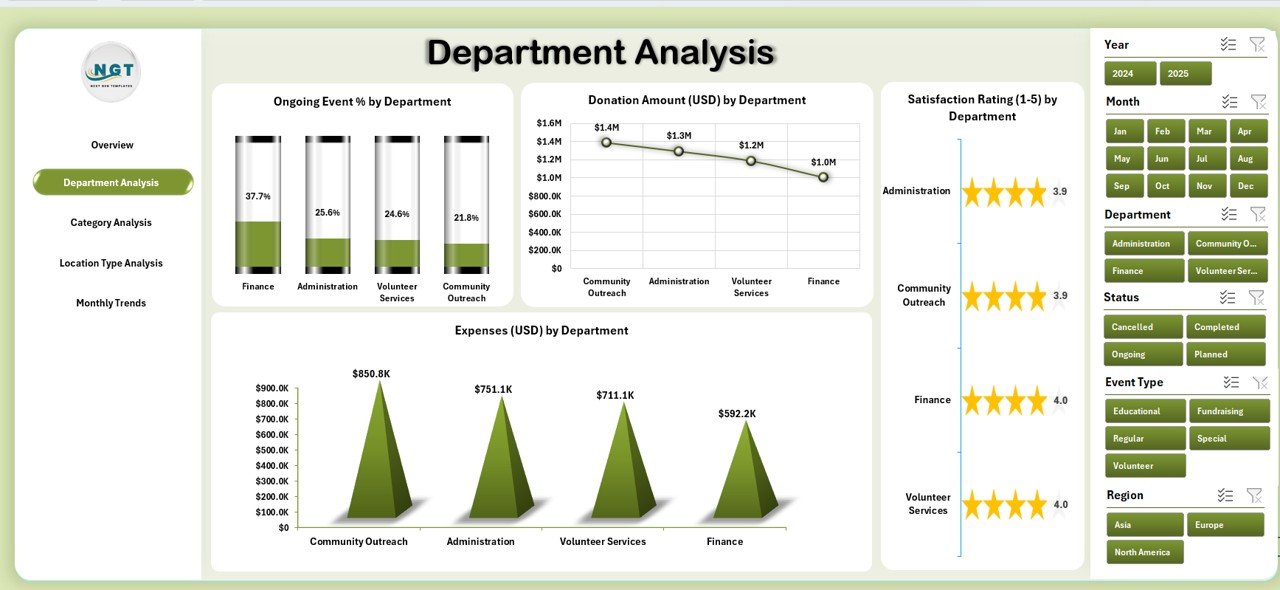
The Department Analysis page provides detailed insights into how each department performs.
Charts included:
-
Ongoing Event % by Department
-
Donation Amount (USD) by Department
-
Satisfaction Rating (1–5) by Department
-
Expense (USD) by Department
These visuals help identify which departments perform well and which ones may need additional resources or support.
📂 4. Category Analysis Page
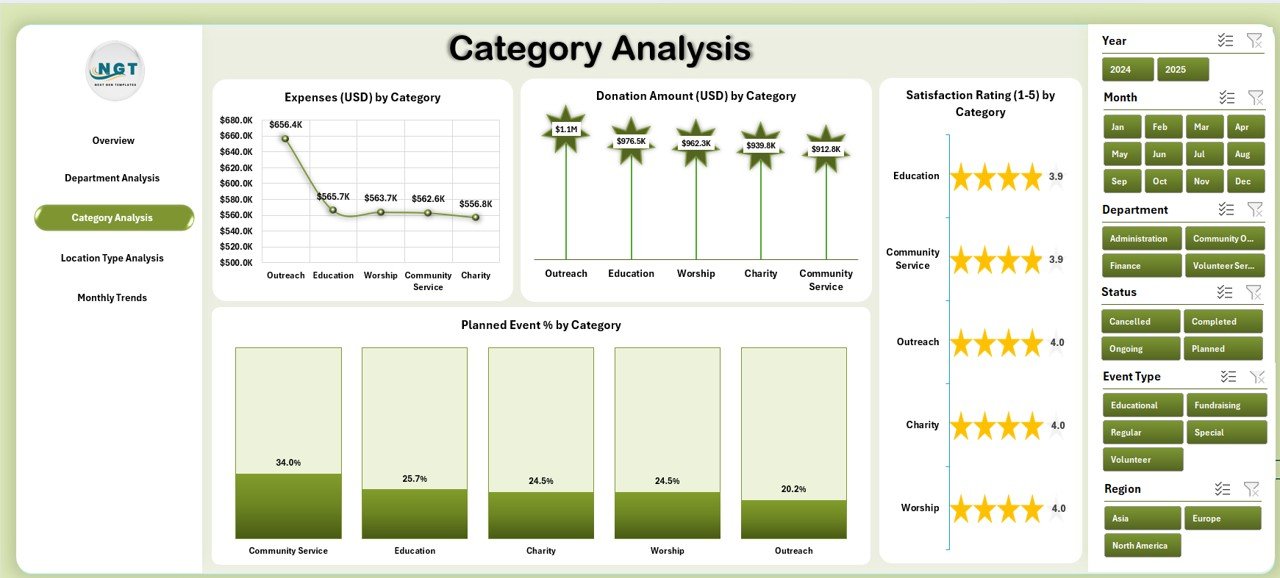
Faith-based organizations often conduct activities under multiple categories — such as education, charity, outreach, and cultural events. This page focuses on analyzing these categories.
Charts included:
-
Expense (USD) by Category
-
Donation Amount (USD) by Category
-
Satisfaction Rating (1–5) by Category
-
Planned Event % by Category
This enables leaders to see which types of programs or activities attract the most participation or donations.
Click to Purchases Religious & Faith-Based Organizations Dashboard in Excel
📍 5. Location Type Analysis Page
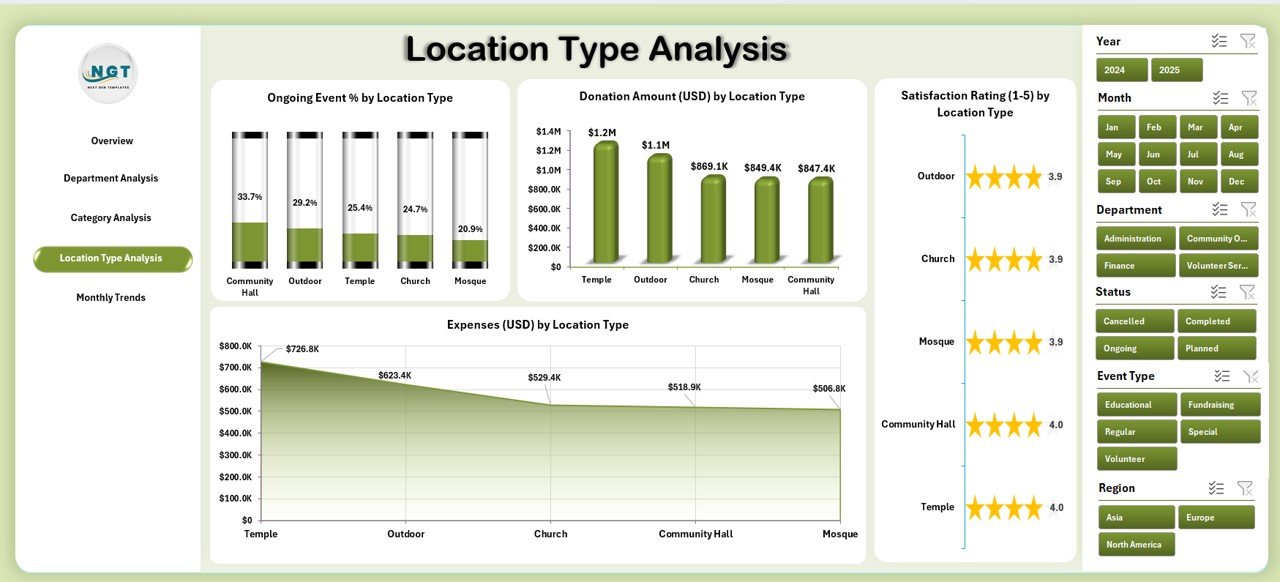
Geographical data plays a big role in community service and engagement. The Location Type Analysis page helps you understand how each location performs.
Charts included:
-
Ongoing Event % by Location
-
Donation Amount (USD) by Location
-
Satisfaction Rating (1–5) by Location
-
Expense (USD) by Location
This breakdown is ideal for regional or multi-branch organizations that want to optimize their resource allocation.
📅 6. Monthly Trends Page
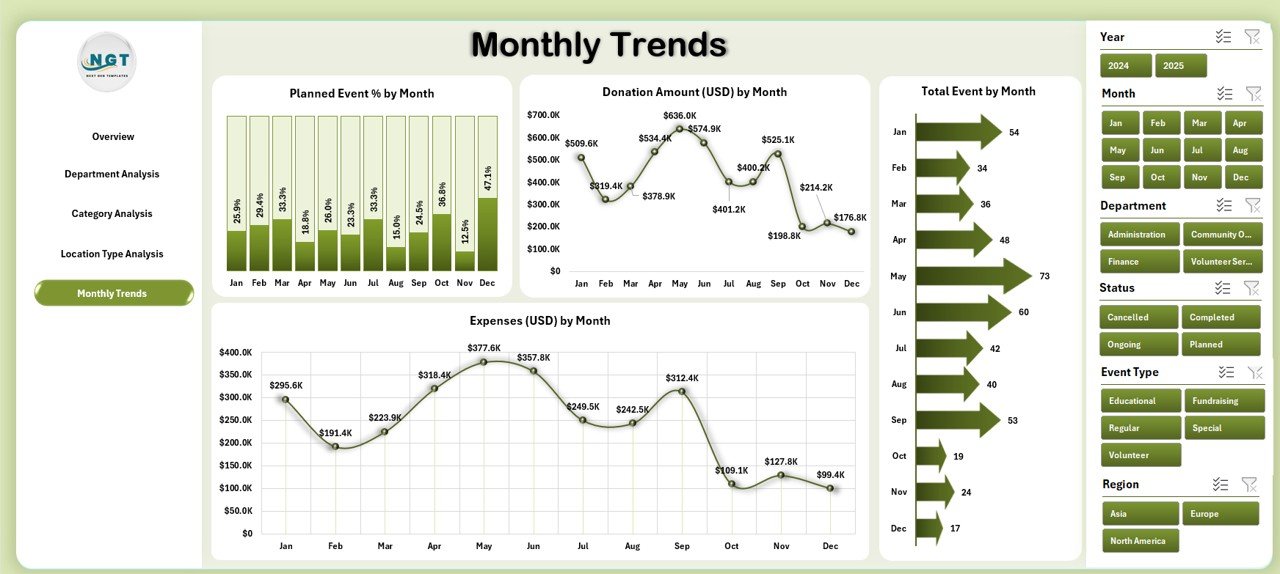
Consistency is the heart of any organization. The Monthly Trends Page offers insights into how key metrics change over time.
Charts included:
-
Planned Event % by Month
-
Donation Amount (USD) by Month
-
Expense (USD) by Month
-
Total Events by Month
This page allows you to identify seasonal donation spikes, cost variations, and event activity patterns — helping in strategic yearly planning.
🧾 Support and Data Sheets
The dashboard includes two technical sheets that power the visualizations:
-
Data Sheet: Stores all raw data entries such as expenses, donations, satisfaction ratings, and event details.
-
Support Sheet: Contains lookup lists, dropdown references, and configuration data that make the dashboard dynamic and user-friendly.
Why Use a Religious & Faith-Based Organizations Dashboard in Excel?
Managing a faith-based institution isn’t just about numbers — it’s about transparency, accountability, and community trust. This dashboard bridges the gap between management and community by offering clear visibility into operations.
Here’s why it’s essential:
✅ Improves transparency: Leaders can present data-backed reports to stakeholders and members.
💰 Tracks financial health: Keeps an eye on donations, expenses, and fund allocation.
📅 Optimizes event management: Analyzes participation rates and event costs efficiently.
🧍♂️ Enhances satisfaction tracking: Monitors ratings to improve volunteer and attendee experiences.
🕊️ Strengthens decision-making: Empowers management with actionable insights for better stewardship.
📘 How Does the Dashboard Work?
The dashboard runs on simple Excel formulas and charts connected to your data sheet. Each chart automatically updates when new data is entered.
Here’s how it functions step-by-step:
-
Data Input: Enter or paste data into the Data Sheet. Include metrics such as donations, expenses, categories, and event details.
-
Automatic Calculation: The dashboard uses formulas and pivot tables to aggregate key figures.
-
Visualization: The data is represented visually using charts, cards, and conditional formatting.
-
Filtering and Slicers: Use slicers to filter by month, region, category, or department.
-
Instant Insights: The main dashboard updates automatically, providing real-time results.
This automation saves hours of manual work and reduces the risk of human error.
Advantages of Religious & Faith-Based Organizations Dashboard in Excel
Implementing this dashboard offers a long list of benefits for both administrators and community leaders.
📈 1. Real-Time Performance Tracking
You can track all donations, events, and expenses as they occur, ensuring you stay updated at all times.
🧮 2. Simple and Cost-Effective
Unlike expensive software, Excel-based dashboards are free to use and require no extra tools or subscriptions.
🕊️ 3. Transparency and Accountability
Faith organizations rely on trust. By maintaining accurate and transparent records, this dashboard enhances donor and volunteer confidence.
🤝 4. Easy Collaboration
Share your dashboard with other leaders or departments for real-time collaboration using Microsoft OneDrive or Google Drive.
🧠 5. Data-Driven Decision Making
View meaningful insights through visuals that help in making quick, evidence-based decisions.
🧍♀️ 6. Improved Resource Allocation
Identify high-performing regions or departments and reallocate funds or volunteers accordingly.
💬 7. Enhanced Communication
Use the dashboard in meetings to present results clearly and strengthen communication among staff and members.
⚖️ Opportunities for Improvement
While the Excel dashboard is robust, continuous enhancement ensures better efficiency. Here are a few ways to improve it:
🧩 Add automation: Use VBA or Power Query to automate data imports.
🕹️ Integrate external data: Connect with online donation systems or survey tools.
💡 Include sentiment analysis: Use formulas to analyze textual feedback from event attendees.
📧 Email summaries: Automate weekly reports to key decision-makers.
📱 Mobile compatibility: Optimize it for mobile viewing through Excel Online.
Best Practices for the Religious & Faith-Based Organizations Dashboard
To get the best results from your dashboard, follow these proven best practices:
-
Keep your data clean:
Ensure that all records are accurate and standardized (e.g., consistent date formats, currency, and rating scales). -
Regularly update the data:
Refresh your data monthly or after every major event for up-to-date results. -
Use consistent naming conventions:
Avoid confusion by keeping departments, categories, and regions uniform. -
Protect sensitive information:
Use Excel’s password protection or restrict editing access to authorized users only. -
Visualize only what matters:
Avoid cluttering the dashboard with too many charts; focus on key KPIs like donations, expenses, and event satisfaction. -
Compare MTD and YTD performance:
Always monitor both Month-to-Date and Year-to-Date trends to understand short-term and long-term progress. -
Customize the color scheme:
Align your dashboard’s visuals with your organization’s theme or branding for a professional look.
🧭 Use Cases of the Religious & Faith-Based Organizations Dashboard
This Excel tool fits perfectly across multiple scenarios:
-
Church Management: Track tithes, offerings, and member participation.
-
Temple Administration: Monitor donations by festival and region.
-
Mosque Committees: Manage charity drives, Zakat funds, and event planning.
-
Faith-Based NGOs: Measure project effectiveness and donor satisfaction.
-
Event Organizers: Analyze religious festivals, retreats, or community gatherings for efficiency.
Technical Setup and Customization
Click to Purchases Religious & Faith-Based Organizations Dashboard in Excel
Setting up the dashboard is simple and requires no coding skills.
Step 1: Input Data
Open the Data Sheet and add entries for events, categories, donations, satisfaction scores, and expenses.
Step 2: Refresh Dashboard
Click “Refresh All” under the Data tab. All visuals and summary cards update automatically.
Step 3: Add Filters
Use slicers for quick filtering by month, location, or department.
Step 4: Save and Share
Save the file and share it with your team through Excel Online, OneDrive, or any preferred medium.
Step 5: Customize
Rename sheets, adjust chart colors, and modify KPIs to match your faith-based organization’s goals.
Real-Life Benefits for Faith-Based Organizations
This Excel dashboard has practical applications that drive real results:
-
Transparency with donors: Donors can see how funds are utilized across different programs.
-
Improved community engagement: By tracking event satisfaction, you can enhance the worship experience.
-
Financial accountability: Easily compare expenses against donations to maintain fiscal discipline.
-
Performance reviews: Departments and organizers can analyze their impact and efficiency.
-
Strategic growth: Long-term data helps in planning future events, outreach, and expansion.
How to Analyze Data Using the Dashboard
-
Select a Time Frame: Use slicers to focus on a specific month or period.
-
Review KPIs: Look at key metrics like donation trends and event satisfaction.
-
Drill Down by Category or Region: Identify what’s working best and where improvements are needed.
-
Export Reports: Share insights with stakeholders using Excel’s “Export to PDF” feature.
This step-by-step analysis allows faith leaders to make fast, data-backed decisions that align with their mission.
Conclusion
The Religious & Faith-Based Organizations Dashboard in Excel isn’t just a reporting tool — it’s a mission enabler. It empowers faith leaders to manage resources, improve transparency, and make informed decisions that strengthen community trust.
By combining simplicity, automation, and insightful visualization, this dashboard bridges the gap between faith and data. Whether you manage a small local temple or a global religious network, this tool gives you the clarity and control you need to lead effectively.
❓ Frequently Asked Questions (FAQs)
1. What is the main purpose of the Religious & Faith-Based Organizations Dashboard in Excel?
The main purpose is to help religious organizations track donations, expenses, event performance, and satisfaction ratings in one central dashboard.
2. Can I customize the KPIs in the dashboard?
Yes, the dashboard is fully customizable. You can modify KPI names, categories, and formulas according to your organization’s goals.
3. Do I need any special software to use this dashboard?
No. You only need Microsoft Excel (2016 or later). The dashboard works entirely offline.
4. How often should I update the data?
You should update the data after every major event or at least once a month to maintain accuracy.
5. Can this dashboard handle multiple locations or departments?
Absolutely. It includes filters that allow analysis by department, region, or location type.
6. Is the dashboard suitable for small organizations?
Yes. It works perfectly for both small and large organizations due to its scalable structure.
7. Does the dashboard include charts and visuals?
Yes. It contains interactive charts such as expenses by event type, donation trends, and satisfaction ratings.
8. Can I share the dashboard with my team?
Yes, you can share it through Excel Online, OneDrive, or any secure file-sharing platform for collaborative access.
9. How can this dashboard improve transparency?
It provides clear, visual financial and operational data that can be shared with donors, volunteers, and members to build trust.
10. Where can I get this template?
You can download the Religious & Faith-Based Organizations Dashboard in Excel from NextGenTemplates.com or your preferred Excel template platform.
Visit our YouTube channel to learn step-by-step video tutorials