In today’s fast-changing business landscape, innovation and transformation are not optional — they are essential. Companies that continuously innovate and transform stay competitive, agile, and future-ready. However, tracking innovation performance and transformation progress can be complex without a centralized system.
That’s where the Innovation and Transformation KPI Dashboard in Power BI comes in. This powerful analytical tool consolidates key performance indicators (KPIs) into a dynamic and visual format, helping leaders make quick, data-driven decisions.
In this article, we’ll explore what this dashboard is, how it works, its structure, key benefits, and best practices. You’ll also find a section on frequently asked questions to help you understand it completely.
Click to Purchases Innovation and Transformation KPI Dashboard in Power BI
🌟 What Is an Innovation and Transformation KPI Dashboard in Power BI?
An Innovation and Transformation KPI Dashboard in Power BI is a ready-to-use, interactive reporting system designed to monitor, measure, and analyze innovation and transformation initiatives across an organization.
Built using Microsoft Power BI, this dashboard provides a real-time visual representation of innovation performance — from idea generation to implementation — along with digital transformation KPIs such as technology adoption, process automation, and ROI from innovation projects.
Because it’s built in Power BI, it offers:
-
💡 Real-time visualization of all innovation KPIs.
-
🌐 Seamless integration with Excel, databases, or cloud systems.
-
📊 Interactive slicers and drill-throughs for quick insights.
-
🔁 Automated updates for continuous tracking.
🧩 Why Use Power BI for Innovation and Transformation Tracking?
Power BI is one of the most advanced tools for business intelligence and performance tracking. Here’s why it’s ideal for innovation management:
-
Centralized Data View: Combines innovation data from Excel, internal databases, or cloud services.
-
Real-Time Monitoring: Updates automatically as soon as new data is entered.
-
Customizable Dashboards: Allows users to tailor visuals and metrics to specific goals.
-
Smart Analysis Tools: Offers trend analysis, comparisons, and interactive visuals for deeper insights.
-
Collaborative Sharing: Enables teams to access reports securely and make informed decisions together.
🧭 Structure of the Innovation and Transformation KPI Dashboard in Power BI
This Power BI dashboard file includes three interactive pages, each serving a unique analytical purpose:
1️⃣ Summary Page – The Main Performance Hub
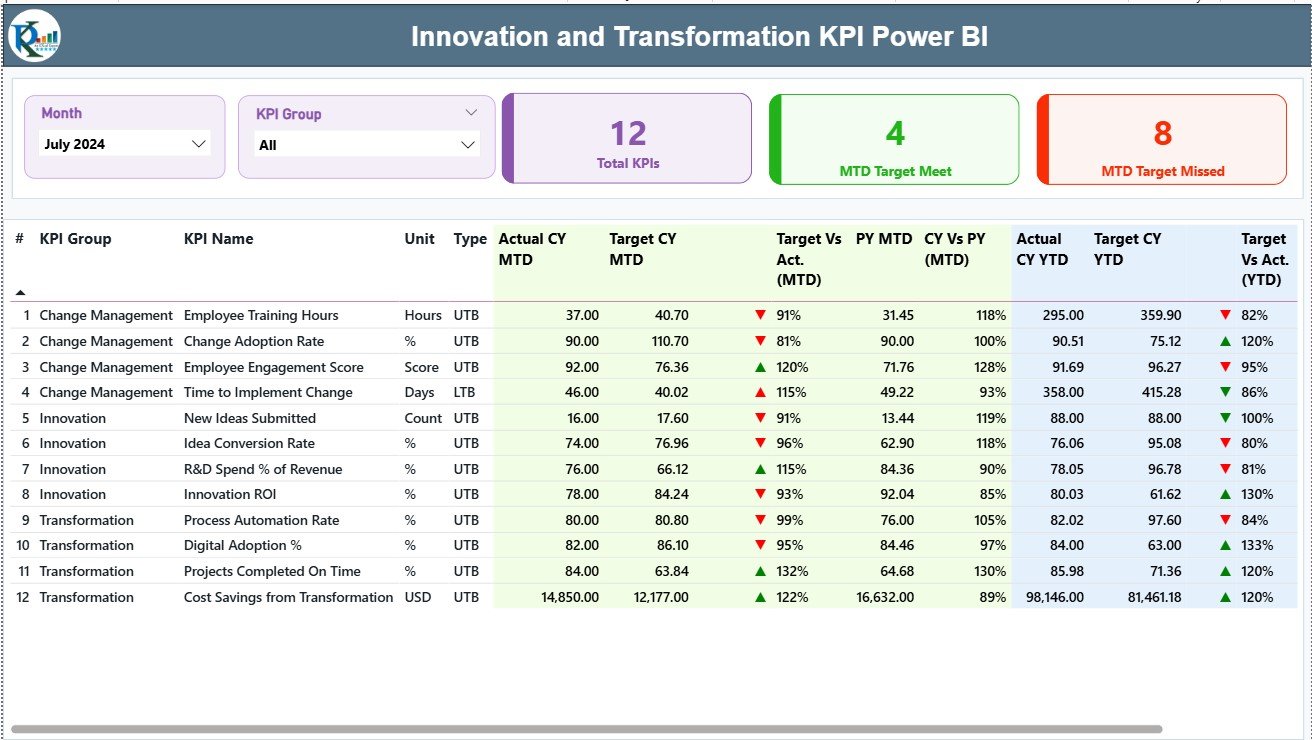
The Summary Page is the central view of the dashboard where users can quickly evaluate the organization’s innovation and transformation performance.
Key Components:
-
Month and KPI Group Slicers: Allow quick filtering to focus on a specific period or KPI category.
-
Performance Cards:
-
🧾 Total KPIs Count – Displays the number of KPIs being tracked.
-
✅ MTD Target Met Count – Shows how many KPIs have achieved their targets for the month.
-
⚠️ MTD Target Missed Count – Displays KPIs that did not meet their targets.
-
KPI Table Details:
2️⃣ KPI Trend Page – Visualizing Progress Over Time
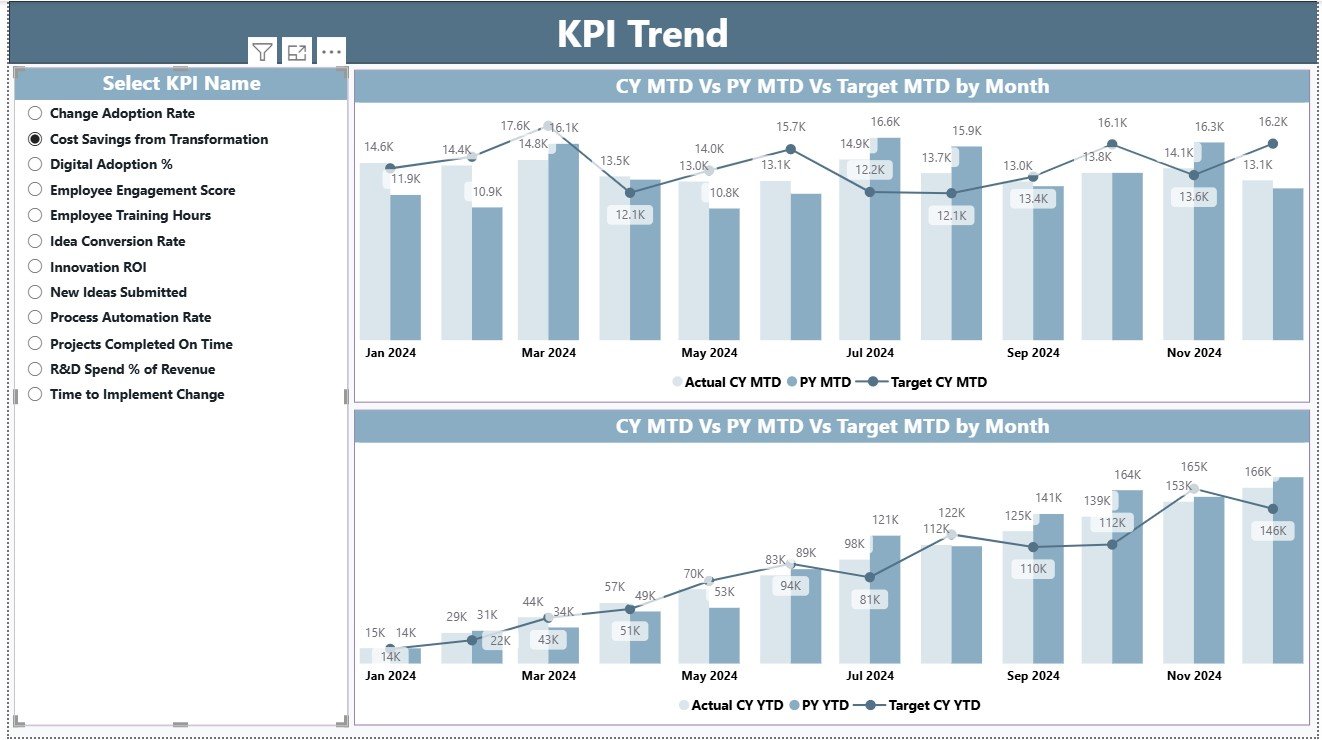
The KPI Trend Page provides a deeper look into how KPIs are performing month by month.
Features:
-
Combo Charts:
Two charts display MTD and YTD comparisons for Actual, Target, and Previous Year values. -
KPI Selector:
A slicer on the left lets you choose any KPI name to view its specific trend.
This page helps identify trends, performance gaps, and seasonality — allowing managers to spot consistent growth or recurring issues quickly.
3️⃣ KPI Definition Page – Understanding Each Metric
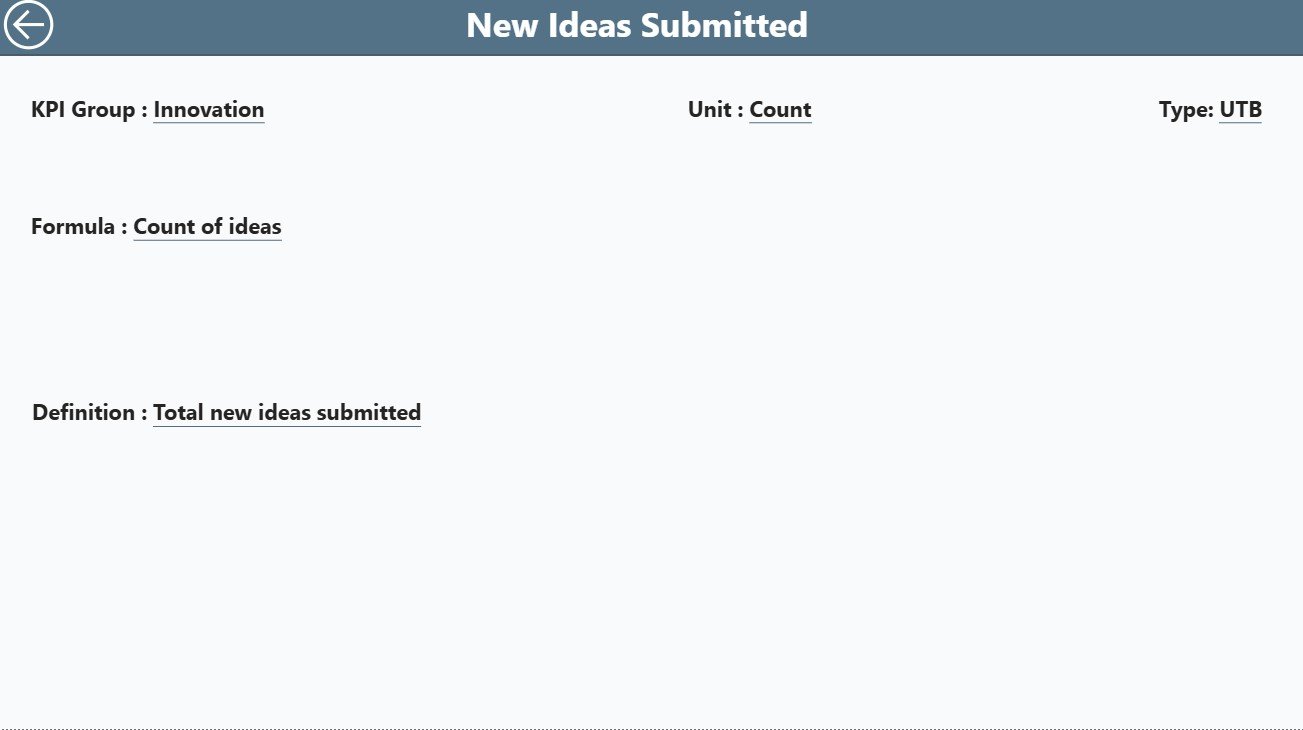
The KPI Definition Page is a hidden drill-through section.
You can access it by right-clicking on a KPI from the Summary Page and choosing “Drill Through → KPI Definition.”
This page shows:
-
KPI Formula
-
KPI Definition
-
Measurement Unit
-
Performance Type (UTB or LTB)
There’s also a Back Button at the top-left corner to return to the Summary Page easily.
This section ensures transparency in how each metric is calculated, helping users trust the results.
📘 Data Source – Excel Integration
This dashboard uses an Excel file as its backend data source. The Excel file contains three worksheets that keep the data organized and easy to maintain.
Click to Purchases Innovation and Transformation KPI Dashboard in Power BI
🧾 1. Input_Actual Sheet
-
Enter the KPI Name, Month (using the first date of each month), MTD, and YTD actuals.
-
These numbers feed the Power BI visuals automatically once refreshed.
🎯 2. Input_Target Sheet
-
Enter the Target values for each KPI along with Month, MTD, and YTD figures.
-
These serve as benchmarks for comparison.
🧮 3. KPI Definition Sheet
-
Contains all reference details like KPI Number, Group, Formula, Definition, Unit, and Type (UTB or LTB).
-
This ensures every KPI is clearly documented and traceable.
🚀 Advantages of Using an Innovation and Transformation KPI Dashboard in Power BI
Tracking innovation through a KPI dashboard delivers measurable benefits for organizations of all sizes.
✅ 1. Centralized Performance Visibility
Get all innovation and transformation metrics in one place. This saves time and reduces manual reporting efforts.
✅ 2. Faster Decision-Making
Interactive visuals and instant updates help management teams identify trends and act immediately.
✅ 3. Real-Time Data Analysis
Power BI automatically refreshes data from Excel or cloud databases, ensuring that decisions are based on the latest numbers.
✅ 4. Enhanced Collaboration
Teams can access and share reports securely via Power BI Service, ensuring consistent communication across departments.
✅ 5. Continuous Improvement
Trend analysis over months or years helps track long-term progress and identify areas for improvement.
Click to Purchases Innovation and Transformation KPI Dashboard in Power BI
📈 How to Use the Dashboard Effectively
To make the most out of your Innovation and Transformation KPI Dashboard, follow these simple steps:
-
Connect Your Excel Data:
Update the three Excel sheets — Input_Actual, Input_Target, and KPI Definition. -
Open Power BI Desktop:
Load the Power BI file and refresh data connections. -
Review Summary Page:
Use slicers to view monthly or group-wise performance. -
Drill Down for Insights:
Right-click on any KPI to drill through to its detailed definition and formula. -
Track Trends:
Use the KPI Trend Page to understand how KPIs perform over time. -
Share and Collaborate:
Publish the report to Power BI Service for team access.
💡 Best Practices for Using the Innovation and Transformation KPI Dashboard
To ensure accurate insights and long-term success, follow these best practices:
-
Keep KPI Definitions Clear:
Ensure all team members understand what each KPI measures. -
Maintain Consistent Data Entry:
Use standardized formats in Excel (e.g., date as the first day of the month). -
Regularly Refresh Data:
Schedule automatic refreshes in Power BI to avoid stale numbers. -
Balance Quantitative and Qualitative KPIs:
Don’t rely solely on numeric data; track cultural or behavioral innovation metrics too. -
Customize Visuals:
Adjust charts and slicers based on management needs for better storytelling. -
Use Color Coding Wisely:
Green and red icons help instantly visualize progress or underperformance. -
Encourage Departmental Involvement:
Assign ownership for each KPI to improve accountability.
📊 Opportunities for Improvement
Even a strong dashboard can evolve further. Here are areas to enhance performance and usability:
-
🔍 Add Predictive Analytics:
Use Power BI’s AI capabilities to forecast innovation success or project timelines. -
🧭 Include Benchmarking:
Compare current innovation KPIs with industry standards. -
🕒 Track ROI of Transformation Initiatives:
Add financial impact visuals like cost savings or efficiency gain metrics. -
🌍 Integrate Multiple Data Sources:
Combine Excel data with APIs, CRM, or ERP systems for a broader view. -
💬 Add Employee Feedback KPIs:
Track innovation sentiment and cultural readiness for change.
🔧 Customization Possibilities
The dashboard is highly flexible. You can easily:
-
Add or remove KPIs.
-
Modify visuals, colors, and layout.
-
Integrate with SQL Server, SharePoint, or Azure Data Lake.
-
Enable automated email alerts for performance deviations.
-
Create role-based dashboards for executives, managers, and analysts.
📘 Example Scenario: How Businesses Use It
Let’s take an example of a manufacturing company adopting automation and new technologies.
-
The Summary Page shows KPIs like “Automation Coverage” and “Innovation ROI.”
-
The Trend Page helps visualize improvement month by month.
-
The KPI Definition Page clarifies formulas, so everyone understands what each KPI means.
-
Managers use the dashboard to compare YTD vs. target data.
-
The leadership team reviews insights to plan future digital investments.
By implementing this dashboard, the company reduces manual reporting time by 80% and accelerates decision-making.
Click to Purchases Innovation and Transformation KPI Dashboard in Power BI
🏁 Conclusion
The Innovation and Transformation KPI Dashboard in Power BI is a must-have tool for any organization aiming to measure creativity, digital progress, and strategic transformation.
It provides clarity on what’s working, where to improve, and how innovation contributes to long-term success.
With interactive visuals, automated data connections, and deep insights, Power BI makes innovation measurable, actionable, and impactful.
🌐 Ready to Transform Your Innovation Strategy?
Download the Innovation and Transformation KPI Dashboard in Power BI today and empower your business with real-time performance intelligence!
❓ Frequently Asked Questions (FAQs)
1. What is the purpose of the Innovation and Transformation KPI Dashboard?
It helps organizations track, analyze, and improve their innovation and transformation initiatives using measurable KPIs.
2. Which data sources does this dashboard support?
You can connect it to Excel, SQL Server, SharePoint, or any cloud-based database compatible with Power BI.
3. Can I customize KPIs based on my organization’s goals?
Yes, you can add or remove KPIs, modify formulas, and adjust visuals to match your organization’s unique metrics.
4. How often should I update the data?
It’s recommended to refresh the data weekly or monthly, depending on how frequently performance data changes.
5. What are UTB and LTB types in KPIs?
UTB (Upper-the-Better) means higher values indicate better performance (e.g., profit margin).
LTB (Lower-the-Better) means lower values indicate better performance (e.g., defect rate).
6. Is this dashboard suitable for all industries?
Absolutely. It can be customized for sectors like manufacturing, healthcare, IT, finance, education, and more.
7. Do I need technical skills to use it?
No advanced skills are required. Basic Power BI knowledge and Excel familiarity are enough.
8. How does it improve decision-making?
It consolidates complex data into clear visuals, helping leaders identify performance trends and take informed actions.
9. Can multiple users access the same report?
Yes, if you publish it to Power BI Service, multiple users can view, filter, and collaborate securely.
10. Can I export visuals for presentations?
Yes, Power BI allows exporting visuals to PowerPoint or PDF for management reviews and board meetings.
Click to Purchases Innovation and Transformation KPI Dashboard in Power BI
Visit our YouTube channel to learn step-by-step video tutorials