In the modern era of city planning and infrastructure development, data plays a crucial role in decision-making. From budget allocation to project tracking, every number tells a story. However, managing vast datasets manually can be overwhelming and error-prone. That’s why the Housing & Urban Development Dashboard in Excel is a game-changing tool for professionals in government agencies, real estate development, and public policy planning.
This ready-to-use Excel dashboard helps users visualize housing projects, monitor budgets, analyze revenue, and assess performance across departments, categories, and city types — all in one centralized place.
In this comprehensive guide, you’ll learn what this dashboard is, how it works, its core features, advantages, best practices, and frequently asked questions to help you make the most of it.
Click to Purchases Housing & Urban Development Dashboard in Excel
What Is a Housing & Urban Development Dashboard in Excel?
A Housing & Urban Development Dashboard in Excel is an interactive performance-tracking tool designed to monitor key metrics related to urban planning, housing projects, and infrastructure management. Built entirely in Microsoft Excel, this dashboard helps stakeholders track performance indicators such as project completion rates, departmental expenses, profit margins, and city-level outcomes.
Unlike static spreadsheets, this dashboard transforms raw data into dynamic charts, visuals, and summaries that can be updated automatically with new data. With just a few clicks, decision-makers can identify trends, evaluate project health, and make informed choices that drive growth and sustainability.
Why Use Excel for Housing & Urban Development Analytics?
Excel remains one of the most powerful and accessible data management tools worldwide. Here’s why it’s ideal for housing and urban development analytics:
💼 Familiar Platform: No need for expensive software or complex training.
📊 Advanced Visuals: Supports charts, slicers, and interactive dashboards.
⚙️ Automation: Easily integrates formulas, pivot tables, and macros.
🌐 Scalability: Suitable for small teams and large-scale government projects.
🔄 Customization: Fully editable — add KPIs, modify visuals, or integrate new data sources.
When combined with structured templates like the Housing & Urban Development Dashboard, Excel becomes an all-in-one data visualization powerhouse.
Key Features of the Housing & Urban Development Dashboard in Excel
This dashboard template includes a well-organized layout with five analytical pages and a data sheet to capture and manage all underlying metrics.
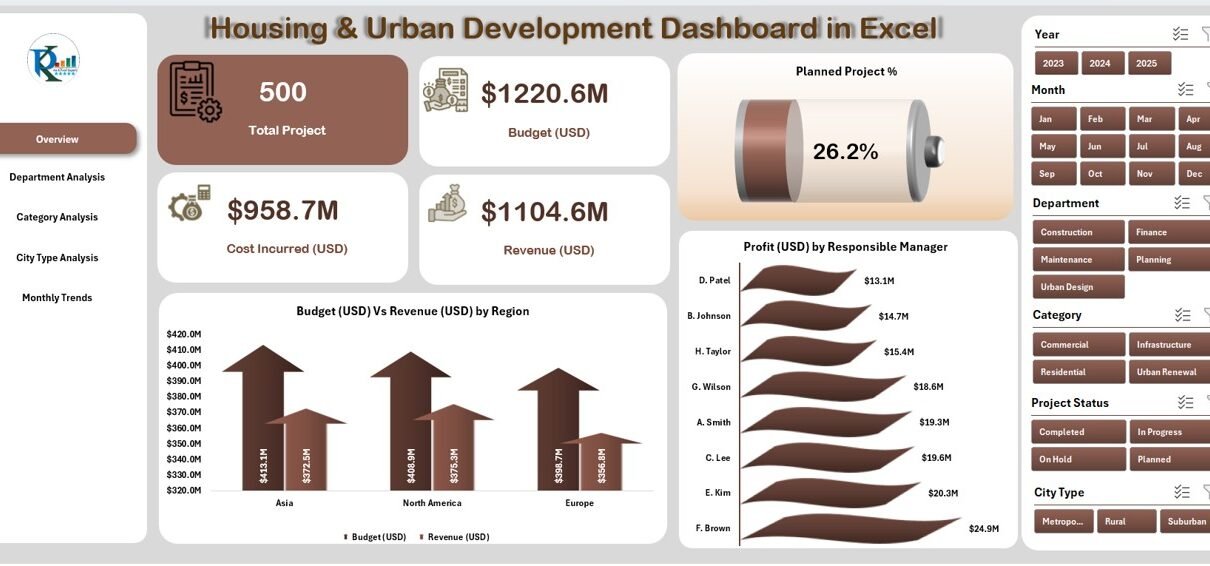
1️⃣ Overview Page
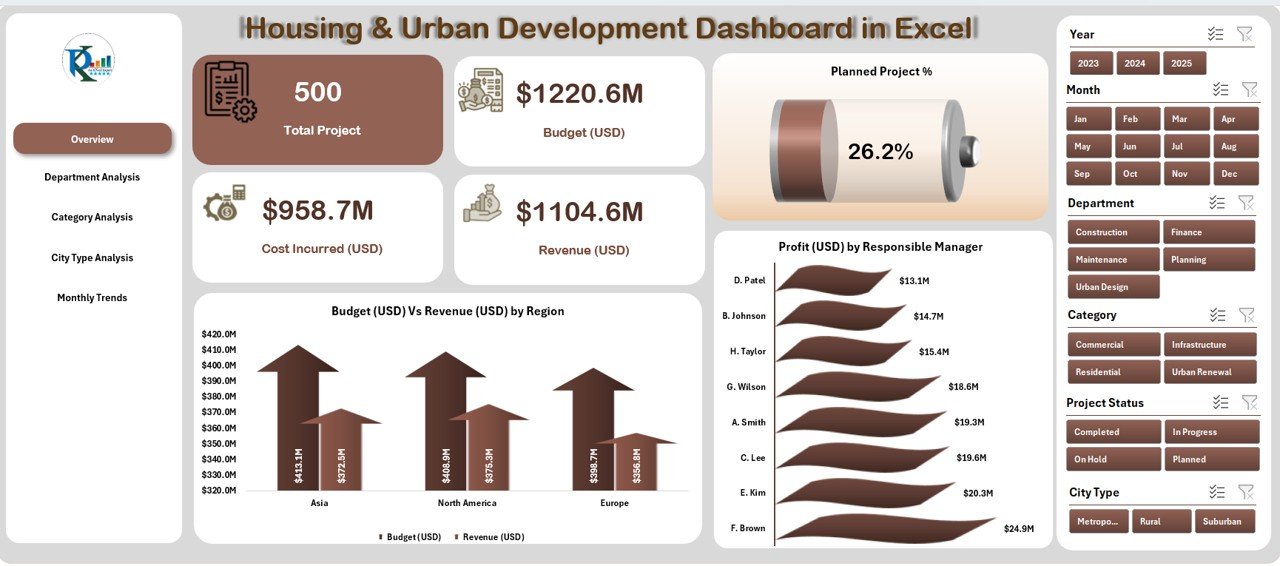
The Overview Page is the central hub of the dashboard — a visual summary of all major indicators. It allows top-level decision-makers to get instant insights into project progress, financial performance, and profitability.
Main Components:
-
Page Navigator: Located on the left side, it enables quick navigation between analytical pages.
-
KPI Cards: Highlight key statistics such as Total Projects, Budget Utilization, and Profit Margin.
Charts Displayed:
- Planned Project (%)
- Budget (USD) vs. Revenue (USD) by Region
- Profit (USD) by Responsible Manager
2️⃣ Department Analysis
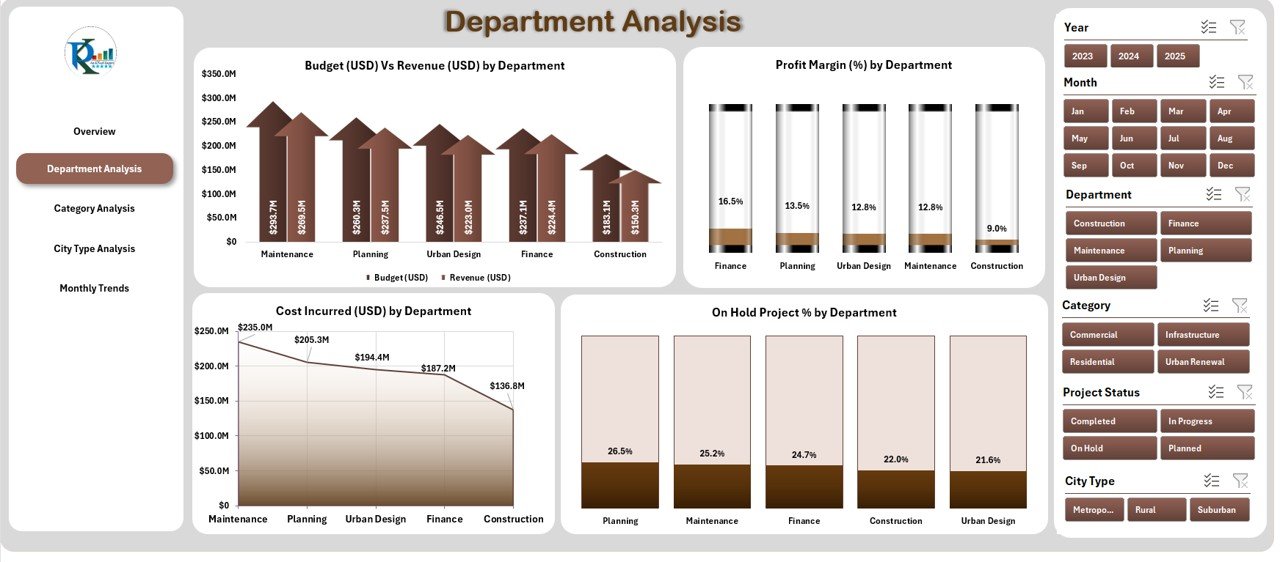
The Department Analysis Page provides deeper insights into financial and operational performance across various departments.
Charts Included:
-
Budget (USD) vs. Revenue (USD) by Department
-
Profit Margin (%) by Department
-
Cost Incurred (USD) by Department
-
On-Hold Project (%) by Department
This section helps identify which departments are driving success and which need process improvement or additional support.
3️⃣ Category Analysis
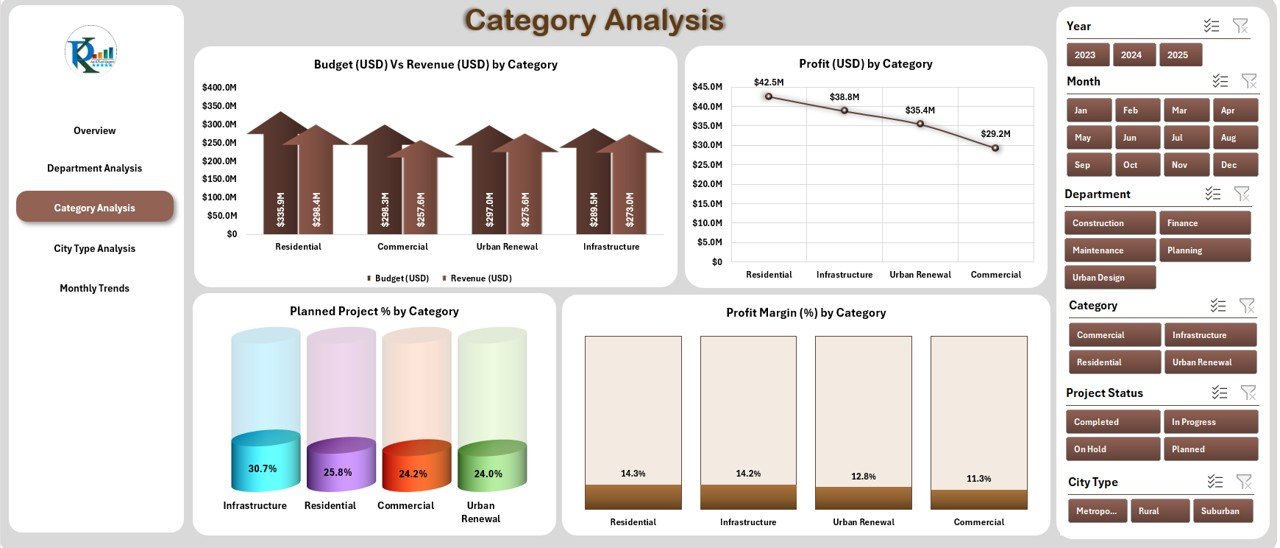
The Category Analysis Page enables comparison across project categories (such as Affordable Housing, Urban Renewal, or Smart City Projects).
Visual Insights:
-
Budget (USD) vs. Revenue (USD) by Category
-
Profit Margin (%) by Category
-
Planned Project (%) by Category
-
Cost Incurred (USD) by Category
✅ Use this view to evaluate which project types yield the best returns or require better planning and funding.
Click to Purchases Housing & Urban Development Dashboard in Excel
4️⃣ City Type Analysis
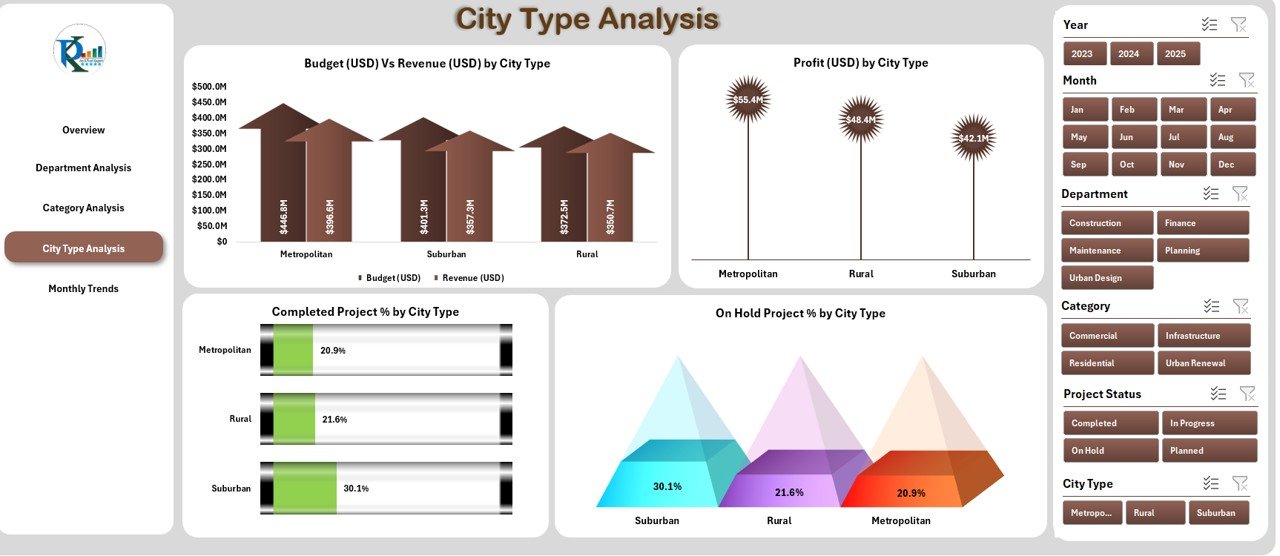
Urban development projects differ widely based on the type of city — metropolitan, suburban, or rural. The City Type Analysis Page provides performance comparison across these segments.
Key Charts:
-
Budget (USD) vs. Revenue (USD) by City Type
-
Profit Margin (%) by City Type
-
Completed Project (%) by City Type
-
On-Hold Project (%) by City Type
This analysis helps policymakers allocate resources strategically and identify underperforming regions.
5️⃣ Monthly Trends
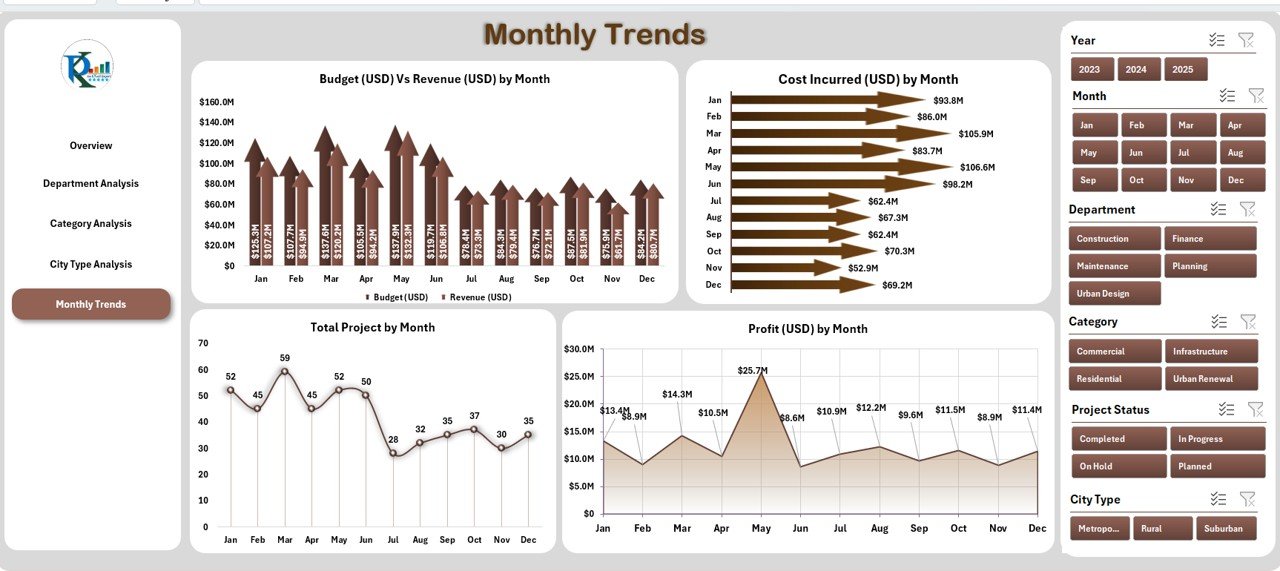
The Monthly Trends Page captures time-based performance, giving insights into how projects evolve throughout the year.
Displayed Charts:
-
Budget (USD) vs. Revenue (USD) by Month
-
Cost Incurred (USD) by Month
-
Total Projects by Month
-
Profit (USD) by Month
📅 This page is ideal for tracking seasonal variations and understanding how project performance changes over time.
6️⃣ Support Sheet & Data Sheet
The Data Sheet acts as the backbone of the dashboard — this is where all raw data entries are made. It includes project details such as budget, revenue, cost, department, manager, city type, and project status.
The Support Sheet manages dropdown lists and reference data, ensuring that all slicers and filters work seamlessly across the workbook.
🧠 How to Use the Housing & Urban Development Dashboard in Excel
Using this dashboard is simple, even for beginners. Here’s how you can make the most of it:
-
Enter or Import Data:
Add project details, budgets, revenue, and profit numbers to the Data Sheet. -
Refresh the Dashboard:
Use Excel’s refresh or pivot update feature to automatically update visuals. -
Navigate Between Pages:
Click through the page navigator buttons on the left to switch between analyses. -
Analyze Trends and Compare KPIs:
Use charts and slicers to filter data by department, region, category, or month. -
Make Data-Driven Decisions:
Review underperforming areas and take corrective action based on insights.
💡 Benefits of Using the Housing & Urban Development Dashboard
The advantages of using this Excel-based tool extend far beyond data visualization. It helps create a data-driven culture within the organization.
Key Benefits:
-
✅ Centralized Reporting: Combines all project and financial data into one unified dashboard.
-
📈 Real-Time Analysis: Provides up-to-date metrics on budget, revenue, and profitability.
-
🧩 Actionable Insights: Helps identify departments or regions needing intervention.
-
💰 Financial Control: Tracks spending and revenue to prevent budget overruns.
-
🕒 Time Efficiency: Eliminates manual calculations and repetitive data formatting.
-
🧮 Scalable: Suitable for local, regional, or national-level housing projects.
-
📊 Presentation-Ready Visuals: Ideal for management reviews, stakeholder meetings, and government reports.
🏘️ Applications of This Dashboard
This dashboard can be used in various real-world contexts:
-
🏢 Government Housing Departments — To track affordable housing and urban renewal programs.
-
🏗️ Real Estate Developers — To monitor multi-city residential or commercial projects.
-
🌆 Municipal Corporations — For managing infrastructure upgrades, roads, and public facilities.
-
💼 Consulting Firms — To evaluate and report on city development metrics.
🚀 Advantages of the Housing & Urban Development Dashboard in Excel
Let’s explore the top advantages that make this dashboard essential:
-
Simplified Reporting:
Automates manual data analysis and provides visual clarity. -
Enhanced Decision-Making:
Empowers managers with data-backed insights for smarter investments. -
Better Financial Transparency:
Offers a clear picture of budget vs. revenue to improve accountability. -
Performance Monitoring:
Tracks progress across departments, cities, and project categories in real-time. -
Customizable and Scalable:
Add new KPIs, regions, or visuals easily to match your organization’s needs.
🏆 Opportunities for Improvement
Even the best systems can evolve. Here are areas where organizations can enhance their dashboard usage:
-
🔄 Integrate with Power BI: Combine Excel with Power BI for richer visual storytelling.
-
☁️ Cloud Collaboration: Use Excel Online or SharePoint for real-time updates.
-
📥 Automated Data Import: Link external data sources (like ERP or project management tools).
-
📊 KPI Expansion: Include social metrics such as housing accessibility or sustainability index.
-
🧩 AI Integration: Incorporate predictive analytics for project forecasting.
🌟 Best Practices for the Housing & Urban Development Dashboard
Follow these best practices to make your dashboard efficient, accurate, and impactful:
-
Maintain Data Consistency:
Ensure all data entries follow the same format and unit of measure. -
Use Conditional Formatting:
Highlight high-risk projects or budget overruns with color cues. -
Regularly Update Data:
Refresh pivot tables and charts monthly or quarterly for accurate results. -
Validate Input Data:
Use drop-down lists and data validation to prevent entry errors. -
Secure the Workbook:
Protect sensitive financial and project data with passwords. -
Document KPIs:
Maintain a separate sheet that defines all KPIs and calculation formulas. -
Visual Simplicity:
Avoid clutter — focus on the most relevant visuals and insights. -
Train Team Members:
Conduct quick training sessions to help staff use the dashboard effectively.
📉 Example KPIs You Can Track
Click to Purchases Housing & Urban Development Dashboard in Excel
To make this dashboard even more powerful, you can include KPIs such as:
-
Total Projects
-
Budget Utilization %
-
Revenue Growth %
-
Profit Margin %
-
Cost per Project
-
Project Completion %
-
On-Hold Project %
-
Average Project Duration
-
Budget Variance %
-
Department-Wise ROI
Each KPI provides unique insight into organizational efficiency and financial performance.
🧮 How to Customize This Dashboard
Excel’s flexibility allows you to modify this dashboard easily. Here’s how you can tailor it:
-
Add New KPIs: Insert columns for metrics like occupancy rate or sustainability score.
-
Change Chart Types: Use pie charts, bar charts, or heatmaps as per your preference.
-
Modify Themes: Adjust colors and styles to match your company’s branding.
-
Integrate Slicers: Add filters for city, year, or manager for dynamic insights.
-
Expand Data Sources: Link multiple data tables for complex reporting needs.
🏁 Conclusion
The Housing & Urban Development Dashboard in Excel is not just a spreadsheet — it’s a strategic decision-making tool. It helps planners, managers, and policymakers gain clarity, improve transparency, and accelerate progress across housing and urban projects.
By using this dashboard, organizations can move beyond manual reporting and embrace a modern, visual, and data-driven approach. Whether you’re tracking affordable housing initiatives, budget utilization, or profit margins, this tool puts actionable insights right at your fingertips.
With consistent updates and the best practices outlined above, you’ll ensure your housing development initiatives remain efficient, accountable, and sustainable.
❓ Frequently Asked Questions (FAQs)
1. What is the main purpose of the Housing & Urban Development Dashboard in Excel?
It helps track and analyze financial, operational, and project performance metrics for housing and urban development initiatives using visual reports and KPIs.
2. Can I use this dashboard for government and private projects?
Yes. It’s suitable for both government agencies managing housing programs and private real estate firms handling multiple projects.
3. Is the dashboard fully editable?
Absolutely. You can edit formulas, charts, colors, and KPI definitions to match your organizational needs.
4. How often should I update the data?
Ideally, update it monthly or quarterly to ensure the charts reflect the latest numbers and trends.
5. Can I integrate this dashboard with other tools?
Yes. You can connect it with Power BI, Google Sheets, or databases for automated updates and enhanced reporting.
6. Do I need advanced Excel skills to use it?
Not at all. Basic knowledge of Excel functions and pivot tables is enough to manage and update the dashboard.
Visit our YouTube channel to learn step-by-step video tutorials