Running a food and beverage (F&B) business involves constant decision-making. Whether it’s tracking sales revenue, monitoring ingredient costs, or evaluating performance by category, managers must keep a close eye on numbers. However, managing all this data manually can be challenging. That’s where a Food and Beverage Report in Excel becomes a game-changer.
This ready-to-use Excel template allows restaurant owners, catering companies, hotels, and food distributors to monitor all critical performance indicators in one place. It simplifies data analysis and enables managers to make faster, smarter business decisions.
Click to Purchases Food and Beverage Report in Excel
What Is a Food and Beverage Report in Excel?
A Food and Beverage Report in Excel is a powerful analytical tool designed to summarize and visualize your operational performance. It consolidates multiple data sources—such as cost, sales, region, and department—into interactive dashboards and reports.
Unlike complex accounting systems, this Excel-based report is easy to use and customize. You can filter, compare, and visualize your business metrics in seconds.
This tool helps you track essential parameters such as:
-
Cost vs Sales by Product Category
-
Regional performance and availability percentage
-
Department-wise sales and cost
-
Monthly revenue and expense trends
By turning data into visuals, the report helps you spot opportunities, identify inefficiencies, and plan business improvements quickly.
Key Features of the Food and Beverage Report in Excel
This template includes three primary pages that make performance monitoring effortless and visually appealing. Each page is designed for specific analytical purposes and can be updated easily as your data grows.
1. Summary Page
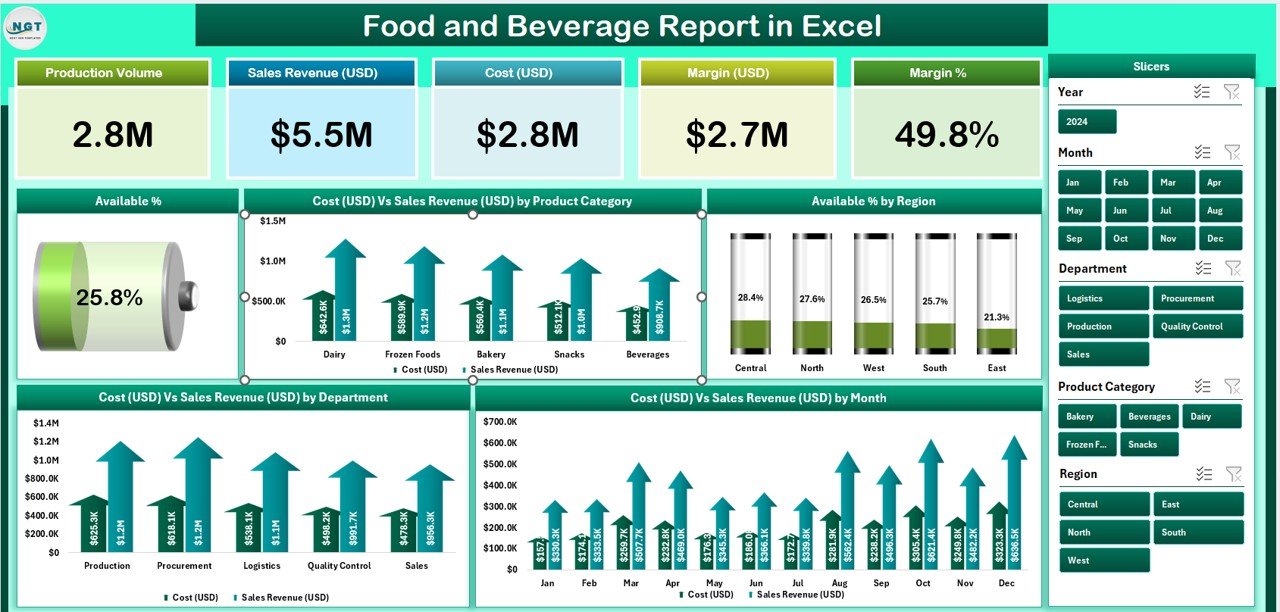
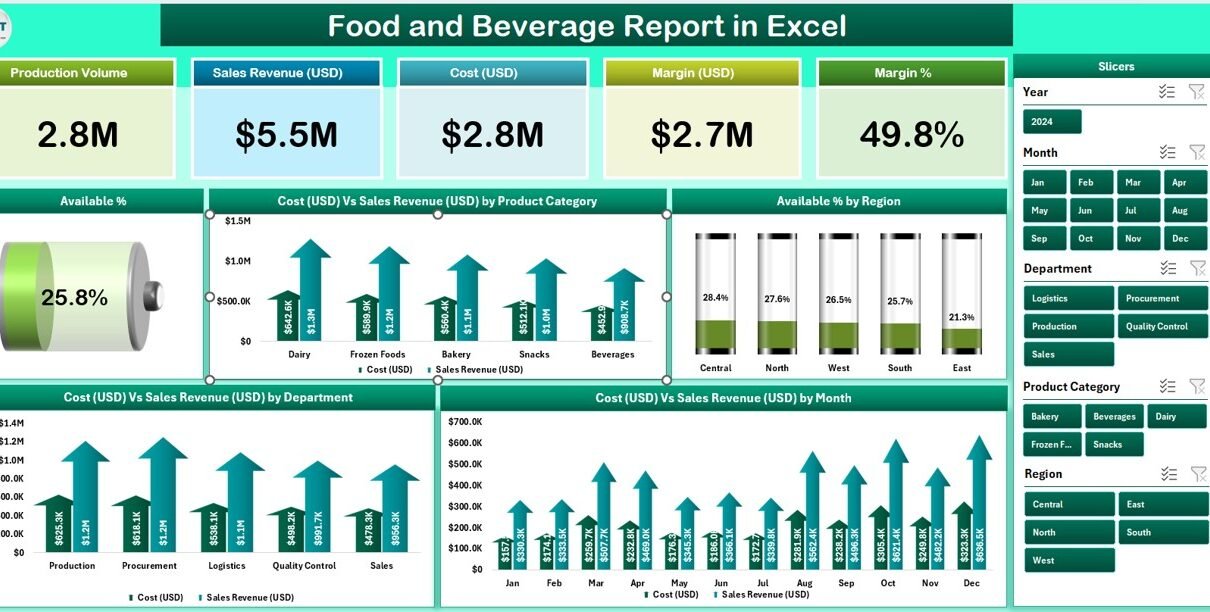
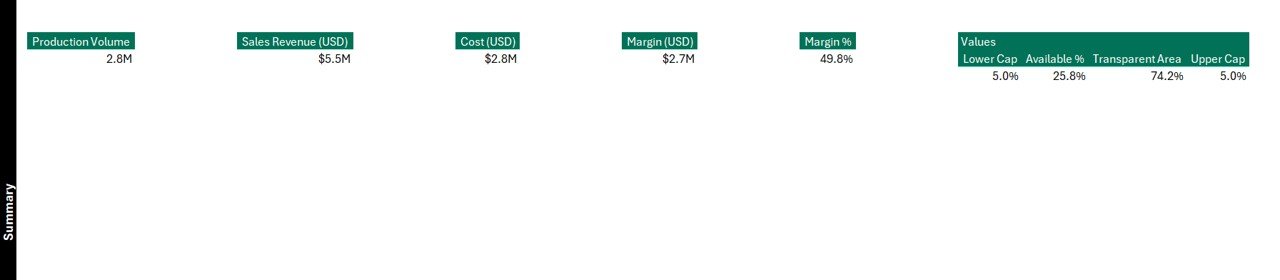
The Summary Page is the heart of the report. It provides a comprehensive snapshot of your business through five KPI cards and multiple interactive charts.
Key elements include:
-
Five KPI Cards: These display critical metrics such as total sales, total cost, profit, availability percentage, and average revenue per product.
-
Right-Side Slicer: Allows users to filter the entire report by product category, region, or department with one click.
Interactive Charts:
- Available % by Product Category
- Cost (USD) vs Sales Revenue (USD) by Category
- Available % by Region
- Cost vs Sales by Department
- Monthly Cost vs Sales Trends
With these visuals, users can instantly identify high-performing regions or products and take timely action.
2. Report Page
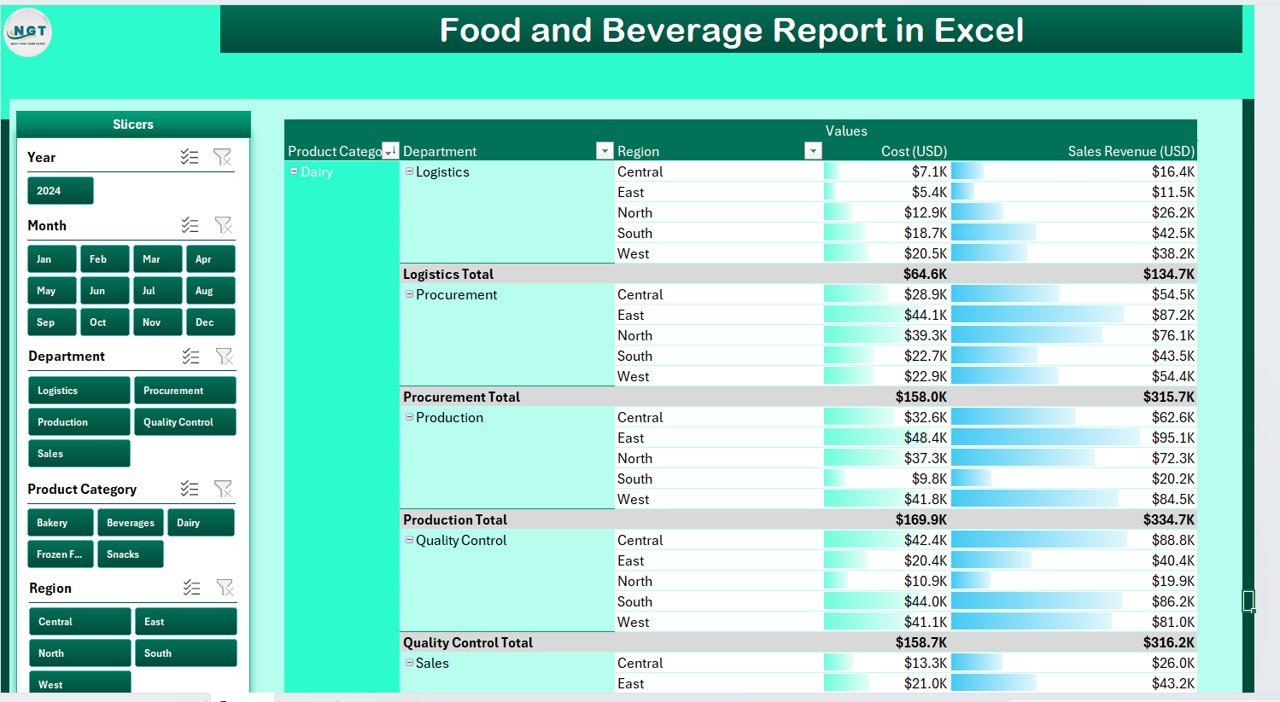
The Report Page functions as your detailed data view.
Highlights:
-
A left-side slicer panel for dynamic filtering.
-
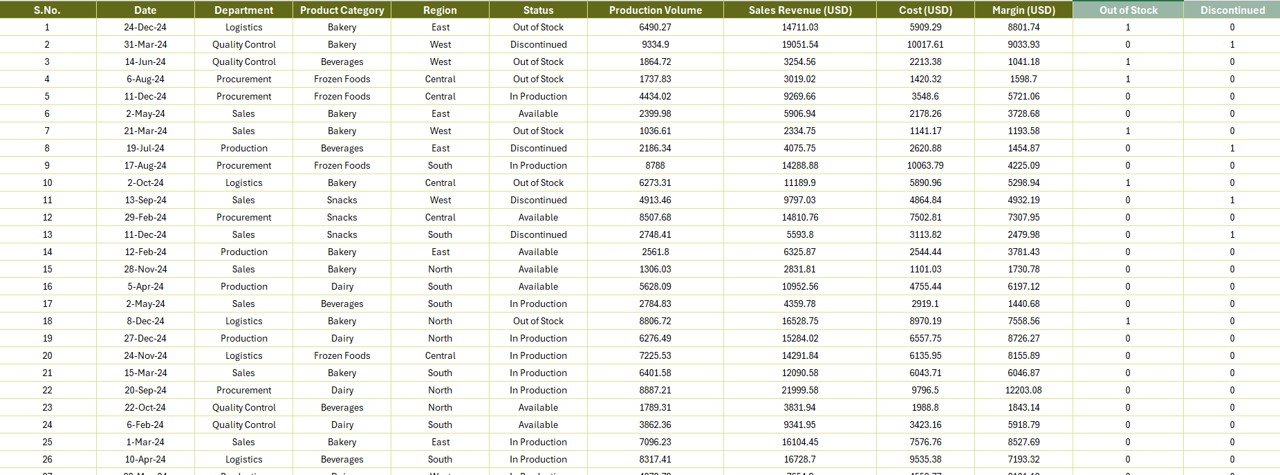
A structured information table displaying transaction-level details, including date, product, category, region, cost, and sales.
-
Real-time updates—when you modify the data sheet, the report refreshes automatically.
This section is ideal for exporting or printing summarized reports for stakeholders or departmental meetings.
3. Data Sheet
The Data Sheet acts as the backbone of the entire report.
It stores the raw data that feeds the dashboard and reports. Each record includes:
-
Product Name
-
Product Category
-
Region
-
Department
-
Cost (USD)
-
Sales Revenue (USD)
-
Availability (%)
-
Date of Transaction
-
Click to Purchases Food and Beverage Report in Excel
You can easily import data from your Point of Sale (POS) system or any ERP. As soon as you refresh the workbook, the dashboard automatically recalculates totals and updates all charts.
4. Support Sheet
The Support Sheet contains reference lists and dropdown values used in slicers and filters. It ensures data accuracy and consistency throughout the workbook.
For example:
-
Product Categories (Beverages, Bakery, Snacks, etc.)
-
Regions (East, West, North, South)
-
Departments (Kitchen, Bar, Service, Delivery)
Having a well-structured support sheet reduces manual errors and speeds up data entry.
Why Use Excel for Food and Beverage Reporting?
Excel remains one of the most reliable and accessible tools for business reporting. It combines flexibility, automation, and visualization capabilities in one platform.
Here’s why it’s perfect for the F&B industry:
-
User-Friendly Interface: No special training required.
-
Customizable Layout: Modify charts, formulas, or KPIs to suit your business.
-
Automation Ready: Use pivot tables, formulas, and macros to automate repetitive tasks.
-
Compatibility: Integrate with POS systems, accounting tools, or other Excel workbooks.
-
Instant Insights: Analyze cost vs revenue and profit margins instantly.
This makes it ideal for small to medium-sized businesses that need quick, data-driven insights without investing in expensive BI software.
How to Use the Food and Beverage Report in Excel
Getting started with this report is simple and quick. Here’s how you can make the most of it:
-
Step 1 – Input Data:
Add your cost, sales, and availability information in the Data Sheet. -
Step 2 – Refresh Pivots:
Once the data is updated, refresh the pivot tables to reflect the latest numbers. -
Step 3 – Use Filters and Slicers:
Select a product category, department, or region from the slicer to filter the entire report dynamically. -
Step 4 – Analyze Charts:
Compare Cost vs Sales or Availability % by Region to spot performance trends. -
Step 5 – Export and Share:
Use Excel’s “Export as PDF” feature to share clean reports with management or clients.
Advantages of Using the Food and Beverage Report in Excel
Let’s explore why adopting this Excel template can significantly benefit your organization.
1. Saves Time
You no longer need to prepare multiple manual reports. With built-in automation, all charts and summaries update instantly.
2. Improves Accuracy
Standardized data entry formats and pre-built formulas reduce errors that occur during manual calculations.
3. Enhances Decision-Making
With KPIs and charts presented clearly, managers can make informed decisions backed by accurate data.
4. Increases Transparency
Department-wise or region-wise comparisons promote accountability and performance tracking across teams.
5. Customizable Design
Modify chart colors, titles, or layouts to match your company’s branding or reporting needs.
6. Budget-Friendly
You get professional-level analytics without paying for high-cost software subscriptions.
📈 Example Analysis Using the Dashboard
Let’s assume your report shows that:
-
The Bakery category has the highest sales but low profit margins.
-
The Beverage category has a high margin but limited availability in certain regions.
-
The North Region consistently outperforms others.
From these insights, management could:
-
Revisit supplier pricing for bakery products.
-
Expand beverage availability in new regions.
-
Allocate more marketing budget to the high-performing north region.
This kind of actionable insight transforms how businesses plan and execute their strategies.
Best Practices for the Food and Beverage Report in Excel
To get the most accurate and valuable insights, follow these best practices:
-
Keep Data Clean and Consistent:
Avoid duplicate product names or inconsistent spellings. -
Update Data Regularly:
Refresh the data sheet weekly or monthly for up-to-date reports. -
Use Data Validation:
Add drop-down menus for regions, categories, and departments to maintain data accuracy. -
Automate Calculations:
Utilize Excel formulas such asSUMIFS,AVERAGEIFS, andVLOOKUPto automate key metrics. -
Visualize Key Metrics Clearly:
Use bar charts for category-wise comparison and line charts for monthly trends. -
Backup Data:
Store your data sheet separately or in a cloud drive for data security. -
Review Historical Trends:
Compare year-over-year performance to identify long-term growth or issues. -
Protect Sensitive Data:
Use Excel’s password protection and restricted access features for secure sharing.
How This Template Helps Different Users
This Excel-based reporting tool serves various stakeholders in the food and beverage industry:
For Restaurant Owners
Track daily sales, food cost, and profit margins. Identify which menu items drive the most revenue.
For Hotel Managers
Monitor departmental performance — kitchen, bar, and catering — and plan budgets accordingly.
For Supply Chain Managers
Evaluate availability percentages and reduce stockouts or wastage.
For Financial Analysts
Compare monthly costs against revenue and highlight profitability trends.
For Executives
Get summarized insights across multiple departments or regions through a single dashboard.
Conclusion
Click to Purchases Food and Beverage Report in Excel
The Food and Beverage Report in Excel is more than a simple spreadsheet — it’s a complete analytical system that empowers businesses to make informed, data-driven decisions.
By centralizing cost, revenue, and performance data, it offers a visual and interactive way to understand your business better. Its simplicity, automation, and flexibility make it an indispensable tool for the food and beverage industry.
Whether you manage a local café, a restaurant chain, or a catering business, this Excel template can help you optimize operations, boost profitability, and drive growth.
❓ Frequently Asked Questions (FAQs)
1. What is the purpose of a Food and Beverage Report in Excel?
The main purpose is to provide a clear overview of sales, costs, and availability across categories, departments, and regions, helping managers make better financial and operational decisions.
2. Can I customize the dashboard charts?
Yes, you can change chart types, colors, and layouts according to your preferences or corporate branding.
3. How often should I update the data sheet?
It’s best to update the data weekly or monthly, depending on how frequently your transactions occur.
4. Is Excel suitable for large data volumes?
Yes, Excel can handle thousands of rows effectively. However, for very large datasets (over 1 million rows), Power BI or Google Sheets with BigQuery integration may be better.
5. Does this template include formulas?
Yes, it comes preloaded with formulas that automatically calculate total cost, total sales, and percentage availability.
6. Can I use it for multiple outlets or regions?
Absolutely. The slicers allow you to filter by region, category, or department, making it ideal for businesses with multiple locations.
7. How can I share the report with others?
You can export it as a PDF or share the Excel file directly via email or a shared drive.
8. Is prior Excel knowledge required?
Not at all! The interface is intuitive and includes prebuilt slicers and formulas, making it suitable even for beginners.
Visit our YouTube channel to learn step-by-step video tutorials
Click to Purchases Food and Beverage Report in Excel