In the modern business world, effective auditing and internal control are essential for maintaining transparency, minimizing risks, and improving operational efficiency. However, managing multiple audits manually can quickly become overwhelming. Teams often struggle to track audit progress, assess high-risk areas, or analyze findings across departments and regions.
That’s where the Audit & Internal Controls Dashboard in Excel becomes a game-changer.
This ready-to-use, data-driven dashboard template allows audit teams to track, analyze, and visualize audit performance — all within the familiar and flexible environment of Microsoft Excel.
Click to Purchases Audit & Internal Controls Dashboard in Excel
In this article, we’ll explore everything you need to know about this Excel-based dashboard, including its structure, features, benefits, best practices, and practical tips for using it effectively in your organization.
What Is an Audit & Internal Controls Dashboard in Excel?
An Audit & Internal Controls Dashboard in Excel is an interactive analytical tool designed to help audit professionals monitor key metrics related to audit execution, risk assessment, and financial impact.
It transforms raw audit data into easy-to-understand visuals, enabling managers to make data-driven decisions and maintain robust control over compliance processes.
Instead of manually generating audit reports or sifting through endless spreadsheets, users can simply update the data sheet and see all charts, KPIs, and trends refresh automatically.
It’s ideal for both internal audit departments and external consultants who manage audits across multiple business units or locations.
Key Features of the Audit & Internal Controls Dashboard in Excel
This dashboard template includes five analytical pages, each with a unique purpose and visual focus.
Here’s an in-depth look at its structure and functionality:
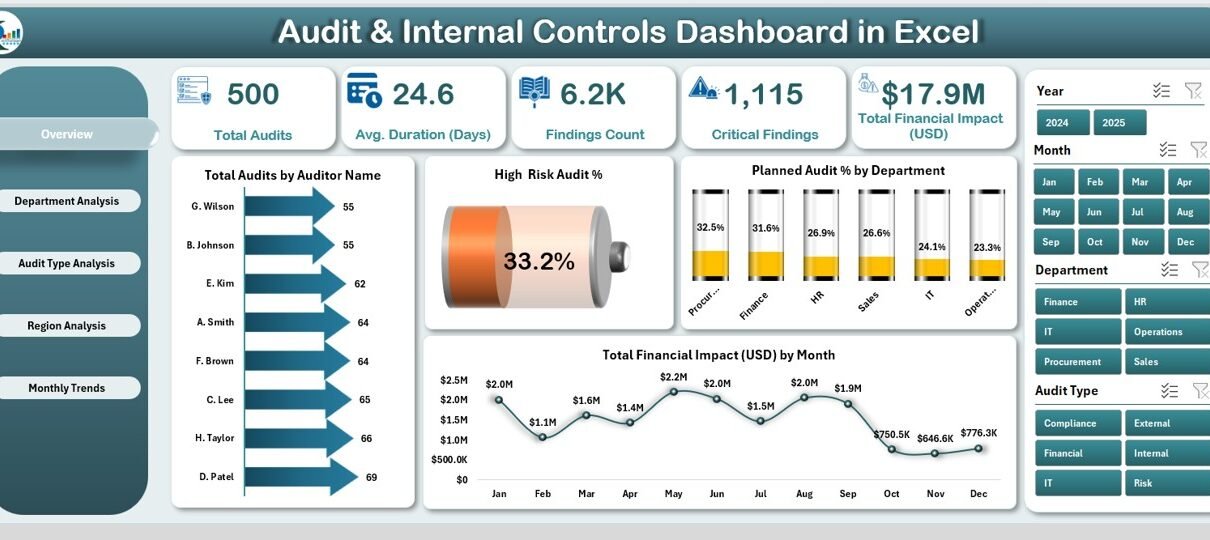
1. Overview Page
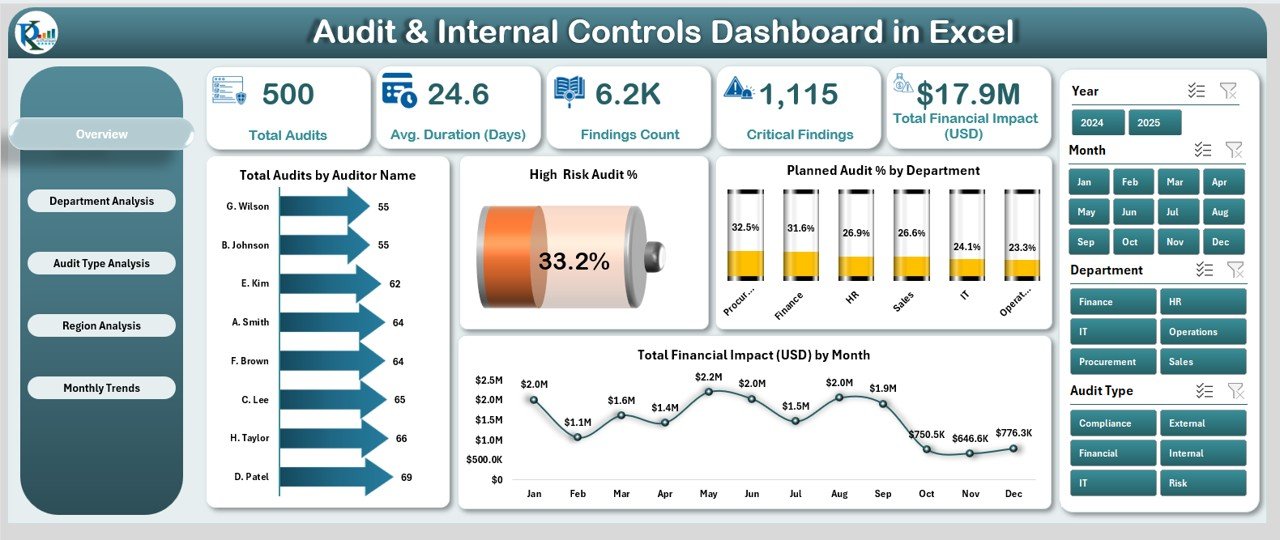
The Overview Page acts as the main command center of the dashboard.
It provides a high-level summary of audit activities and key risk indicators.
Highlights:
-
Right-Side Slicer: Allows quick filtering by month, department, region, or auditor.
Five KPI Cards:
- Total Audits
- High-Risk Audit %
- Planned Audit %
- Total Financial Impact (USD)
- Findings Count
Interactive Charts:
- Total Audits by Auditor Name
- High-Risk Audit %
- Planned Audit % by Department
- Total Financial Impact (USD) by Month
These visuals offer an instant understanding of audit distribution, risk exposure, and financial outcomes. Decision-makers can quickly identify trends and prioritize audits needing immediate attention.
2. Department Analysis

This page focuses on performance and risk across departments, helping audit heads identify high-risk areas and track departmental compliance.
Highlights:
-
Right-Side Slicer: Enables department-based filtering for focused insights.
Charts Included:
- High-Risk Audit % by Department
- Finding Count by Department
- Total Financial Impact (USD) by Department
With these charts, you can easily evaluate which departments have the most findings, where audit risks are high, and how financial implications vary across business units.
Click to Purchases Audit & Internal Controls Dashboard in Excel
3. Audit Type Analysis

Every audit type — whether operational, financial, or compliance — carries different levels of risk and importance.
This page helps you understand how different audit categories perform and contribute to overall risk management.
Highlights:
-
Right-Side Slicer: For quick filtering by audit type or time frame.
Charts Included:
- Critical Findings by Audit Type
- Completed Audit % by Audit Type
- Total Financial Impact (USD) by Audit Type
This view helps identify which audit types consistently produce critical findings or large financial impacts, supporting data-driven resource allocation.
4. Region Analysis

For organizations operating in multiple regions, tracking performance by geography is vital.
This page highlights how audit results vary across locations.
Highlights:
-
Right-Side Slicer: Enables region-based filtering.
Charts Included:
- Total Financial Impact (USD) by Region
- Planned Audits by Region
- High-Risk Audit % by Region
These charts help you uncover regional trends, compliance weaknesses, or specific locations that require additional attention or resources.
5. Monthly Trends
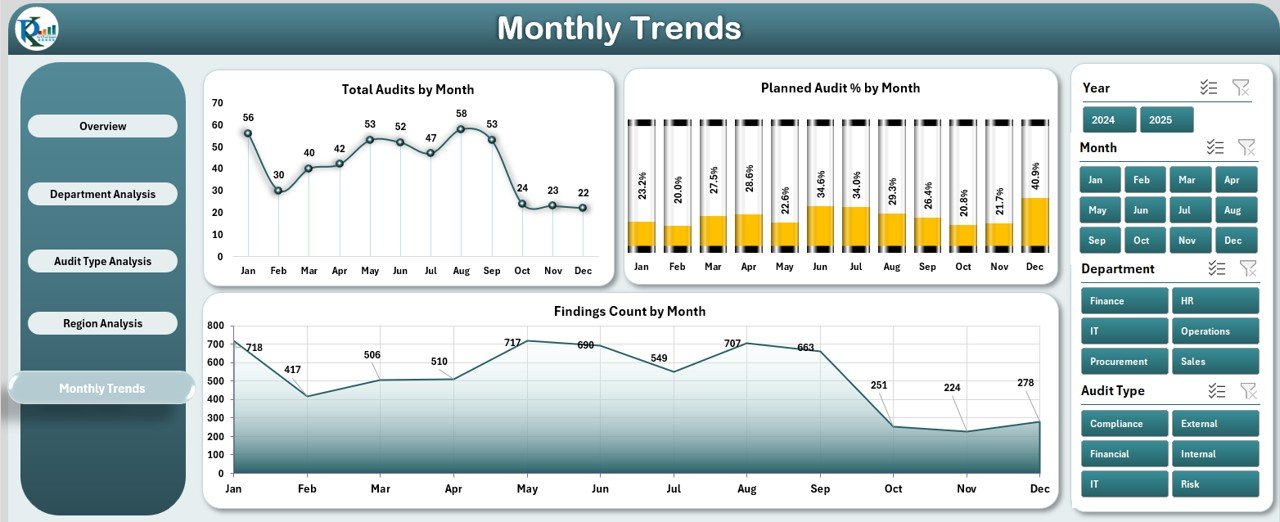
Understanding trends over time is critical for proactive decision-making.
The Monthly Trends Page visualizes changes in audit activity, findings, and risk levels month by month.
Highlights:
-
Right-Side Slicer: Quickly filter by month or year.
Charts Included:
- Total Audits by Month
- Planned Audit % by Month
- Finding Count by Month
- Total Financial Impact (USD) by Month
- This trend-based view helps audit managers identify seasonal patterns, evaluate performance improvements, and plan future audits more effectively.
Support and Data Sheets
-
Support Sheet: Contains reference data such as lists of auditors, departments, audit types, and regions. This ensures dropdown menus and slicers work seamlessly.
Data Sheet: The core data entry section. You can paste or import audit records, and all visuals update automatically.
- Together, these sheets ensure smooth dashboard functionality and easy customization.
Why Use an Audit & Internal Controls Dashboard in Excel?
- Auditing is not just about identifying errors — it’s about ensuring continuous improvement and accountability. Using an Excel-based dashboard simplifies this process while offering deep analytical insights.
- Here’s why organizations prefer this solution:
-
Simplicity:
No need for complex software. Excel’s interface is intuitive and widely used. -
Automation:
All charts and KPIs update automatically once new data is entered. -
Flexibility:
Users can modify layouts, add charts, or expand data fields as needed. -
Visual Insights:
Interactive slicers and color-coded visuals make it easy to interpret complex audit data. -
Data Integrity:
Reduces manual errors and helps maintain accurate audit records. -
Cost-Effective:
Since it’s built in Excel, no additional licenses or tools are required.
Advantages of Using the Audit & Internal Controls Dashboard in Excel
- The benefits of this dashboard go far beyond data visualization.
It transforms how audit and compliance teams operate daily.
1. Centralized Audit Management
- All audit-related data — including findings, risk ratings, and financial impacts — stay in one structured workbook. This ensures consistency and accessibility across the organization.
2. Improved Transparency
- Interactive visuals make it easy to communicate audit progress and risk exposure to stakeholders.
Transparency encourages accountability and fosters trust.
3. Real-Time Tracking
- Since all charts update instantly, audit managers can monitor progress in real-time, spotting delays or risk trends early.
4. Data-Driven Decision Making
- By analyzing historical data, departments can identify recurring issues and take corrective actions before risks escalate.
5. Enhanced Reporting
- Export dashboards or screenshots directly into presentations or reports, saving hours of manual work.
How to Use the Audit & Internal Controls Dashboard
Click to Purchases Audit & Internal Controls Dashboard in Excel
- Using this Excel template is simple and efficient. Here’s a step-by-step guide:
-
Enter Data in the Data Sheet
Fill in fields such as Audit ID, Department, Region, Audit Type, Auditor Name, Findings, Financial Impact, and Completion Status. -
Refresh Pivot Tables (if required)
Click “Refresh All” to ensure charts update based on the latest entries. -
Navigate Through Pages
Use the left-side Page Navigator to switch between Overview, Department, Audit Type, Region, and Monthly Trends pages. -
Apply Filters
Use the slicers on the right side to filter results by department, region, audit type, or month. -
Analyze Results
Review KPIs and visual trends to identify areas for improvement and action.
Who Can Benefit from This Dashboard?
- This dashboard suits a wide range of professionals and industries.
It’s ideal for: -
Internal Audit Teams
-
Finance and Risk Management Departments
-
Compliance Officers
-
External Audit Consultants
-
Business Analysts
-
Corporate Governance Teams
- Whether you work in manufacturing, finance, education, or public administration, this Excel dashboard can easily adapt to your data and workflow.
Customization Possibilities
- One of Excel’s biggest strengths is flexibility.
You can personalize this dashboard to align with your organization’s goals. - Here are a few customization ideas:
-
Add new KPIs such as Audit Completion Rate or Average Financial Impact per Audit.
-
Integrate color-coded conditional formatting for risk severity.
-
Include slicers for Auditor Name or Finding Category.
-
Connect the dashboard to external data sources like SQL or Power BI for live updates.
Best Practices for Using the Audit & Internal Controls Dashboard in Excel
- To make the most of this tool, follow these best practices:
-
Keep Data Clean and Consistent
Use consistent naming conventions for departments, regions, and audit types. -
Update Data Regularly
Refresh the dashboard weekly or monthly to ensure accuracy. -
Use Dropdowns Instead of Manual Entry
This prevents data mismatches and maintains integrity. -
Monitor KPIs Closely
Focus on key metrics like High-Risk Audit %, Findings Count, and Financial Impact. -
Backup Your Workbook
Save periodic copies to prevent data loss. -
Communicate Insights
Use visuals from the dashboard in meetings to highlight performance and areas for improvement. -
Train Your Team
Ensure every team member understands how to read and use the dashboard effectively.
Common Challenges and How to Overcome Them
- Even with a well-designed dashboard, users may face certain challenges.
Here’s how to handle them efficiently: -
Data Overload:
Break data into smaller chunks or use filters for focused analysis. -
Incorrect Chart Results:
Verify that slicers and pivot tables are connected to the correct data source. -
Formatting Issues:
Lock design elements and use data validation rules to maintain consistency. -
Slow Performance:
Avoid large image files or excessive formatting to keep the workbook lightweight.
Conclusion
- The Audit & Internal Controls Dashboard in Excel is more than just a reporting tool — it’s a complete audit management system.
It empowers teams to monitor audit performance, track risks, and measure financial impact through clear visuals and structured analytics. - With this ready-to-use template, organizations can transition from manual tracking to a smarter, data-driven audit process.
It saves time, enhances accuracy, and provides valuable insights for continuous improvement. - Whether you’re managing internal audits, compliance reviews, or financial checks, this Excel dashboard provides the clarity and control needed to make informed decisions.
Frequently Asked Questions (FAQs)
1. What is the purpose of an Audit & Internal Controls Dashboard in Excel?
The dashboard helps audit professionals monitor audit activities, track risks, and measure financial impacts in real time. It simplifies reporting and enhances transparency across departments.
2. Can I customize this dashboard for my organization?
Yes. You can add or remove charts, modify KPIs, or connect it with external data sources like SQL or Power BI.
3. Do I need advanced Excel skills to use it?
Not at all. The dashboard is beginner-friendly. You only need basic Excel knowledge to enter data and interpret visuals.
4. How often should I update the data?
Ideally, update it after every completed audit or at least once a month to keep reports accurate and current.
5. Can I share this dashboard with my team?
Yes. You can save it on a shared drive or cloud location for team access. Just ensure version control to avoid overwriting.
6. Is this dashboard suitable for external auditors?
Absolutely. It’s useful for both internal and external auditors who want to visualize and analyze audit results effectively.
7. Can I integrate this with Power BI later?
Yes. Since it’s built in Excel, you can easily import the same data model into Power BI for advanced visualizations.
Click to Purchases Audit & Internal Controls Dashboard in Excel
Visit our YouTube channel to learn step-by-step video tutorials
Watch the step-by-step video tutorial: